
Summary - Aimsio uses Klipfolio dashboards to connect data from HubSpot, Zendesk, Atlassian, and their own APIs into one central hub. See how real-time KPI tracking transformed the way their sales, support, and marketing teams make decisions.
Erin Christensen is the Content Marketing and Social Media Specialist at Aimsio, a cloud-based field services management platform. Collaborating with the sales team is one of the most important parts of her role, and she uses Klipfolio every day to track leads and support their efforts.
About Aimsio
Aimsio helps companies gain control of their field operations by streamlining processes and providing one central location for all field data. No more paper field tickets, disconnected systems, or revenue leakage. Aimsio's platform provides seamless communication from field to finance, all under one roof.
Why Aimsio chose Klipfolio
When asked why Aimsio chose Klipfolio, Erin told us: "We are a data-driven team and wanted to go beyond the generic reporting functionalities of platforms we use on a daily basis. Some of those platforms are: HubSpot, Atlassian (JIRA and Confluence), Zendesk, etc. We were looking for a dashboard platform for flexible data visualization that was flexible enough to allow us to dissect the data in any shape or form we wanted, but also integrated with as many platforms as possible. Klipfolio checked all those boxes!"
Before using Klipfolio, Aimsio relied on multiple disconnected sources to report on performance. Now they connect to every system, including their own internal database and APIs. Using the Klip Editor and its built-in functions, Aimsio customizes their data visualizations to surface key insights and build dashboards around the metrics that matter most to their team.
How Aimsio uses Klipfolio
Klipfolio is the central hub for all of Aimsio's KPI tracking and monitoring. Their team has built dashboards for Sales, Social Media, Support, Web Analytics, and Development Sprints. Each dashboard serves a specific purpose: tracking leads through the sales funnel, monitoring open support tickets and customer satisfaction, recording website visits, and measuring social media growth.
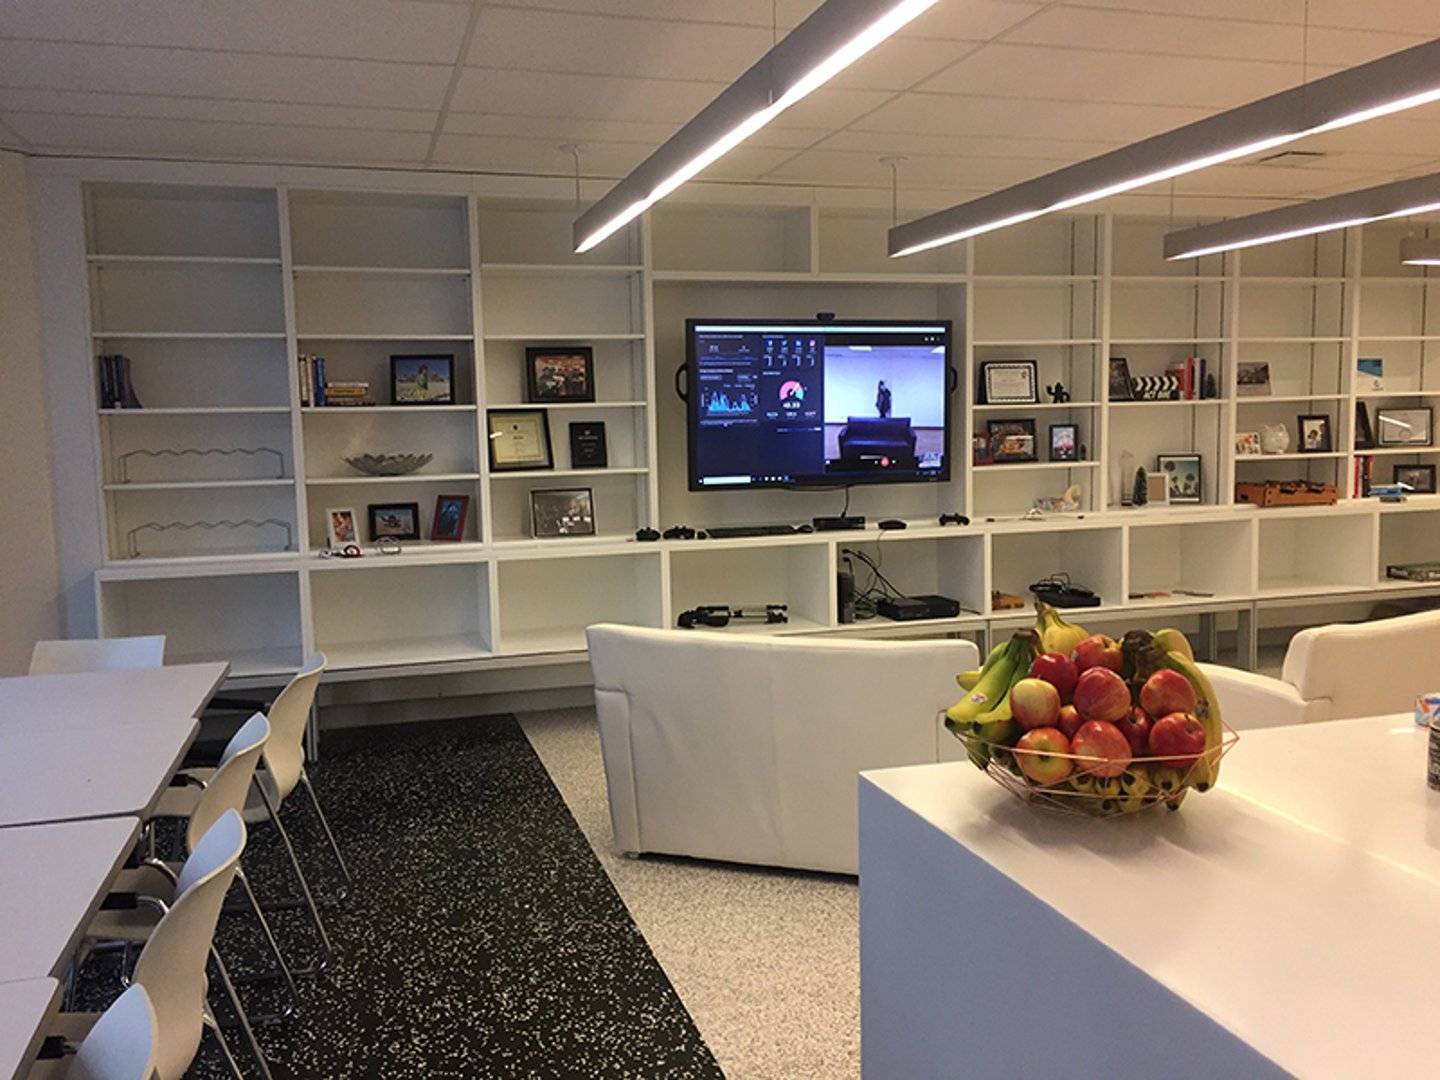
The Aimsio sales dashboard sits at the centre of their weekly sales meeting. Erin says: "The real-time nature and accuracy of the data is critical in having an open and productive conversation. It's simple to see our sales funnel dashboard at a glance and gives us the ability to be agile and make decisions that will make us more efficient."
How Klipfolio has impacted Aimsio
We asked Erin whether Klipfolio has changed the way Aimsio works. Her answer was direct: "Absolutely. We are now able to be proactive instead of being reactive. Our sales team, for example, reviews a dashboard that gets data integration from multiple sources in one spot and in real-time. They review activities that would have been impossible to see in a single system if it wasn't for Klipfolio. We are able to make better decisions and be on top of our KPIs on a daily basis thanks to Klipfolio's ability to amalgamate the data in a powerful and effective way."
Aimsio continues to roll out new dashboards and is currently finalizing their marketing dashboard.
Metrics tracked by Aimsio
Aimsio tracks hundreds of metrics with Klipfolio. Here are some of the key metrics their team monitors:
- Website visits: Tracking traffic to understand audience reach and campaign performance; see web analytics dashboards for examples
- X (platform) followers: Monitoring social growth on X alongside other channels; see related X followers metric
- LinkedIn engagement: Measuring post interactions and audience growth
- Facebook page visits: Keeping tabs on social traffic and brand visibility
- Qualified sales leads: Tracking pipeline health and lead quality through the funnel
- Open tickets: Monitoring support volume and team workload in real time
- Resolved tickets: Measuring support efficiency and closure rates
- Response rate: Gauging how quickly the team responds to customer inquiries
- Customer satisfaction: Tracking CSAT score monitoring to maintain service quality
- Bug trackers: Keeping development teams aligned on outstanding issues and sprint progress
Related Articles

PayTabs embraces a data-driven strategy with KPI dashboards
By Mitch Dupuis — June 25th, 2025
Klipfolio helps Ascentis manage team performance using hard facts
By Mitch Dupuis — August 13th, 2024
How Klipfolio Data Heroes helped Curotec automate real-time reporting
By Mitch Dupuis — December 5th, 2023