
Summary - Monitoring is a major challenge and 24/7/365 priority for DevOps. The question is: Can DevOps teams have a life in the age of cloud-based software?
The rapid development of cloud-based software (think Klipfolio, Salesforce, Dropbox and Shopify) is driving a major shift in how software development organizations operate today. Unlike traditional on premise solutions controlled locally, a cloud-based app runs in a data center and the development organization is often responsible for making sure it works as expected 24X7. This change, as well as the demand for moving toward continuous and accelerated delivery of new features and fixes, have brought the development and ops organizations closer together resulting in a new hybrid organization known as DevOps.
DevOps is a combination of processes, infrastructure, automated scripts, configuration management, monitoring systems and people who work toward two primary goals:
1) Keep the service operational and responsive 24X7
2) Deliver features and fixes continuously to customers
There are obviously a lot of moving parts and complexity to hold the pieces together. Successfully monitor the related data points produced by the involved systems and processes is one of the main pillars for building a successful DevOps team.
Speaking of data points, when it comes to DevOps, there are many of those. I believe that the three Vs of big data - variety, volume and velocity - directly apply to monitoring the DevOps systems and processes. Let’s review the three Vs in the context of DevOps.
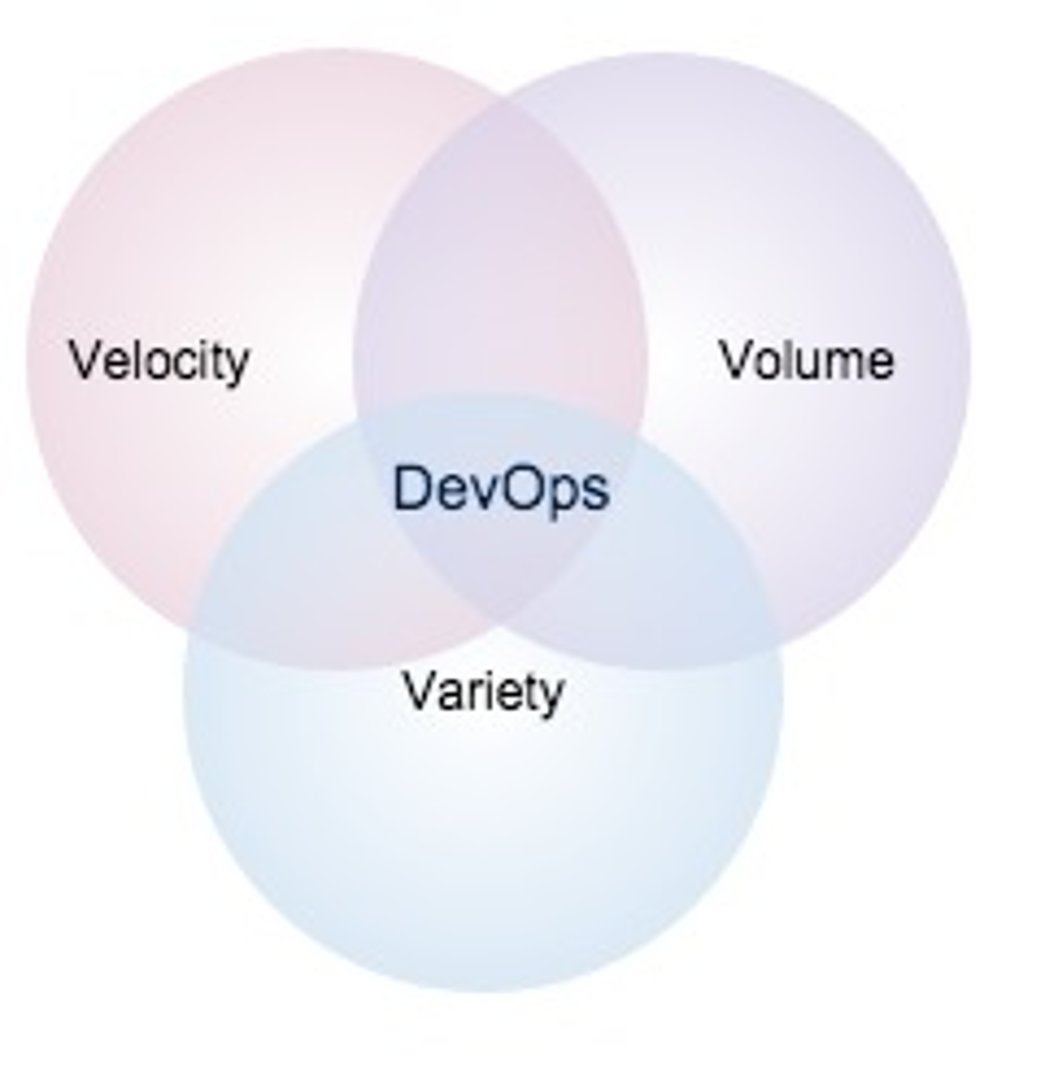
Variety: There is no shortage in the number of services, systems, and log files with useful information that are monitored and can either save the day or help us get the job done. The following diagram shows the typical data points that DevOps experts monitor and deal with on a daily basis. These data points include a large spectrum of data anywhere from system level and hardware malfunctions to latest build readiness and finally overall production health and app uptime.
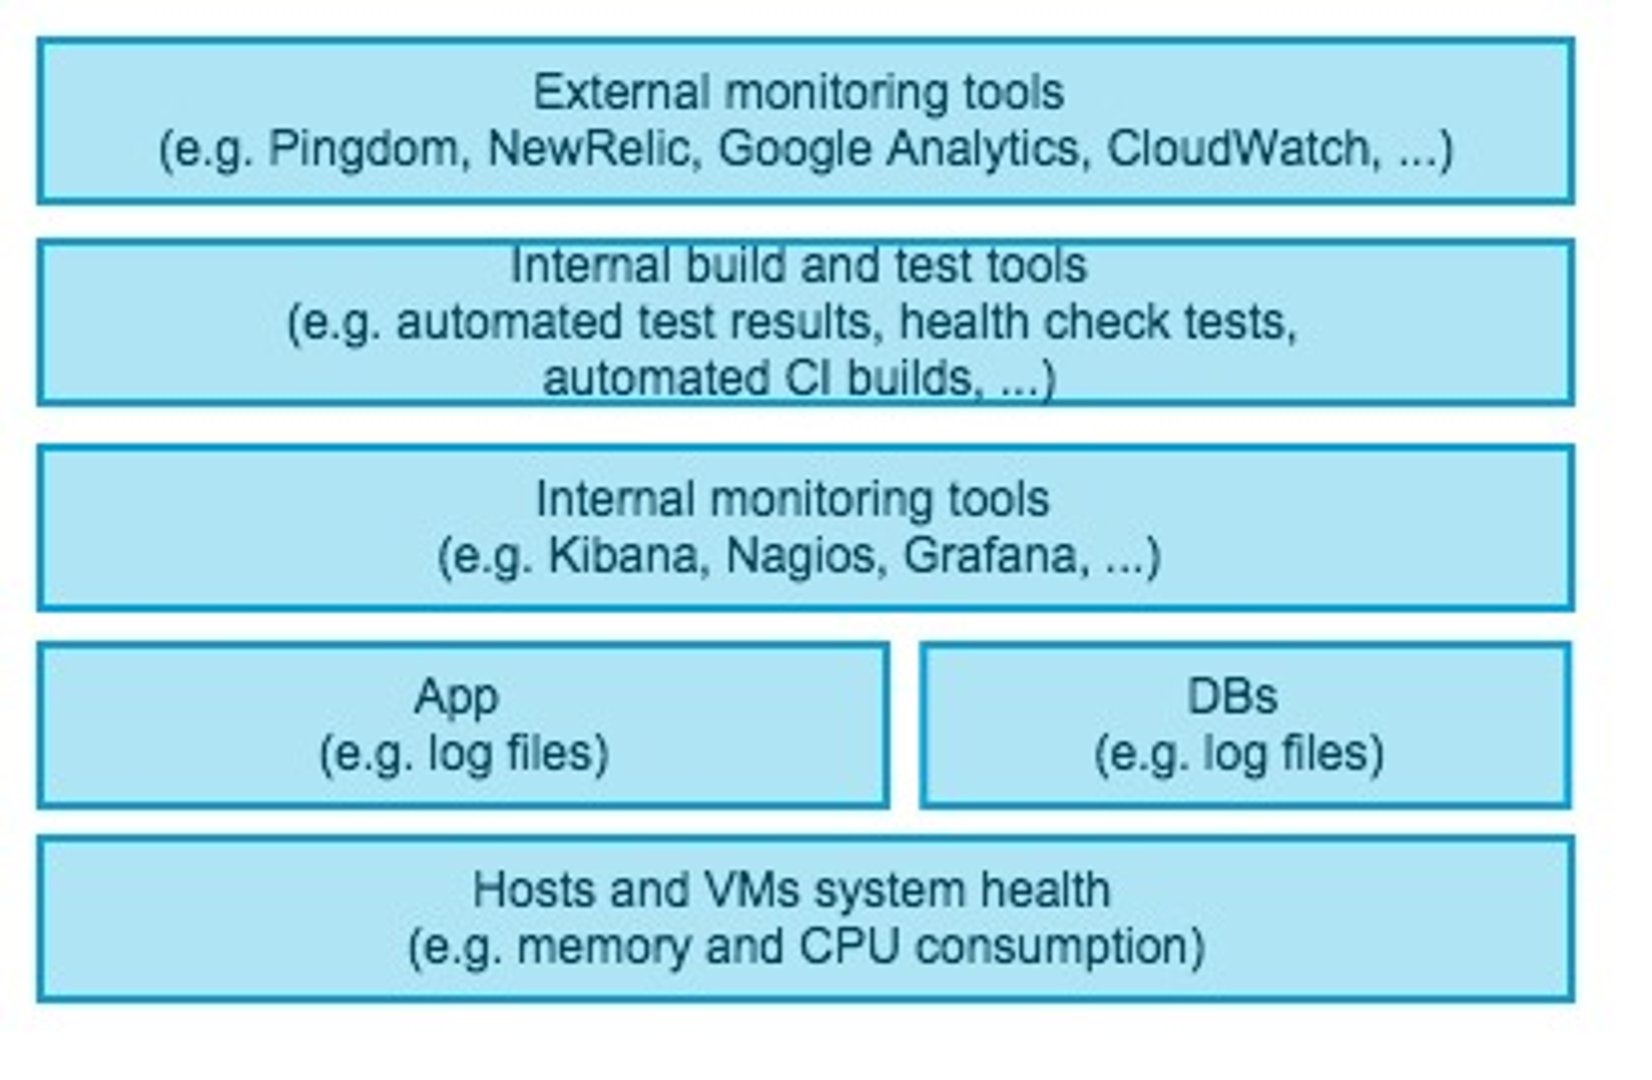
Volume: Just adding up all the above data points creates a huge volume. Now, multiply that by many servers in various data center locations and thousands of users who each contribute to the volume of data generated and we are talking terabytes of data.
Velocity: The flow of data is continuous 24x7 for cloud software that is available around the globe.
As the business grows and as more systems and users are added to the mix, the three Vs will continue to increase exponentially as well. The key question now is how will DevOps professionals manage this crazy growth, succeed at monitoring all these data points, and also have a life! This is going to be our big challenge in the DevOps community going forward and one that we are learning more about here at Klipfolio as our business grows.
One thing is very clear to us already: it’s not possible to monitor the vast amounts and variety of data streaming in with the naked eye. Instead, we have discovered that the key to success is a combination of mashups, auto-refreshing and aggregation of data points.
Luckily, Klipfolio is designed at its core to solve this very problem - we excel at aggregating and mashing up data from various services and presenting this information in the form of crisp Klips on a dashboard. So yeah, we are drinking our own champagne and using our own product to monitor the data points critical to our DevOps team.
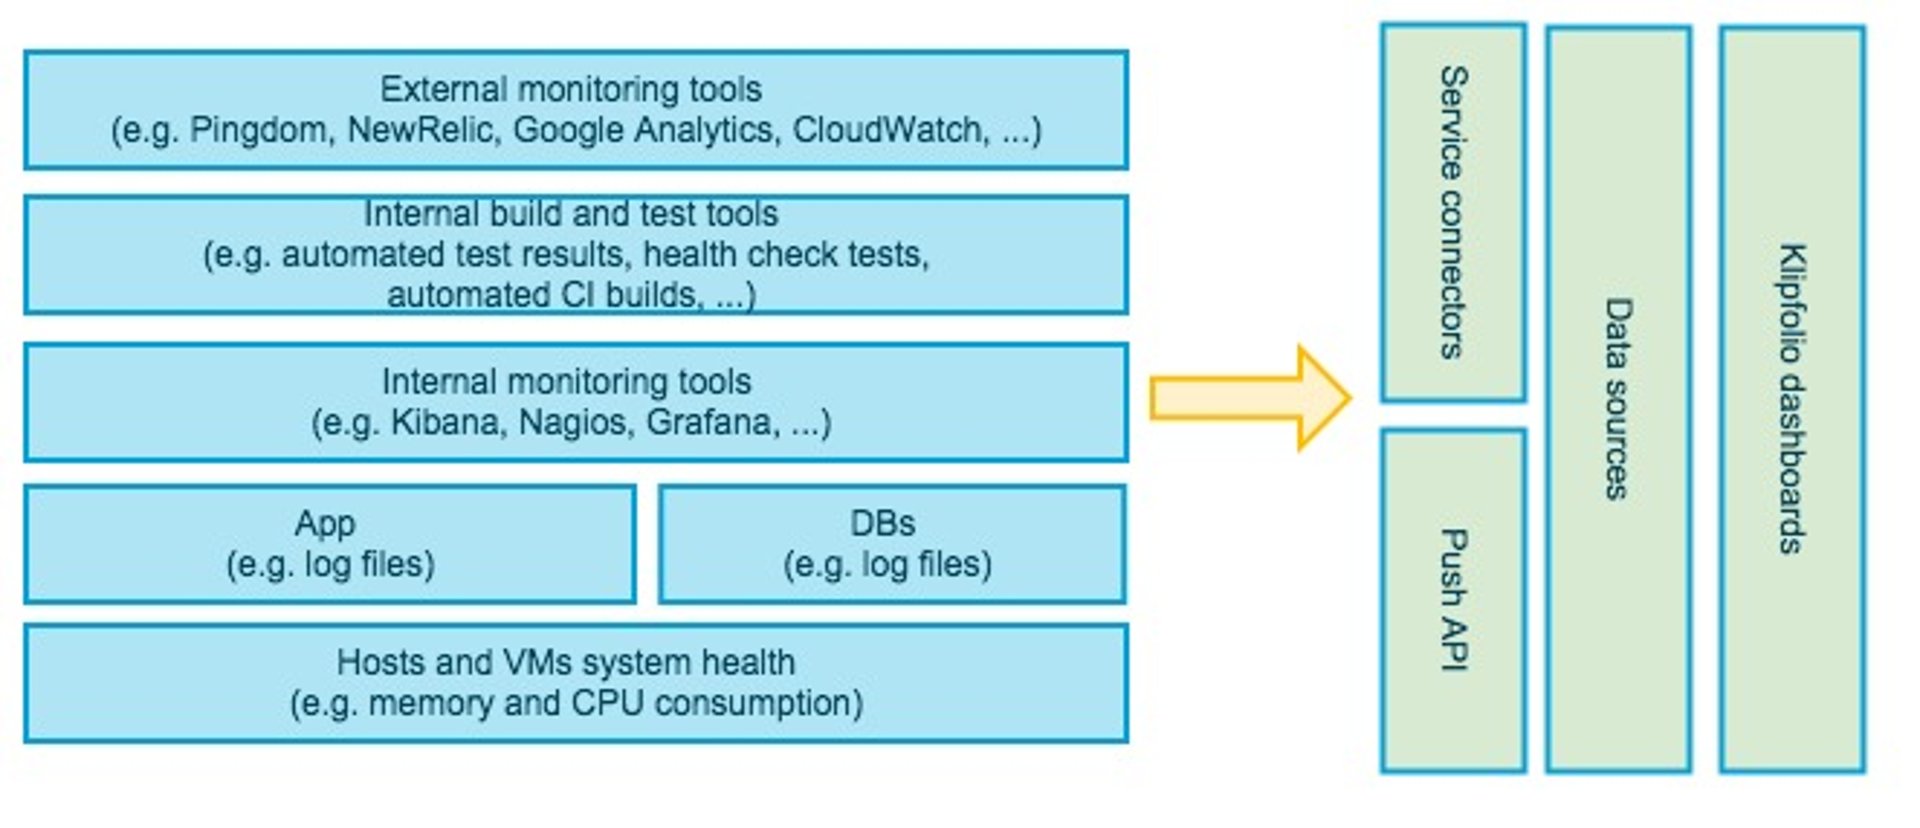
The following diagram shows how using Klipfolio can help DevOps teams gain a better handle on what they need to monitor. In summary, Klipfolio has service connectors and ready to use templates for services like Pingdom and NewRelic. In addition, Klipfolio can connect to many other RESTful services using a generic Web API connector. The Klipfolio platform also supports a Push API. This means that if your DevOps systems produce custom formats that are not accessible from outside the firewall or for other reasons you can not use the out of the box Klipfolio connectors, you can always upload your data to Klipfolio servers using the Push API.
Finally, the flexible and powerful Klipfolio visualization editor allows you to mash up data from various services and show it in one visualization. For instance, you can combine the data from Pingdom, NewRelic, and your own log files to see the correlation between the three when it comes to response or down time. The combinations and permutations that you can build in Klipfolio for a better view of your complex DevOps environment and processes are endless.
For instance, the following example Klip shows one of our visualizations that combines data points from Google Analytics and Pingdom. In this case, you can monitor the number of sessions and average response time at the sametime and observe how the increase in the number of sessions may be impacting the app response time.
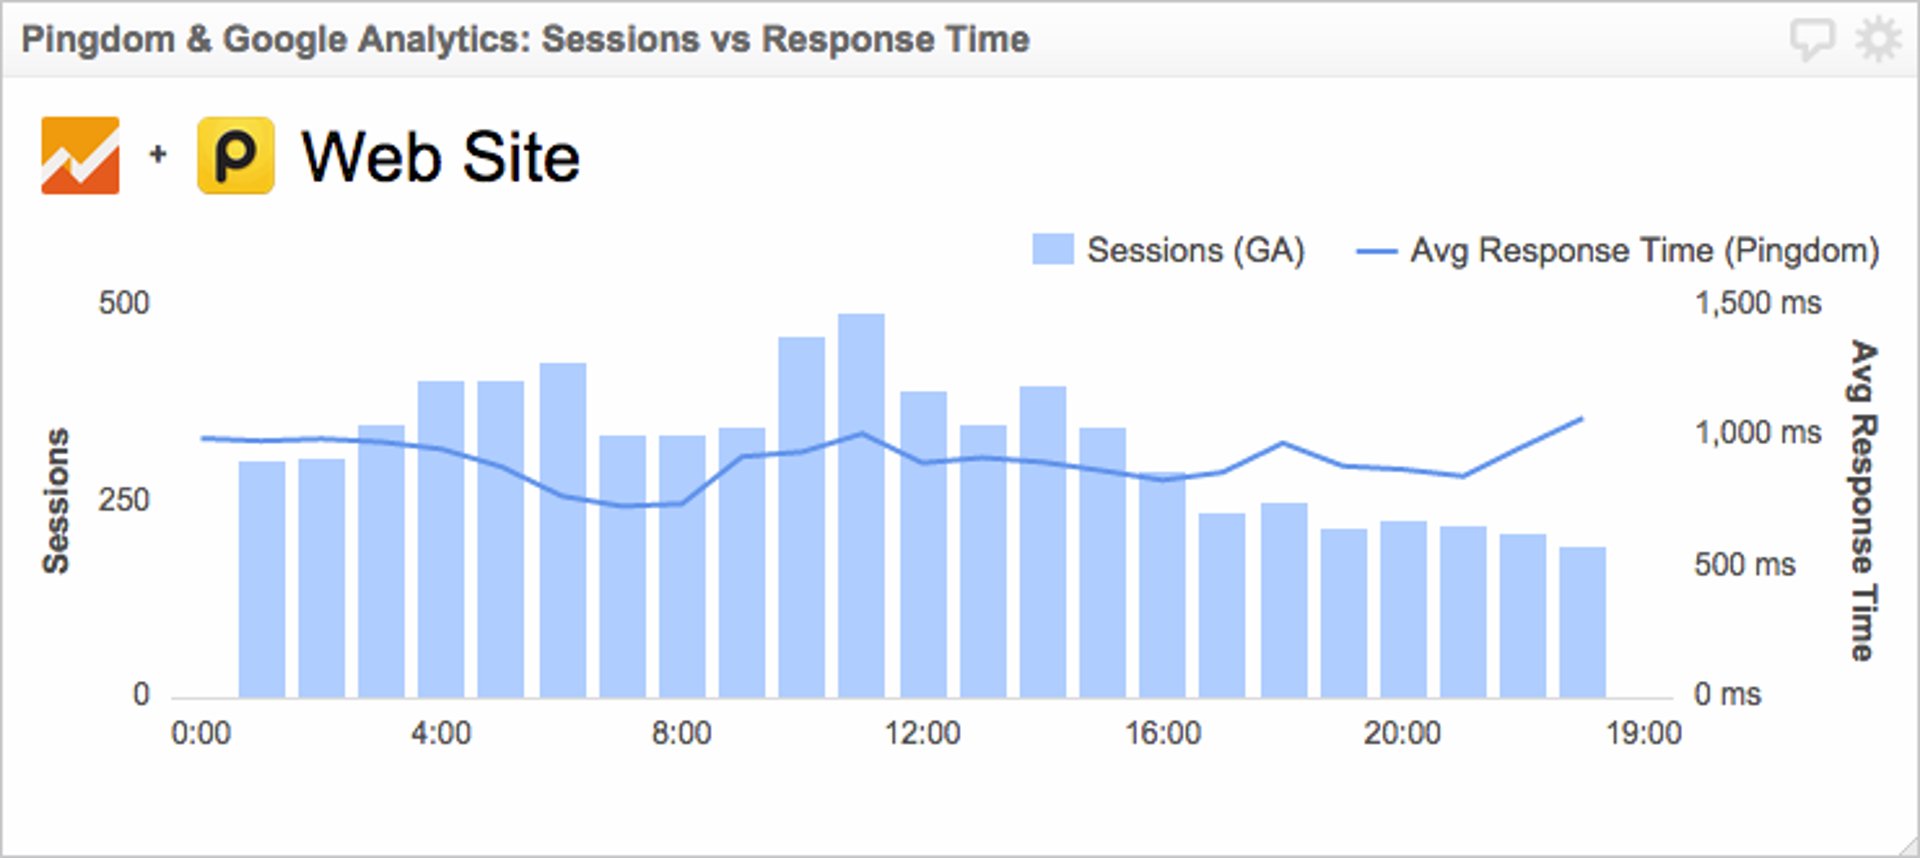
Check out our live Pingdom dashboard
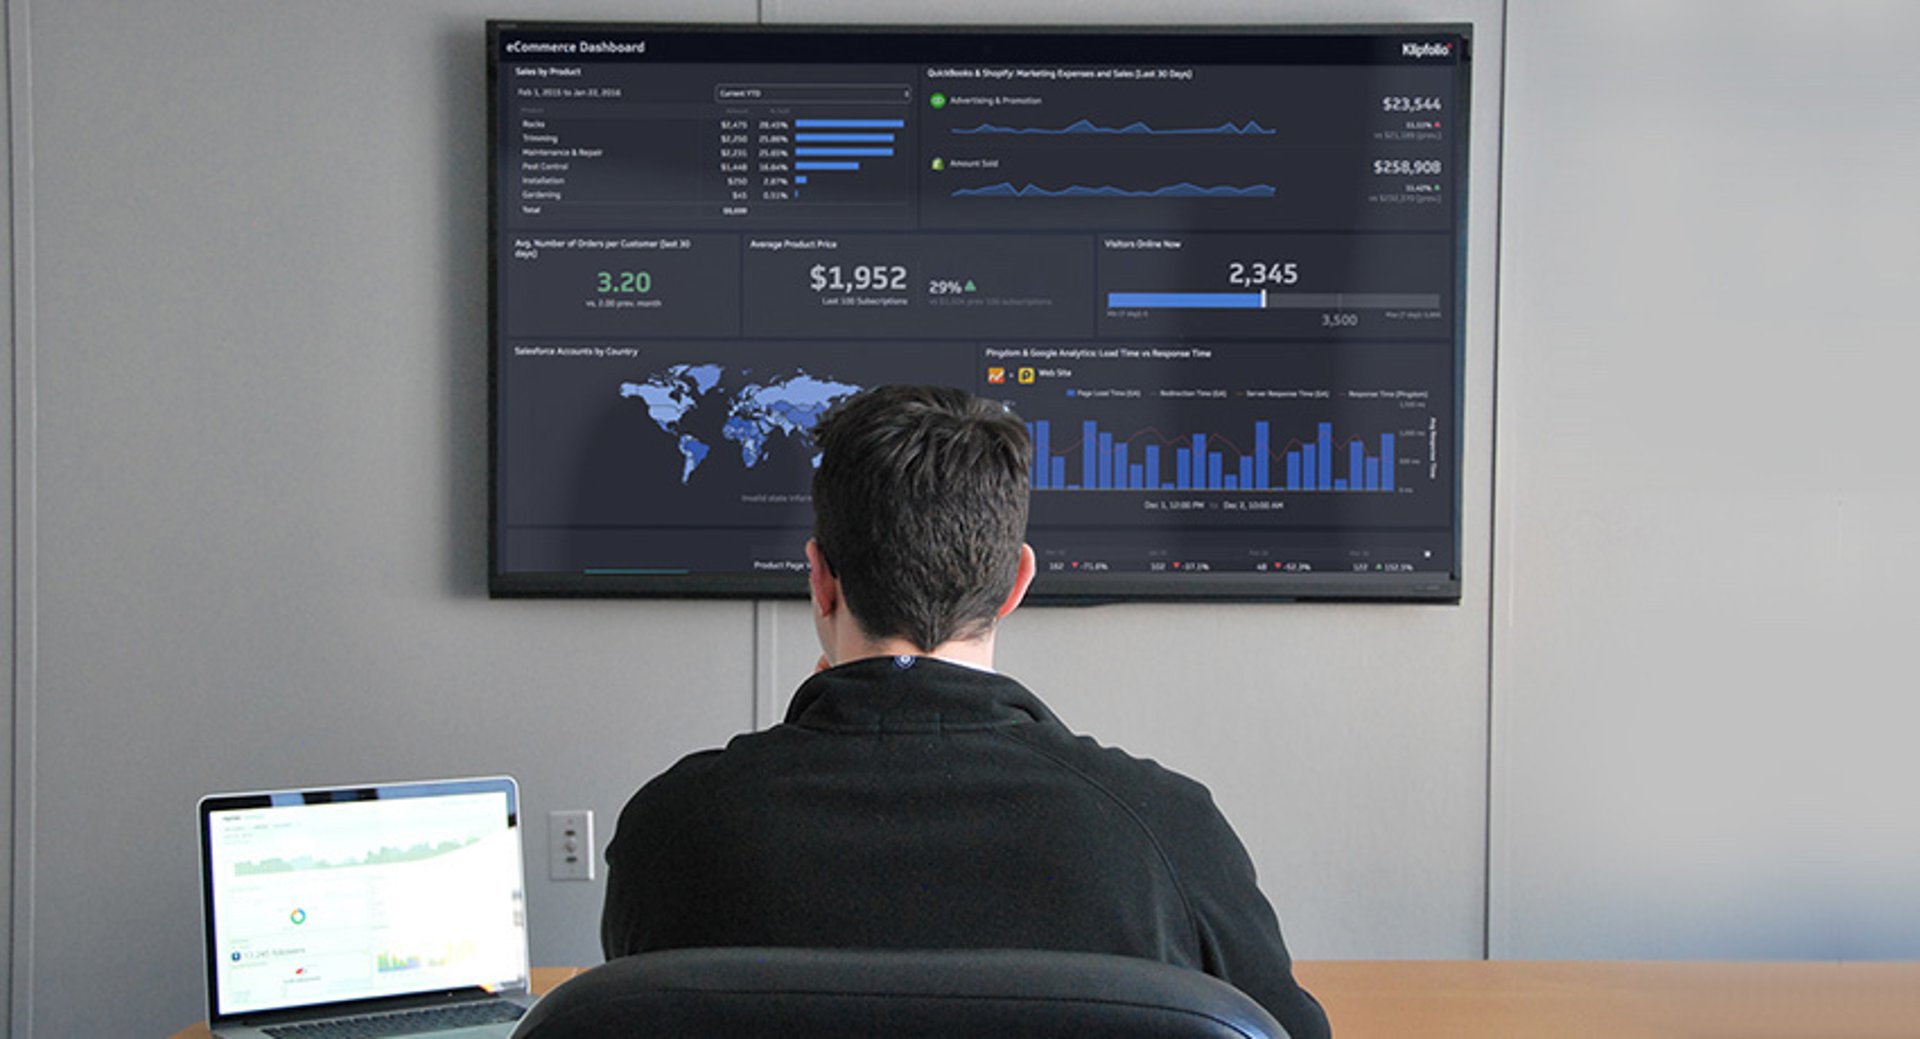
The Klipfolio dev team uses Klipfolio dashboards to monitor our systems and processes, while continuing to use services like pingdom for their SMS and notification capabilities. Our DevOps dashboard shows the most important data points from various external and internal services together. This dashboard is not only projected on our large TV as a wallboard dashboard but also is accessible via mobile devices and can be monitored on the go, which is really handy when it comes to production and DevOps issues and having a life...