Healthcare Metrics & KPIs
Metrics & KPIs for modern healthcare workers
Track all your Healthcare KPIs in one place
Sign up for free and start making decisions for your business with confidence.
The data your team needs to make the right call.
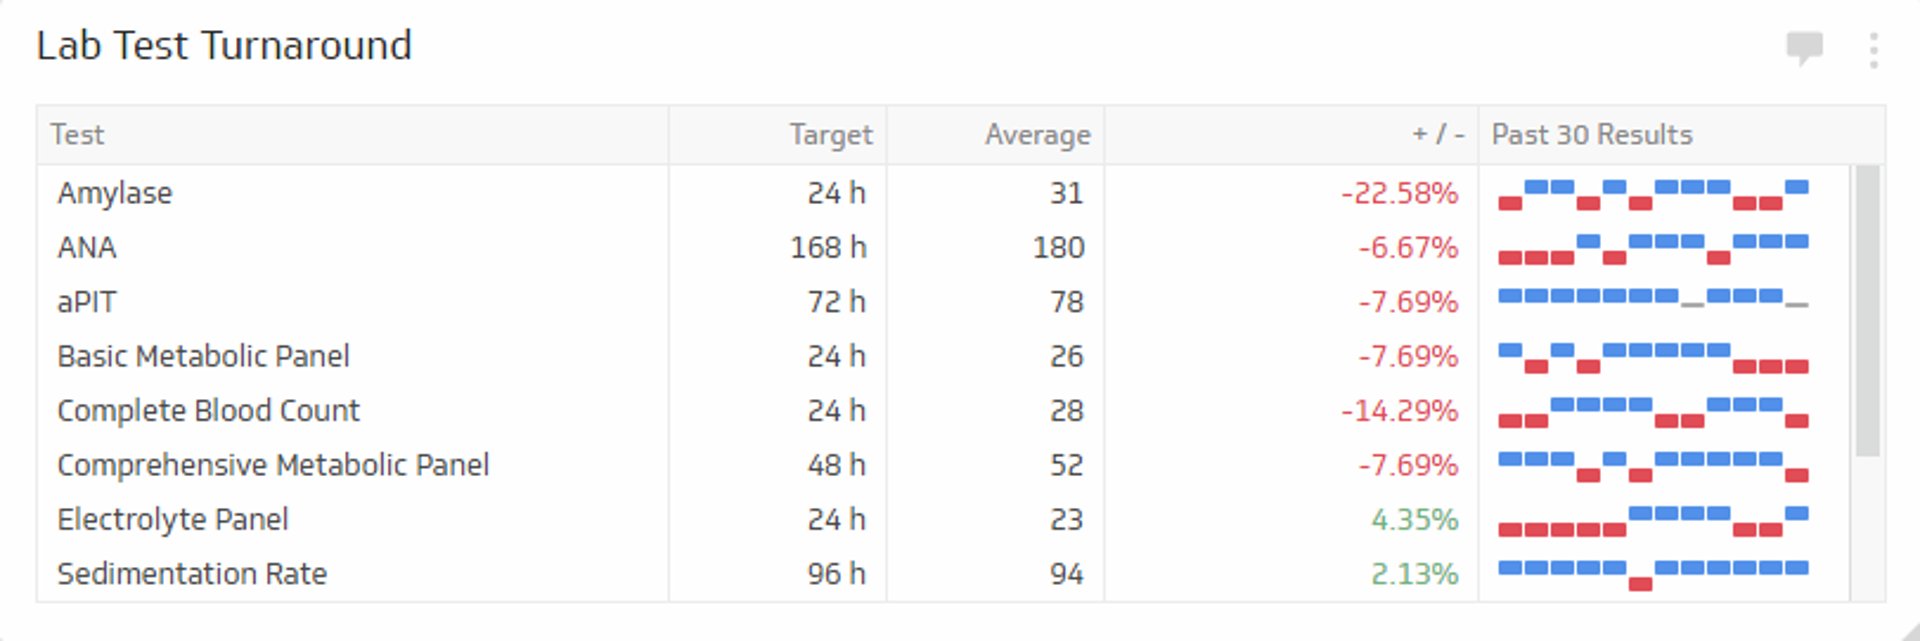
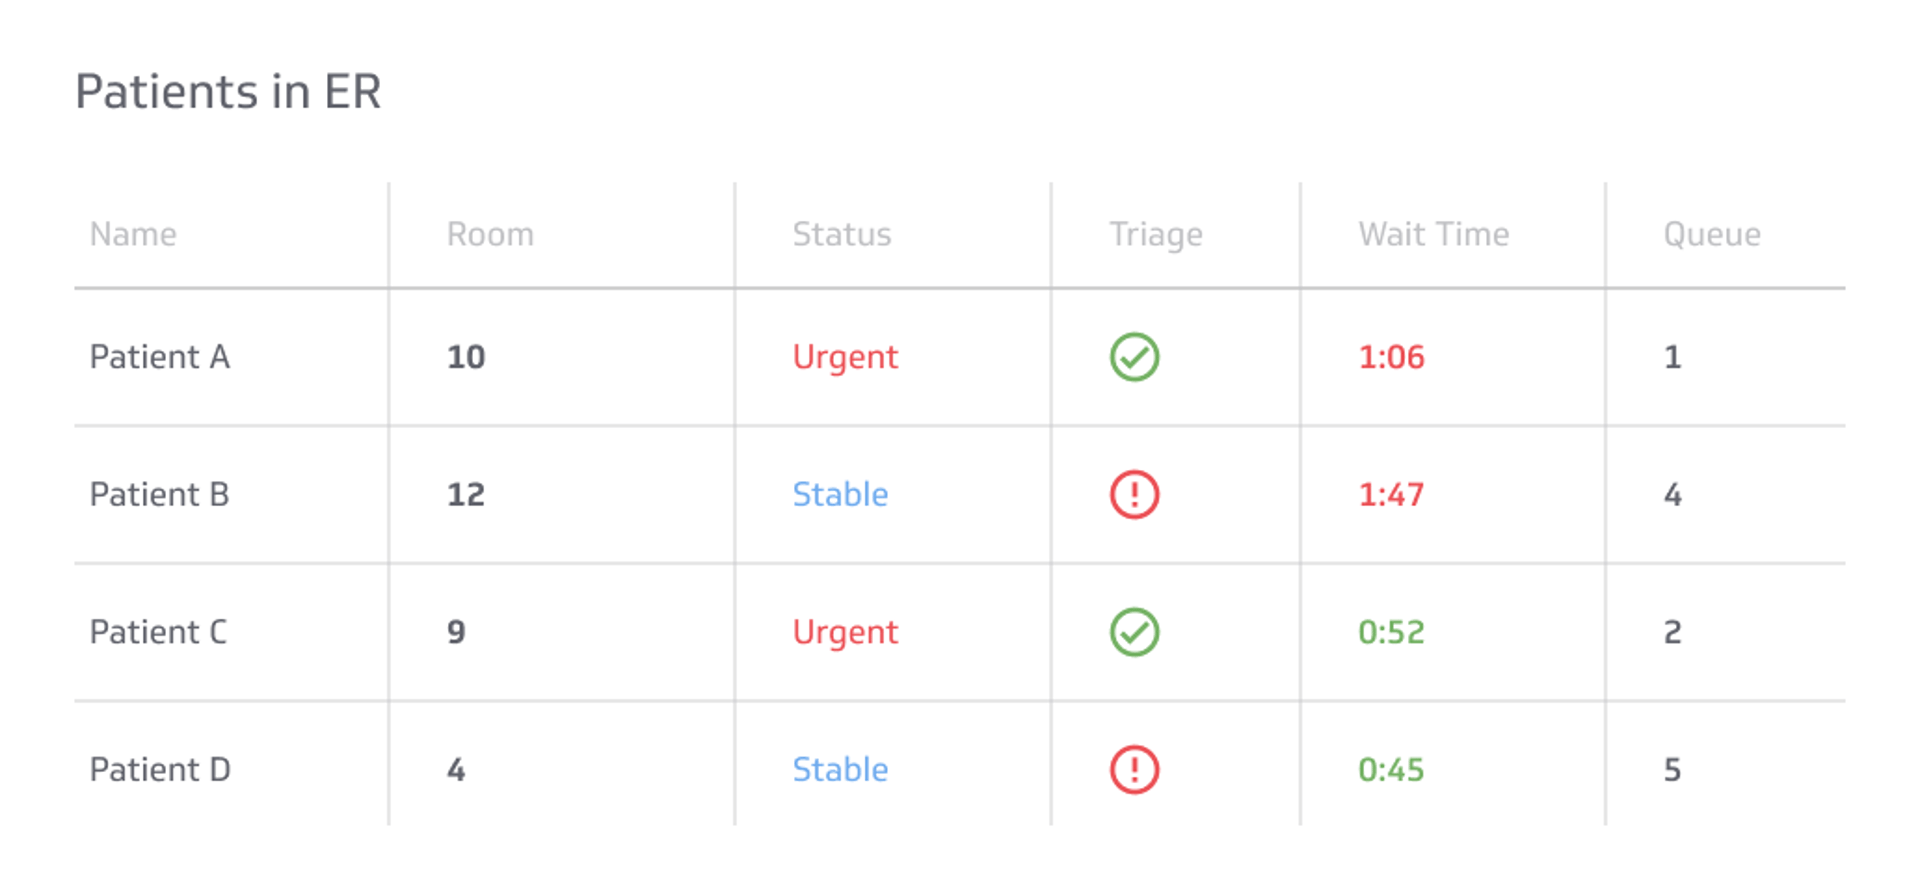
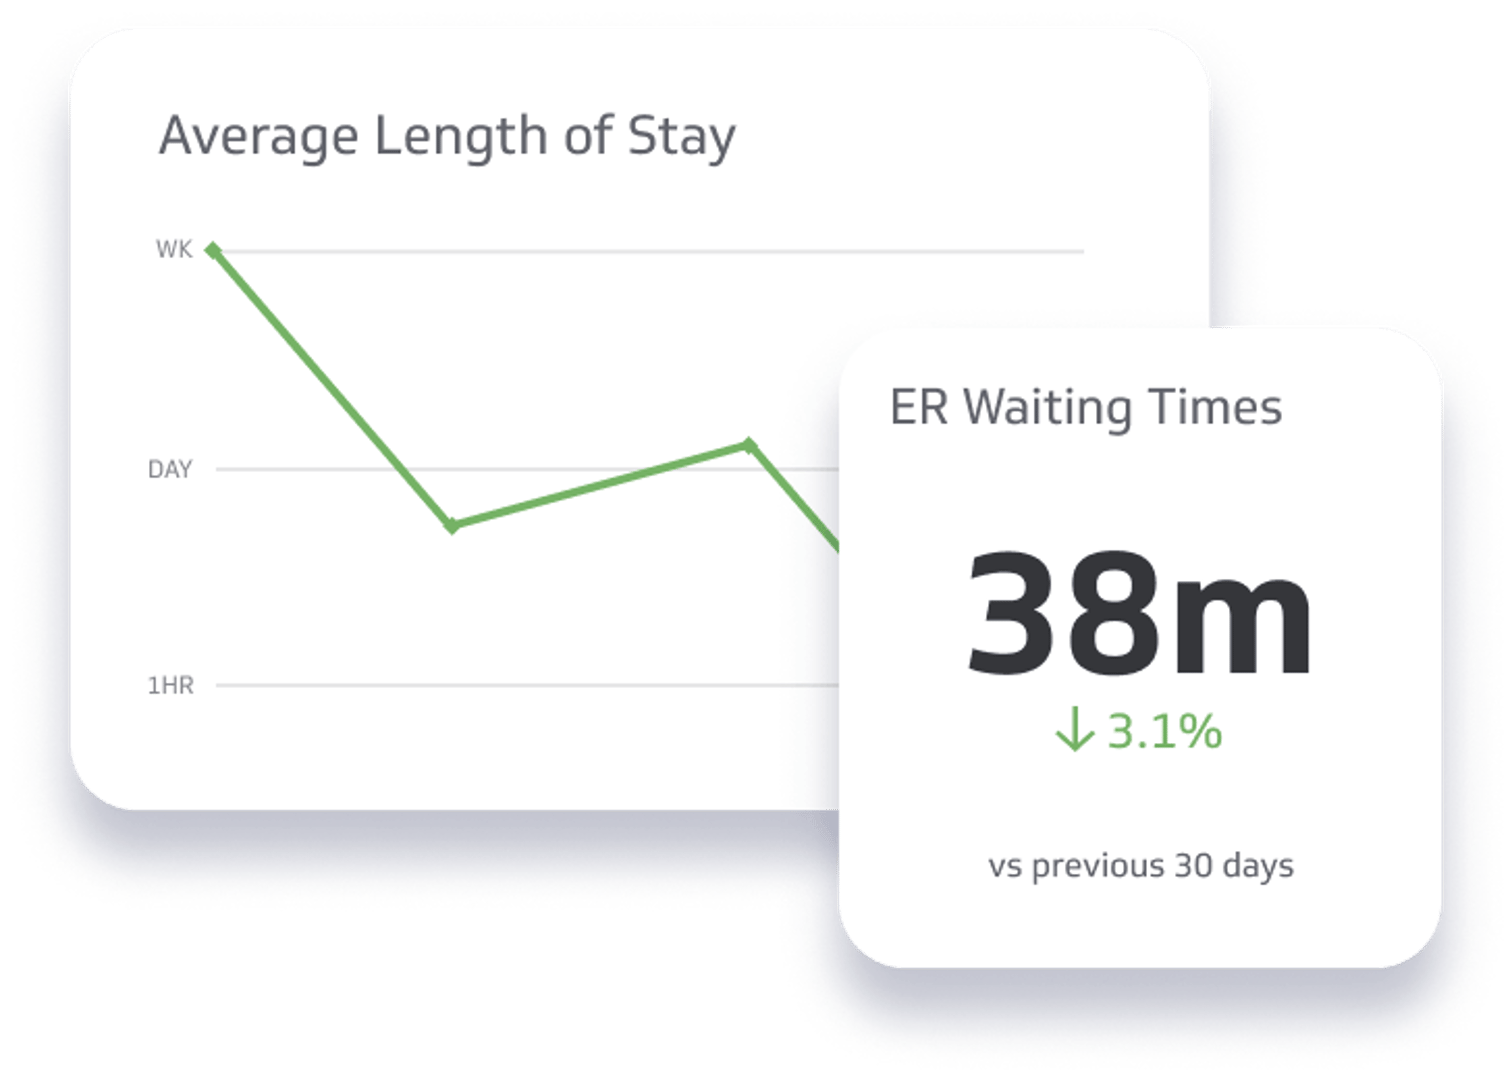
Healthcare providers are tasked with managing a huge variety of moving parts at the same time, such as patient care, facility management, and emergency room conditions.
To do this effectively, healthcare organizations rely on having access to the latest performance data so they can make the right decision at the right time. Use these healthcare KPIs and metrics to give your team the data they need to make those tough calls with confidence.
Understanding and effectively tracking healthcare metrics and KPIs is a fundamental aspect of managing a successful healthcare organization. By staying informed and responsive to these performance indicators, you can make insightful decisions that contribute to improved patient care and operational efficiency.
To strengthen your knowledge and skills in this area, we recommend visiting our dedicated resource on KPI Examples & Templates. Here, you'll find a diverse collection of examples and customizable templates designed to help you accurately measure, analyze, and optimize your organization's performance across various healthcare-related aspects.