

Summary - Dashboarding and visualization tools like Klips allow distributed teams and organizations to stay aligned and make data-driven decisions using a shared, centralized report. But what about those situations in which many different stakeholders need access to their own, individualized subsets of the same data?
We work with a well-known publisher of consumer content which manages a network of 200 affiliated content providers. These affiliated contributors submit articles and videos for publication on our client’s mobile apps and website. As to be expected, these content providers were asking our client a simple question: How is our content doing?
While answering this question on a case by case basis would be straightforward, providing feedback to 200 affiliated content providers would not, and our client wanted to provide real-time feedback, so content could be improved in real time.
They asked us for help.
With access to a large data set containing all the information the content affiliates were requesting, our task was to build real-time dashboards that could be used to surface localized KPIs to specific content providers. Learn how to define your organization's KPIs.
We started by working with the client to clearly establish the business goals of the project and define the KPIs that we needed to visualize in the dashboards. Experience has shown that the temptation to take shortcuts during this phase leads to dashboards which don’t deliver business value and actually end up creating extra hours of work. We agreed on the metrics we were after, including pageviews by user device, user demographics, and top content categories.
Next, we set out to simplify the data set to make it easier to work within Klips. We implemented Google Tag Manager to simplify the administration of the Google Analytics data and added some custom GA reports to capture specific events, content groupings, and custom dimensions.
Then, we turned to designing the dashboard. We began mocking up dashboard layout concepts, defining Klip chart types, and the widgets that would best communicate the metrics the content providers were looking for. This made the next step, constructing the dashboards, relatively painless.
Here is the simple and efficient method our developers used to quickly set up the Klips backend for user-login filtering for our client’s 200 users. All you need is a Google Sheet as a Data Source for your Klips dashboard. Within the Google Sheet, create a tab that looks like this:
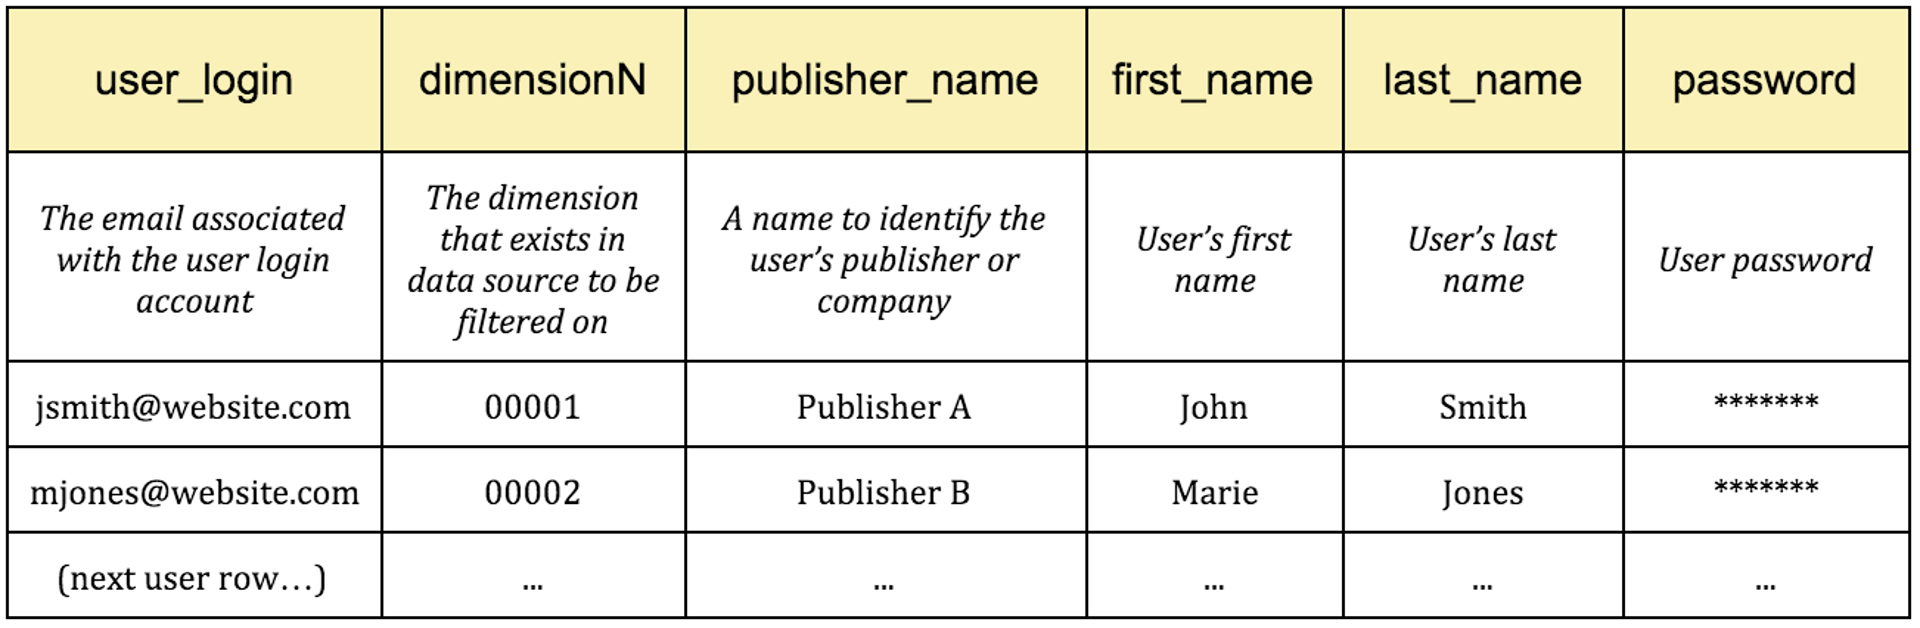
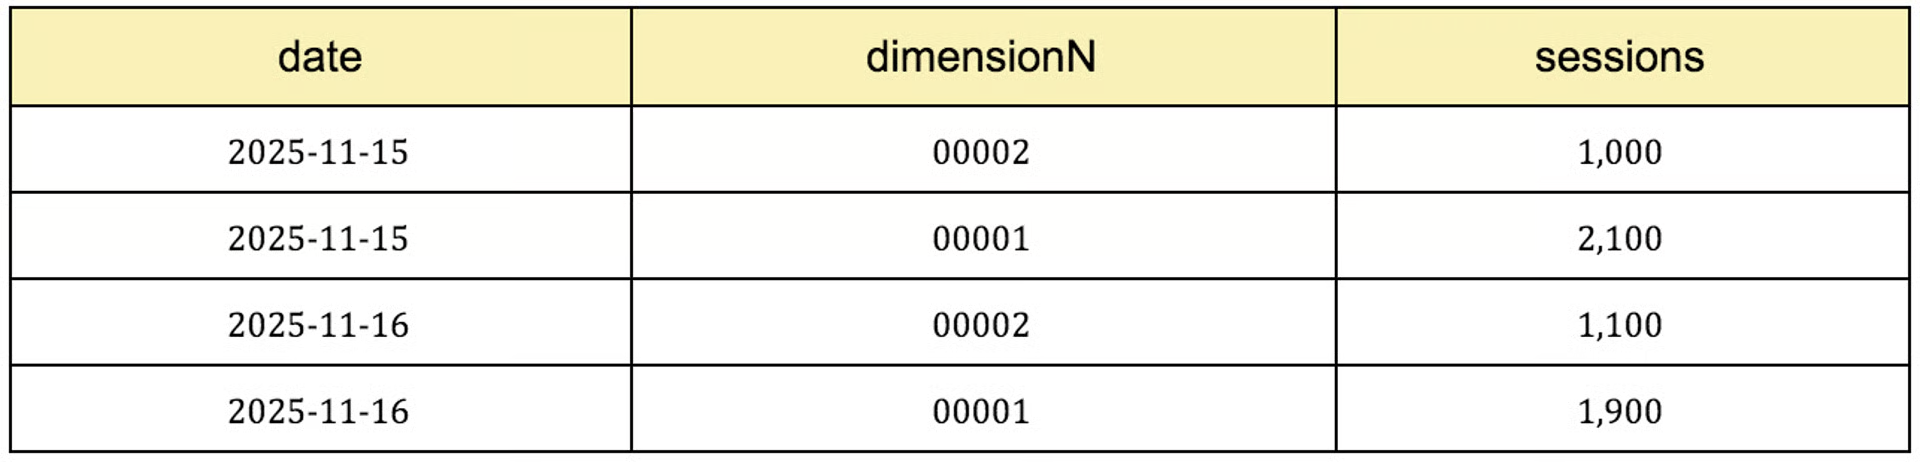
Using this sheet, Klipfolio Klips can filter the data based on the “dimensionN” field. So, when John Smith (00001) logs in, the Klips he sees will only contain data where dimensionN = 00001. For example, if Klips sees the following data within a Data Source for total sessions from Nov 15 to Nov 16, John Smith will see his total as 4,000. The next user, Marie Jones (00002), would see a total of 2,100, and so on down your list, in our case, another 198 rows.
Klipfolio documentation on user-level filtering can be found here.
Once finished building the individual KPIs, we set up some test logins for quality assurance using Google Analytics Query Explorer to compare and contrast the data being surfaced on the Klipfolio dashboards. For non-GA data sources, we recommend using your favourite SQL workbench to directly query dependencies to see the raw data and make any tweaks necessary before adding the final query to the related Klips data source.
Once we completed our tests and were confident in the data our users would be seeing, we went ahead and added the 200 users to the Google Sheet table. We then provided users with seats in the Klips admin screen (see pricing details for Klipfolio Klips here).
And that's how we personalized a dashboard for 200 users with Klipfolio Klips.
At Empirical Path, our web analytics, A/B testing and tag management consultants focus only on measuring your marketing and online presence. Our Reporting & Advisory Practice tells the story behind your numbers by creating custom reports and translating data into business insights. We synthesize web analytics, advertising, marketing automation, social and CRM data into dashboards using automatically updated spreadsheets, Klipfolio and other tools, then draw findings and recommendations from the visualizations each month or quarter. Our Web Analytics Implementation Practice fixes and enhances web analytics implementations, making your metrics more trusted, complete and actionable. If you have questions or are interested in getting expert help with your implementation, we would be happy to talk with you. Contact us at www.searchdiscovery.com.
Related Articles

Klipfolio Partner How-To #1: Duplicating dashboards across client accounts
By Stef Reid — November 27th, 2025
Client management in 5 steps
By Jonathan Taylor — November 26th, 2025
Klipfolio Partner How-To #2: Company Properties can simplify client set-up
By Stef Reid — November 26th, 2025