

Summary - With Klipfolio, Growth Institute has more visibility into all departments and are able to make better decisions on-the-fly backed by accurate, real-time data.
“It takes a village of gurus to help companies scale up. We are building that village here.”
Somewhere in between the startups and the unicorns, are the growing mid-market companies - the unsung heroes of the market. These companies provide jobs and boost the economy. And yet, the resources available to their leadership teams are scattered and narrowly available. Growth Institute is working to change that.
By combining the benefits of learning, implementation, and guidance into a robust learning experience, Growth Institute gives leaders the surest pathway to scale themselves and their company.
“Our goal is to help scale impact and reduce drama for 10 million leaders by 2040.”
Meet the crew...
Rowan Stanek is the Product Owner for ‘Scaling Up Club’, Growth Institute's subscription product. CPA Patricio Alcerreca Burgos (or, Pato for short) is the Financial Controller, and Karina Reyes is the Product Manager at Growth Institute.
All three of them are involved in working on data analysis within the company and bring their own unique skills and viewpoints to the process.
On any given day, Rowan can be found gathering feedback from users, grooming their product backlog, and helping manage the development team. As a CPA, Pato is the “numbers person” who’s responsible for all things financial, administrative and HR related. His biggest task is managing the company’s risks at every level of each department. Karina oversees the development and production of all products at Growth Institute. Her team of six tackles everything from planning, envisioning, and outlining projects to executing and building them.
Basic spreadsheet reporting would take days to complete
“Before Klipfolio, if I wanted to know a specific metric in any department including mine, I had to ask multiple people, eventually involve the IT team to run a report, and then clean and format the data myself so I could better understand it. It could take up to 3 days to obtain fairly basic information.” - Rowan
When it came to financial reporting, Pato worked manually with Excel spreadsheets. The process was very slow and tedious.
“With our old reporting process, I used spreadsheets as best I could to keep track of what needed to get done, by when, and by who. Visualizations go a long way in motivating people in the work they do.” - Karina
Growth Institute needed a better data visualization tool which is why they decided to try Klipfolio.
Automated spreadsheet reporting without the headaches
Now, Pato has connected Klipfolio to his spreadsheets and is pulling data from different systems, organizing it in a Google Sheet, and pushing it to his dashboards that are updated each day.
“We have our top KPIs displayed on Klipfolio dashboards that are accessible at any time by the whole company.” - Pato
Karina also loves how intuitive Klipfolio is and how easy it is to show her team's progress to other departments and company stakeholders.
Growth and product metrics worth measuring
Rowan, Pato, and Karina all understand the importance of staying on top of their metrics. Here are some financial growth metrics and product KPIs that they track:
Popular financial and growth metrics
- New revenue (daily, monthly, quarterly, and annually)
- Average revenue per day
- Revenue vs. projections
- Revenue by category
- Revenue vs. profit/losses
- New members
- Monthly retention/churn
“My team recently started incorporating the SCRUM methodology. It’s easy to show in Klipfolio what our projected story points will be vs. what we are actually producing.”
Popular product metrics:
- # of projects completed
- Status of project requests
- Status of new small project requests
Data visualizations that move the needle
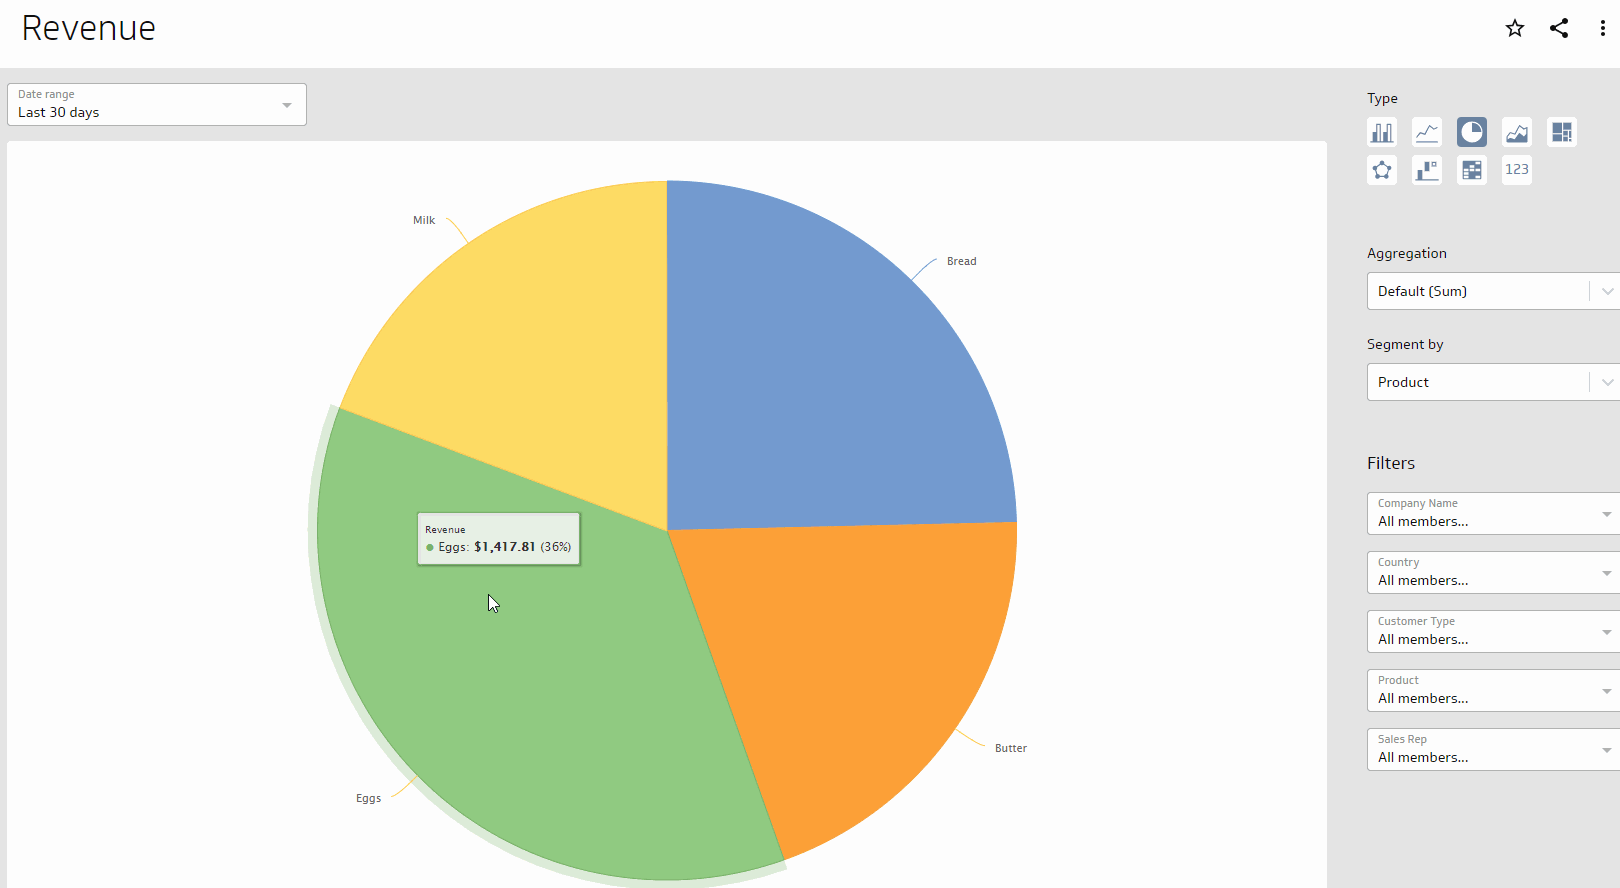
“Our sales dashboard is my favorite report. With Klipfolio, changes we make to the product, or how we market/sell it, can be immediately tracked so we can iterate quickly. Also, who doesn’t love to see the $$$ graph trending up and to the right?!”- Rowan
Pato loves how dashboards have improved cross-departmental transparency at Growth Institute. Having eyes on every department’s key metrics allows them to better make decisions with others in mind.
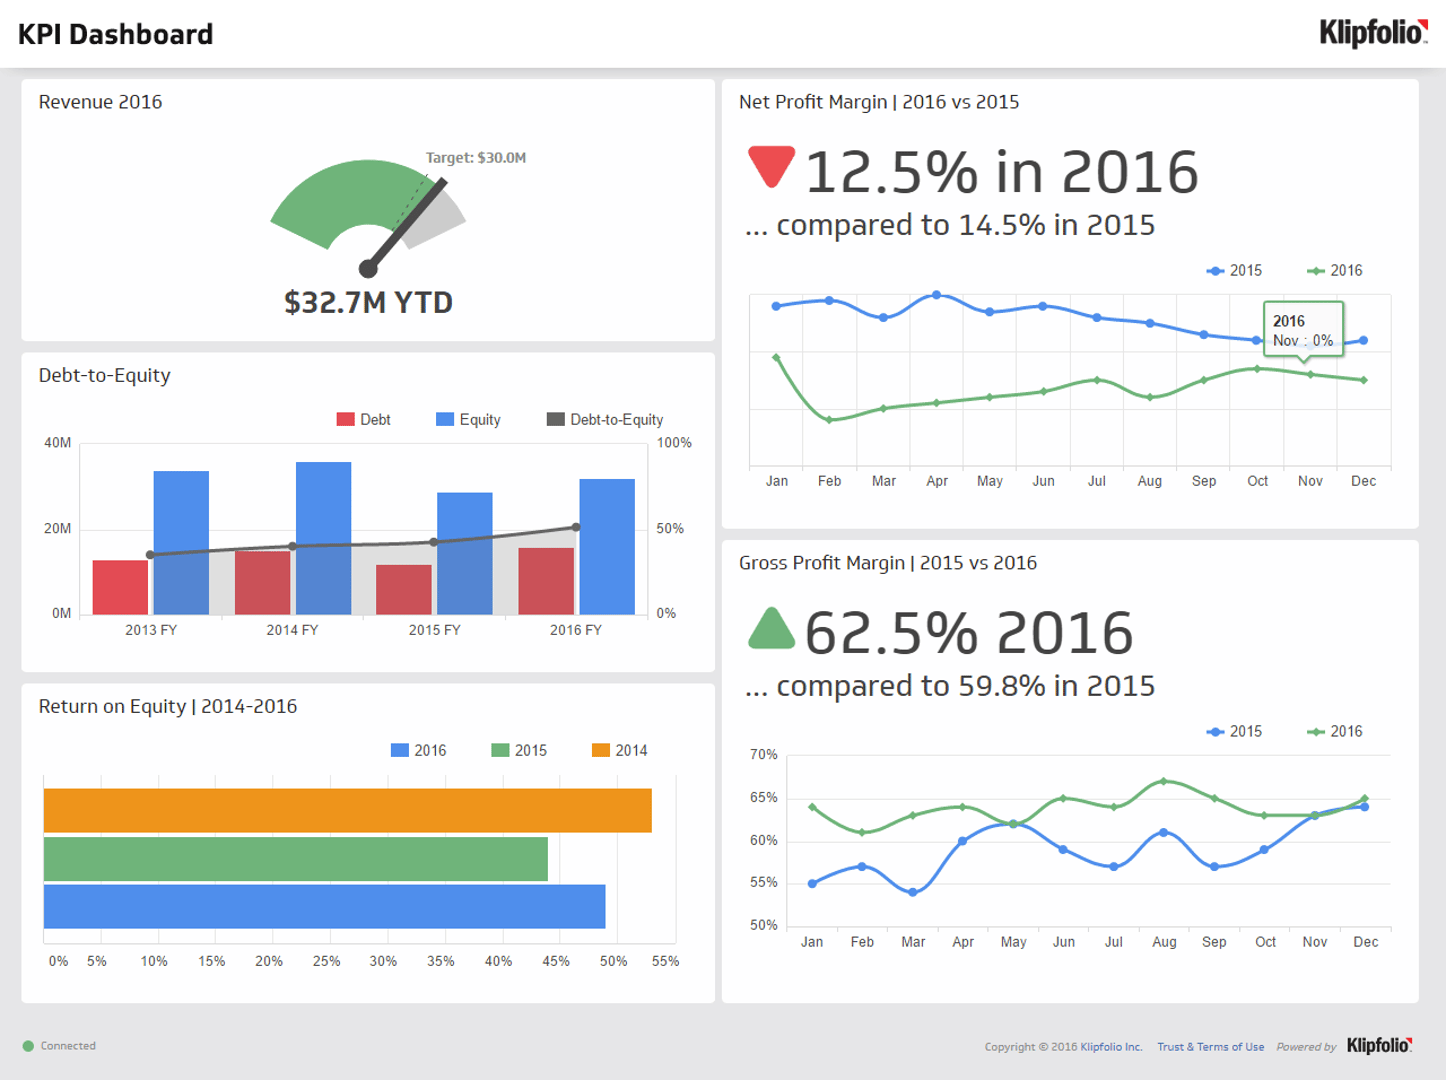
“I love our finance dashboard! It’s really cool as a team member who doesn’t work in finance to see all the various, clear breakdowns of where we are with our financial goals as a company.” - Karina
Becoming a data-driven company and winning back hours a week
With Klipfolio, Growth Institute has more visibility into all departments and is able to make better decisions on-the-fly backed by accurate, real-time data.
Once Growth Institute implemented Kipfolio across the company, Rowan immediately began saving hours a week that would have been spent chasing people in other departments for information. He’s now able to make confident and sound decisions faster because he can find a lot of the information he needs and can instantly interpret it.
“Klipfolio makes data easy to access, clearly represents trends, empowers accountability, and encourages the entire companies like Growth Institute to be more mindful of making data-driven decisions.”
Dashboards have also helped Karina and her team cut down on meeting hours.
“Klipfolio has made our morning meetings so much more efficient. Instead of spouting off a list of things to work on, we have clear graphs and dashboards we can reference to strengthen our reasons to prioritize certain actions.”
Several departments at Growth Institute present their key metrics every morning during their daily stand up by referring to their Klipfolio dashboards. They also make their dashboards a big part of quarterly and annual strategic planning meetings to test the viability of new initiatives and benchmark against past performance.
“Displaying your data clearly and visually in Klipfolio helps everyone make faster, more impactful decisions and get quick feedback on new initiatives.” - Rowan
A tight-knit, agile culture of people who love to celebrate big #wins
Pato loves how everything at Growth Institute is virtual. Employees can work remotely from almost anywhere that has an internet connection.
“...this is why dashboards are so important for us. They are a very practical way to share critical information with everybody at the same time without having to physically attend a meeting.”
Rowan describes growth institute as a small, agile company that is very tight-knit.
“We value transparency, people taking ownership of their work, and not being afraid to try new things in the quest to provide greater value to our clients and improve profitability for our company.”

Karina loves how employees are very independent of each other, yet collaborate often.
“As a virtual team, Klipfolio dashboards go a long way towards maintaining accountability and staying transparent with each other.”
The company loves to share big wins in their #wins channel in Slack and celebrate with a happy hour at the end of the week. They even get together occasionally for off-site activities to further their bonding.
Some parting advice for others on the fence about making their company more data-driven:
“Don’t delay! The quicker you get in the rhythm of updating and displaying your metrics consistently, the sooner the rest of your team will follow suit and the whole company benefits.”
Related Articles

5 tips to understand (and organize) your restaurant data
By Saleem Khatri — June 9th, 2026
PayTabs embraces a data-driven strategy with KPI dashboards
By Mitch Dupuis — June 25th, 2025
What is data literacy and why does it matter?
By Emily Hayward — May 21st, 2025
