

Summary - An OKR client shared how an OKR dashboard improved personal and organizational performance, and even raised her profile company-wide. Here is how the dashboard design, prioritization, and measurement helped.
An OKR (Objectives and Key Results) client recently shared standout results from implementing OKRs. Sarah said the process helped her perform better, helped the organization perform better, and, most importantly, made her known across the organization.
That kind of feedback is rare. Sarah’s approach applies to any career and organization.
Sarah’s OKR Dashboard
Fitting into the big picture
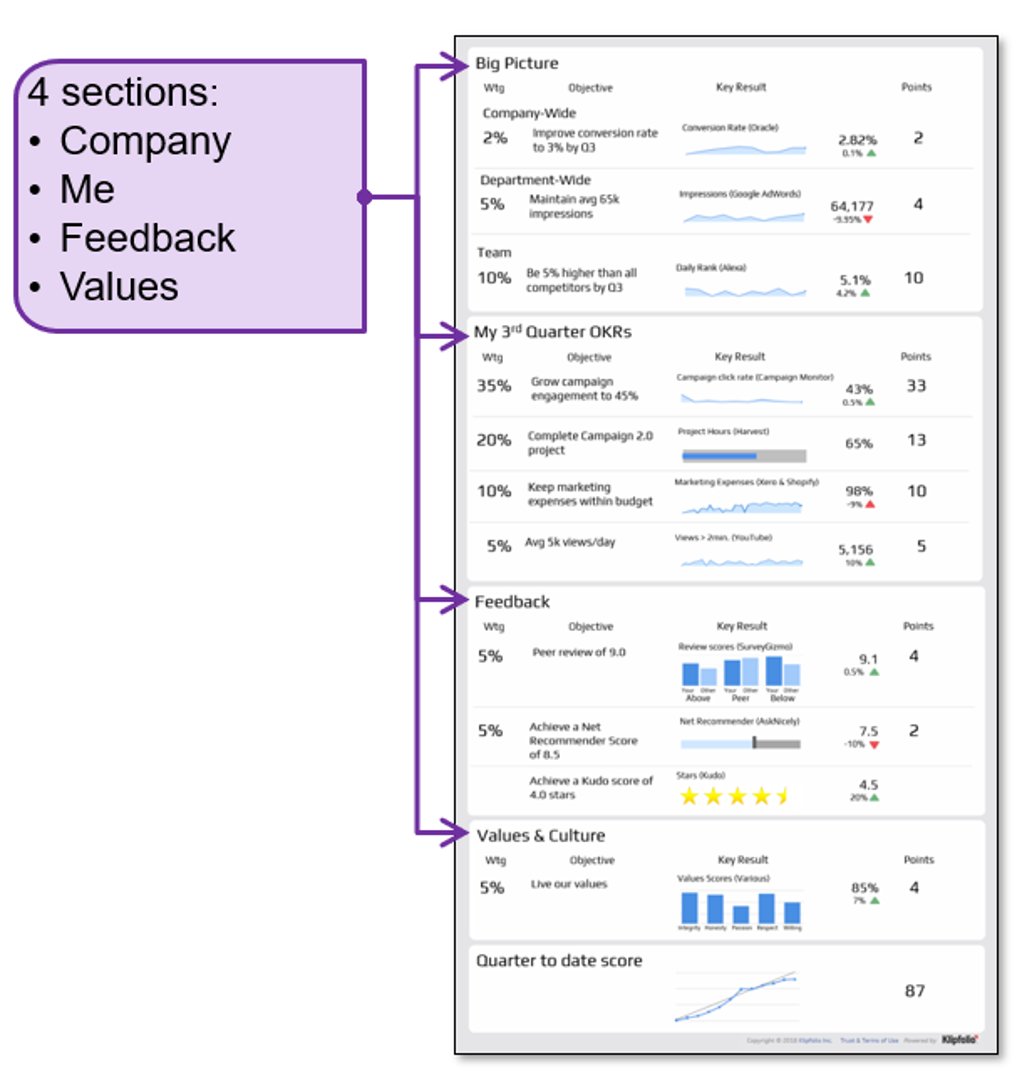
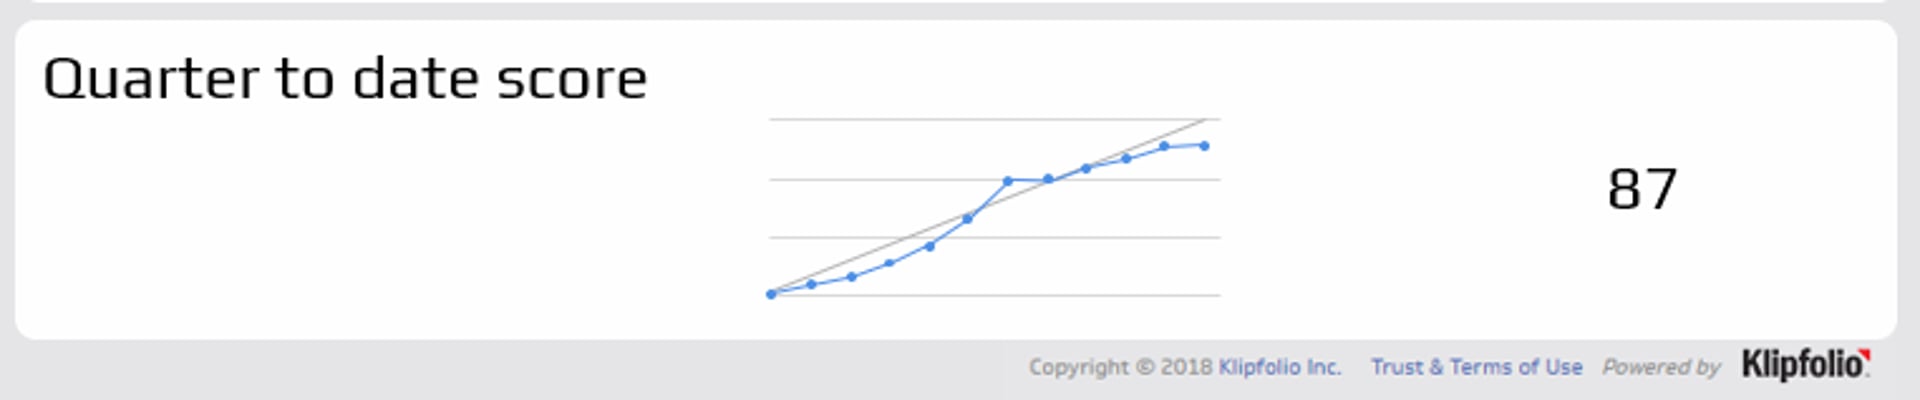
Sarah’s OKR dashboard was divided into four sections with total performance displayed at the bottom.
Each section showed the OKRs she was associated with and made her contributions to the overall organization clear, which had puzzled her since graduation. One of the benefits of this approach is that the senior team could see what Sarah was doing toward their success.
The Feedback and Values sections gave her personal performance information beyond the specific work she does. Sarah said this became a tool to improve how she was seen by colleagues and how she worked alongside them.
Getting priorities right
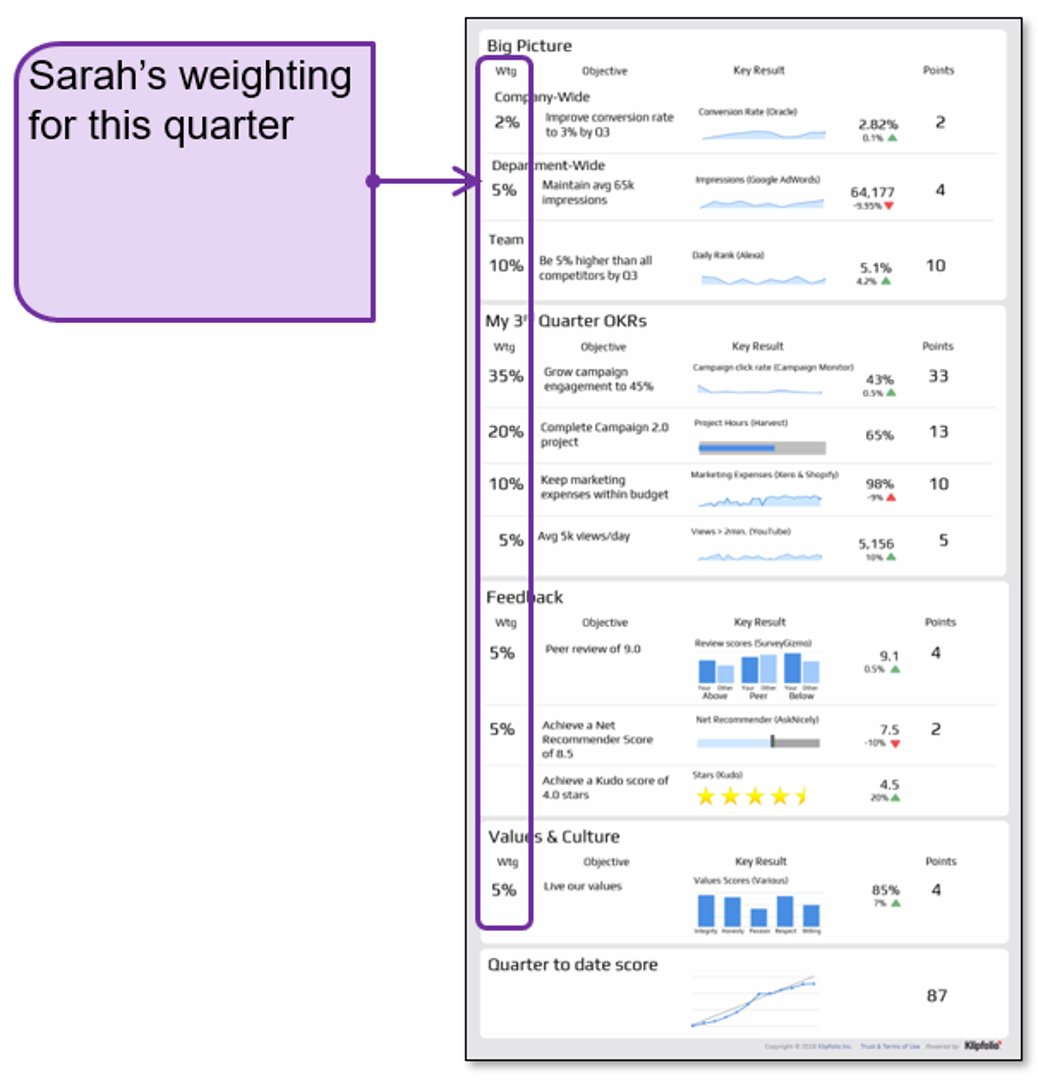
Each quarter Sarah and her managers agreed on the relative importance of the work on her plate.
The My OKR section’s weighting scheme helped Matrix-managers and Team-leads set her priorities across objectives. This let her allocate time across many cross-functional responsibilities.
Sarah shared how the weighting helped her manager approve a couple of training courses that had been postponed once he saw how the training supported her Objectives.
Gamifying the job
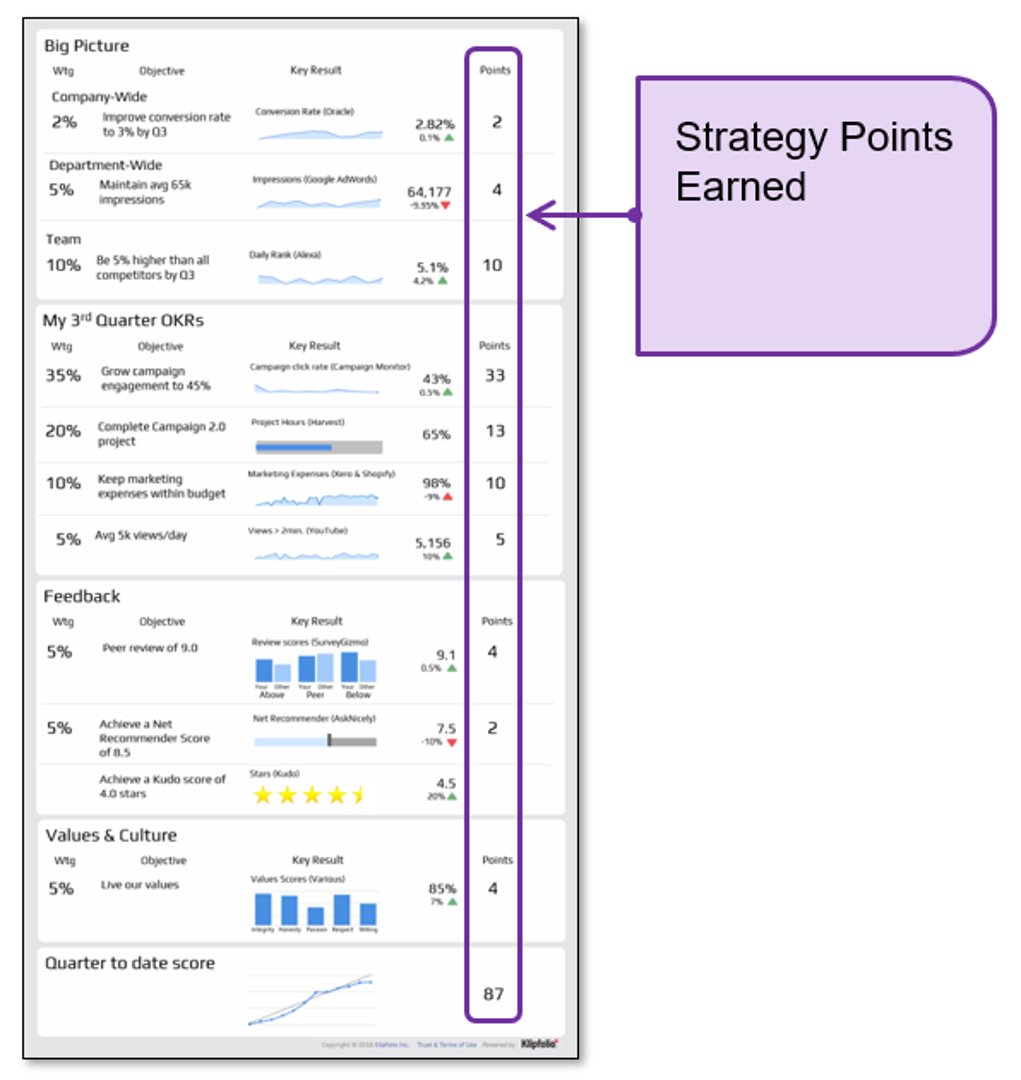
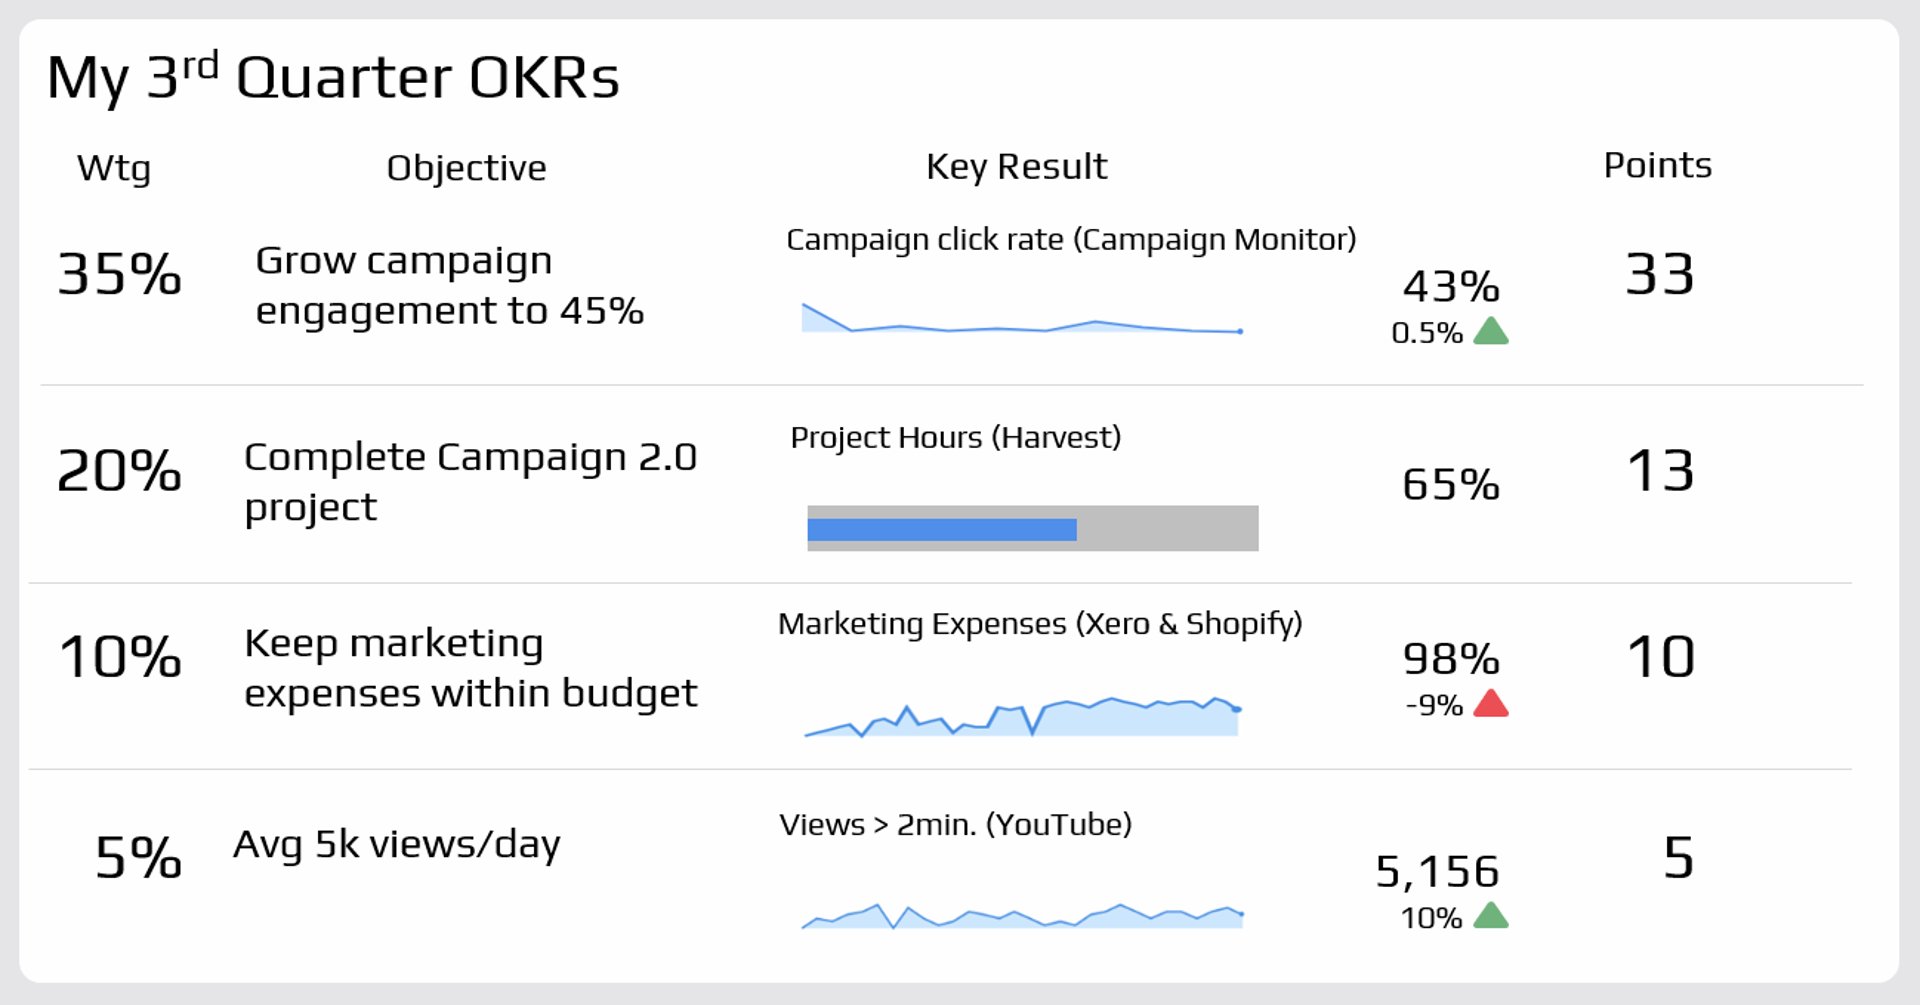
Sarah’s OKR dashboard also showed how many strategy points she earned for each Objective.
This turned into the biggest motivator for her. With a daily, weekly, and monthly performance score, she reviewed actions that would beat her previous high score.
Sarah said this was a big contributor to her new-found fame. She outperformed teammates month after month and was recognized at all-hands meetings. Once she started earning “Top Performer” badges for highest points, people began saying “Hi” in the hallways and she started getting first pick of special projects.
Measuring what matters
Sarah made sure to take the S.M.A.R.T. approach into consideration when setting her OKRs. This made it easier to see progress against targets and priorities and kept her focused, which increased productivity.
She laughed that she attended about 35% fewer meetings. About 20% of the meetings she was invited to had nothing to do with her Objectives, so she sent an email explaining that she would not attend. About 15% were outside her RACI responsibilities. She was the “R” or “I,” and only needed to be informed of decisions made by the “A” and “C” players.
Her daily dashboard also helped her learn what to do to maximize her score and react to problems as they happened, instead of weeks later when month-end reports were published.
Becoming a team player
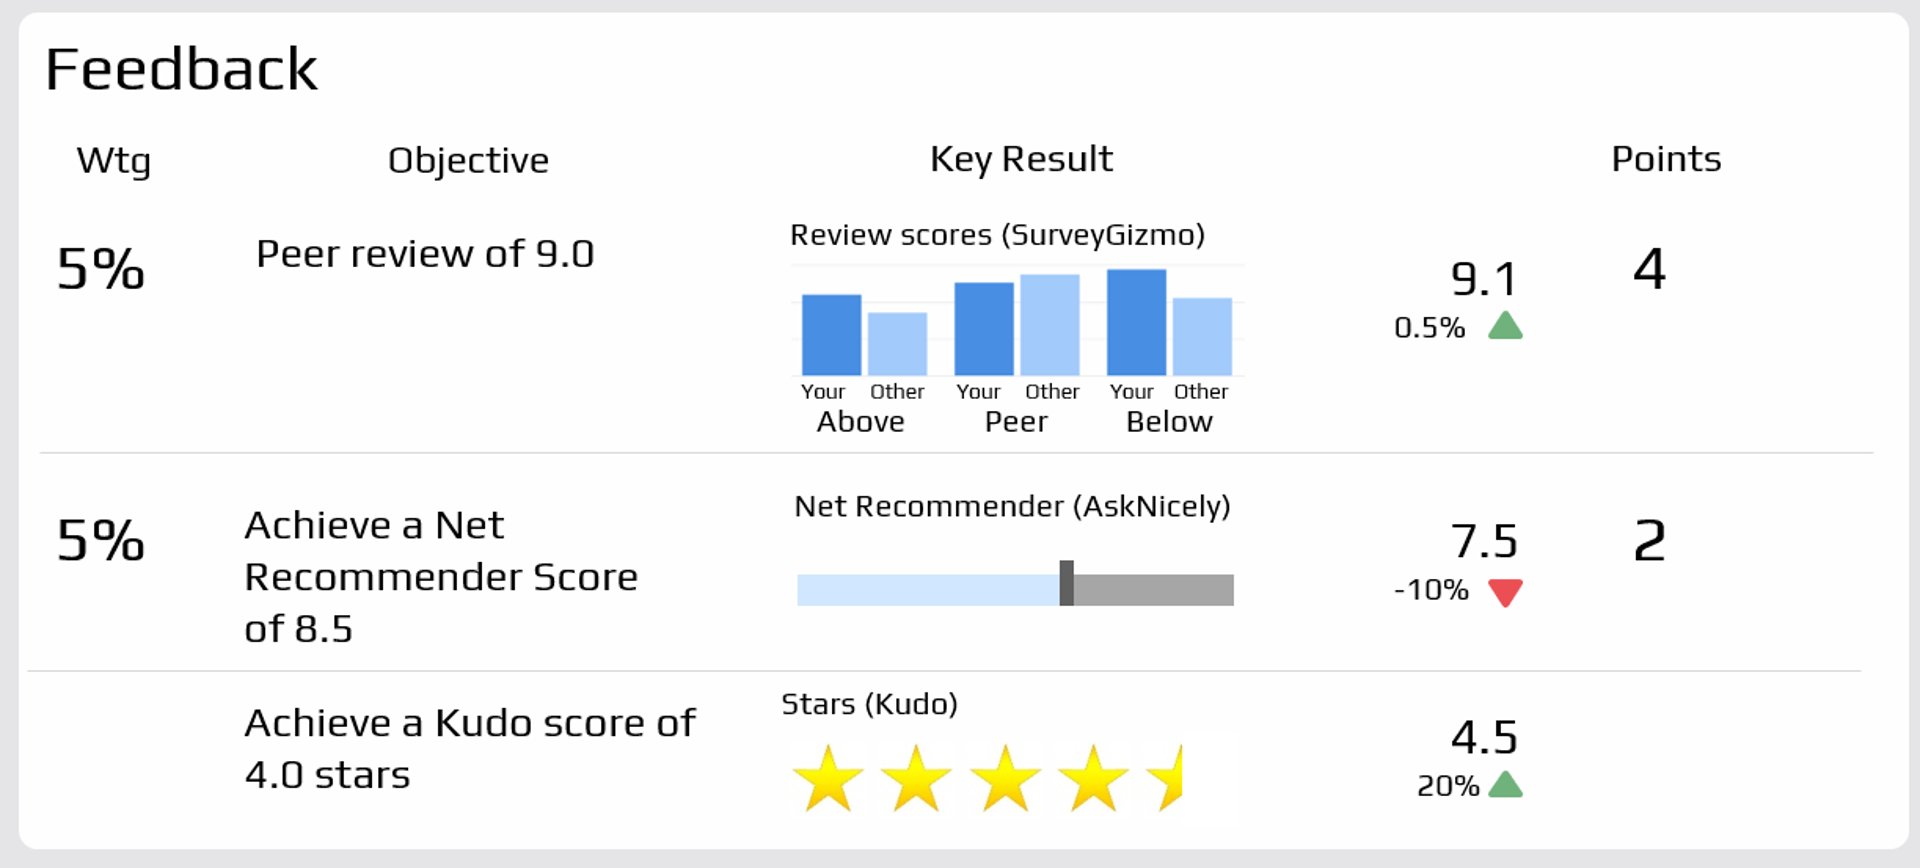
In the Feedback section, where co-workers, suppliers, and customers provide input, she began to see how others perceived her. For example, her direct boss had a better impression of her than her Matrix-bosses. That was easy to address once the team aligned Objective weightings.
She also found her NRS (Net Recommender Score, “Would you recommend Sarah for the next project?”) was increasing quickly. The more successful she became, and the more others saw it, the more she was recommended for the next special project.
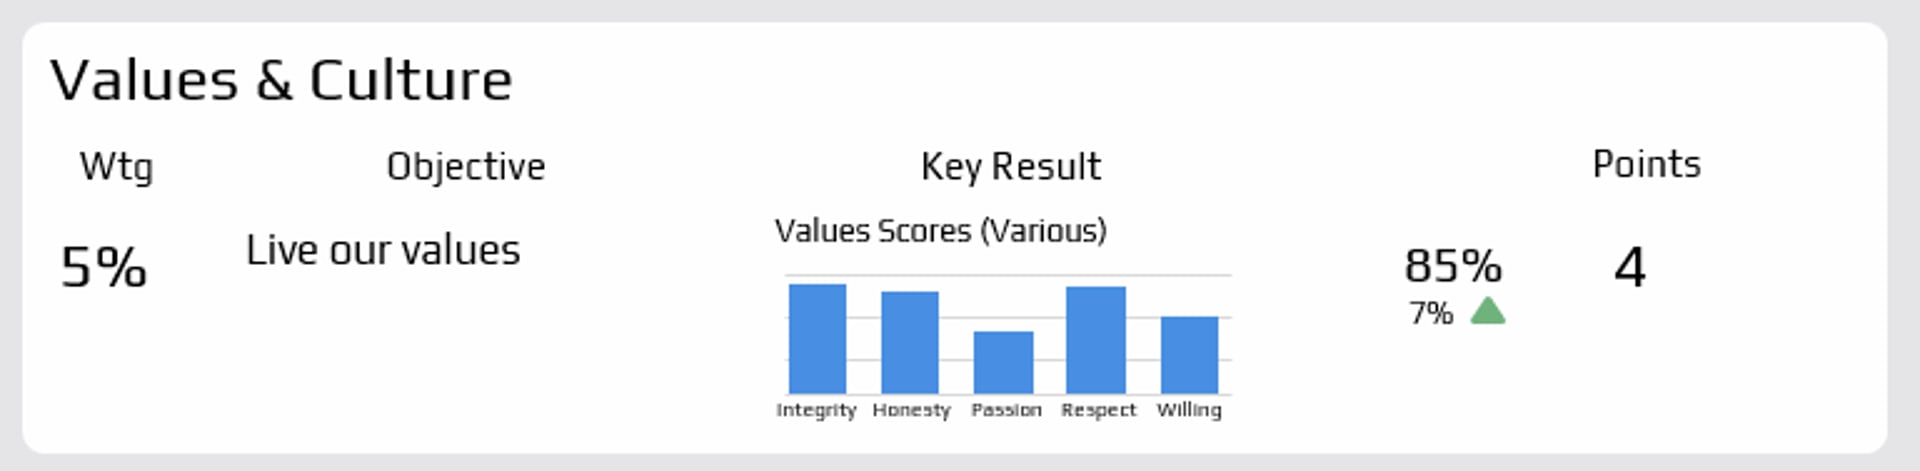
Her company had communicated its five values for years, but she never knew what to do about them. On her OKR dashboard she had those five values, plus hard measures for each. For “Integrity,” it was defined as “Say what we will do. Do what we said.” Her measures targeted how many times she changed promised delivery dates and how often she committed to one date but delivered late.
She now understood how the values affected her and her internal and external customers. Her Values score moved up, on average, 10% per quarter. This helped her score, and it made customers much happier.
Fame came one day at a time

Each day she did slightly better than the day before. She saw it. Teammates saw it. Managers saw it. Soon the whole organization saw it.
About Pm2
Brett is an Executive Partner at Pm2 (Performance Measurement & Management), an international consulting firm specializing in the development and implementation of strategic dashboards and scorecards. Frameworks include OKRs (Objective and Key Results), Balanced Scorecard, 4DX (Four Disciplines of Execution), Lean, and Six Sigma. Their work has been profiled in Harvard Business Review, Fortune, and Forbes, as well as business books and periodicals. This thought leader contributes actively to the Klipfolio blog.
This article was originally published on October 22, 2018 and lightly refreshed on March 13, 2026.
Related Articles
6 Facebook ads reports every agency needs to attract and retain high-ticket clients
By Tanya Brody — April 10th, 2026
Klipfolio Partner How-To #1: Duplicating dashboards across client accounts
By Stef Reid — November 27th, 2025
Client management in 5 steps
By Jonathan Taylor — November 26th, 2025