The Fundamental Klipfolio OKR Dashboard

Published 2023-02-01
Summary - OKRs (Objectives and Key Results) is a methodology used to encourage employee success through clear work objectives and desired key results. This approach is rapidly gaining acceptance in small digital start-ups and aggressively growing companies.
Executive Summary
OKRs (Objectives and Key Results) is a methodology used to encourage employee success through clear work objectives and desired key results. This approach is rapidly gaining acceptance in small digital start-ups and aggressively growing companies.
There are several characteristics of OKRs that make them perfect to be displayed on a Klipfolio dashboard:
- Near real-time data
- Pulling from a mix of data sources
- Simple to build and easy to understand visualizations
The key to success is to put the right things on your OKR dashboard.
Our Credentials
I believe that if you understand the work we have done around OKRs, you will be better able to appreciate our recommendations.
I have been involved in this space since the late 80’s when I aided in some of Drs’ Kaplan and Norton’s work on The Balanced Scorecard. Since then we have help create over 3,000 scorecards for all sizes of organizations around the world. Our clients have been profiled in all of Drs’ Kaplan & Norton’s books as well as countless other articles and periodicals over the years.
We were also lucky enough to be involved early in the OKR journey – and in fact my OKR Primer video is one of the most viewed on the OKR topic! We also have some of the largest (and smallest) OKR implementations under our belt.
Our goal is to “make strategy everyone’s everyday job”.
The Caveat
First – there are NO rules related to OKRs. It is the one of, if not the first “crowd sourced” business concept. Given that, what follows are the “best practices” we have established over the last 35 years of working with several hundred thousand employees across several thousand organizations. (Keep in mind that my opinions, and a bus ticket, will get you home!)
What is an OKR vs a KPI?
OKR, or Objectives and Key Results, is a collaborative goal-setting framework. OKRs communicate the goals you want to accomplish and the intended outcomes. A KPI is a measurable value that illustrates how effectively a company is achieving their business objectives. OKRs is a measurable framework to help improve performance, whereas KPIs are a business metric that measure your performance.
The Principle of OKRs
OKRs should be the logical cascade of corporate-level strategic objectives down to the team or individual level. I’d say about half our clients want their OKR solution to trickle down to the team level, the other half want to take them all the way down to the individual. For the purposes of this article, I will make all my comments with reference to the individual level, but everything can also be interpreted at the team level.
The idea is to make it clear to the individual exactly what is expected of them for a specified period. A great OKR should always be stated in the following format: [verb] [noun] [target] [time period]. For example “Increase monthly recurring revenue to $1,000,000 by second quarter”.
There are many articles written about OKRs…I will leave you to track down the right learning article for yourself.
What is OKR Reporting?
We feel that OKRs should be reported across four categories:
Big Picture - OKR's that are associated with the individual but are scored at the corporate, department, or team level. The individual has a significant contribution to these OKR's but they are shared with other members of the organization.
Individual’s OKRs - OKR's that are owned by that individual and links to specific performance targets within that period.
Feedback - Feedback that is generated from your coworkers and stakeholders. This typically includes things like 360s, one-on-one reviews, project completion surveys, customer satisfaction surveys, office polls, etc.
Values & Culture - The values you exhibit, and the resulting culture are important elements in both the employee experience and overall productivity.
Best practices suggest that an individual should have seven to ten OKR's at any given time. We feel that it is important that each of these are weighted so that the sum of an individual’s OKRs equals 100%. In other words, that the OKRs make up 100% of their responsibilities for the specified period.
The weighting is set as an agreement between the individual and their boss. The weighting should reflect the cascaded priorities from the overall corporate strategy. For example, if the corporation is focusing in on attracting new customers, as the strategy cascades down to the department, team and individual, that customer priority should flow all the way down. This would cause a higher weighting to new customer activities compared to expansion to existing customers at each level of the cascade.
We call this the fair deal. It is only fair that leadership makes it clear to the employee exactly what their priorities are. If the employee achieves those priorities and goals, in this case attracting new customers, and that effort does not result in the overall corporate financial success, the employee should still be rewarded since they achieved what was asked of them. On the other hand, their bosses would not achieve their rewards because they made the wrong call on priorities.
The fair deal extends down to communicating changes in strategy from quarter to quarter or even within the OKR. So, for example, attracting new customers may have a 20% weighting in Quarter 1, but in Quarter 2 it is reduced to 10% as the company shifts its strategic focus. Now the employee knows to shift their focus to track the new corporate priorities.
How do you visualize OKRs?

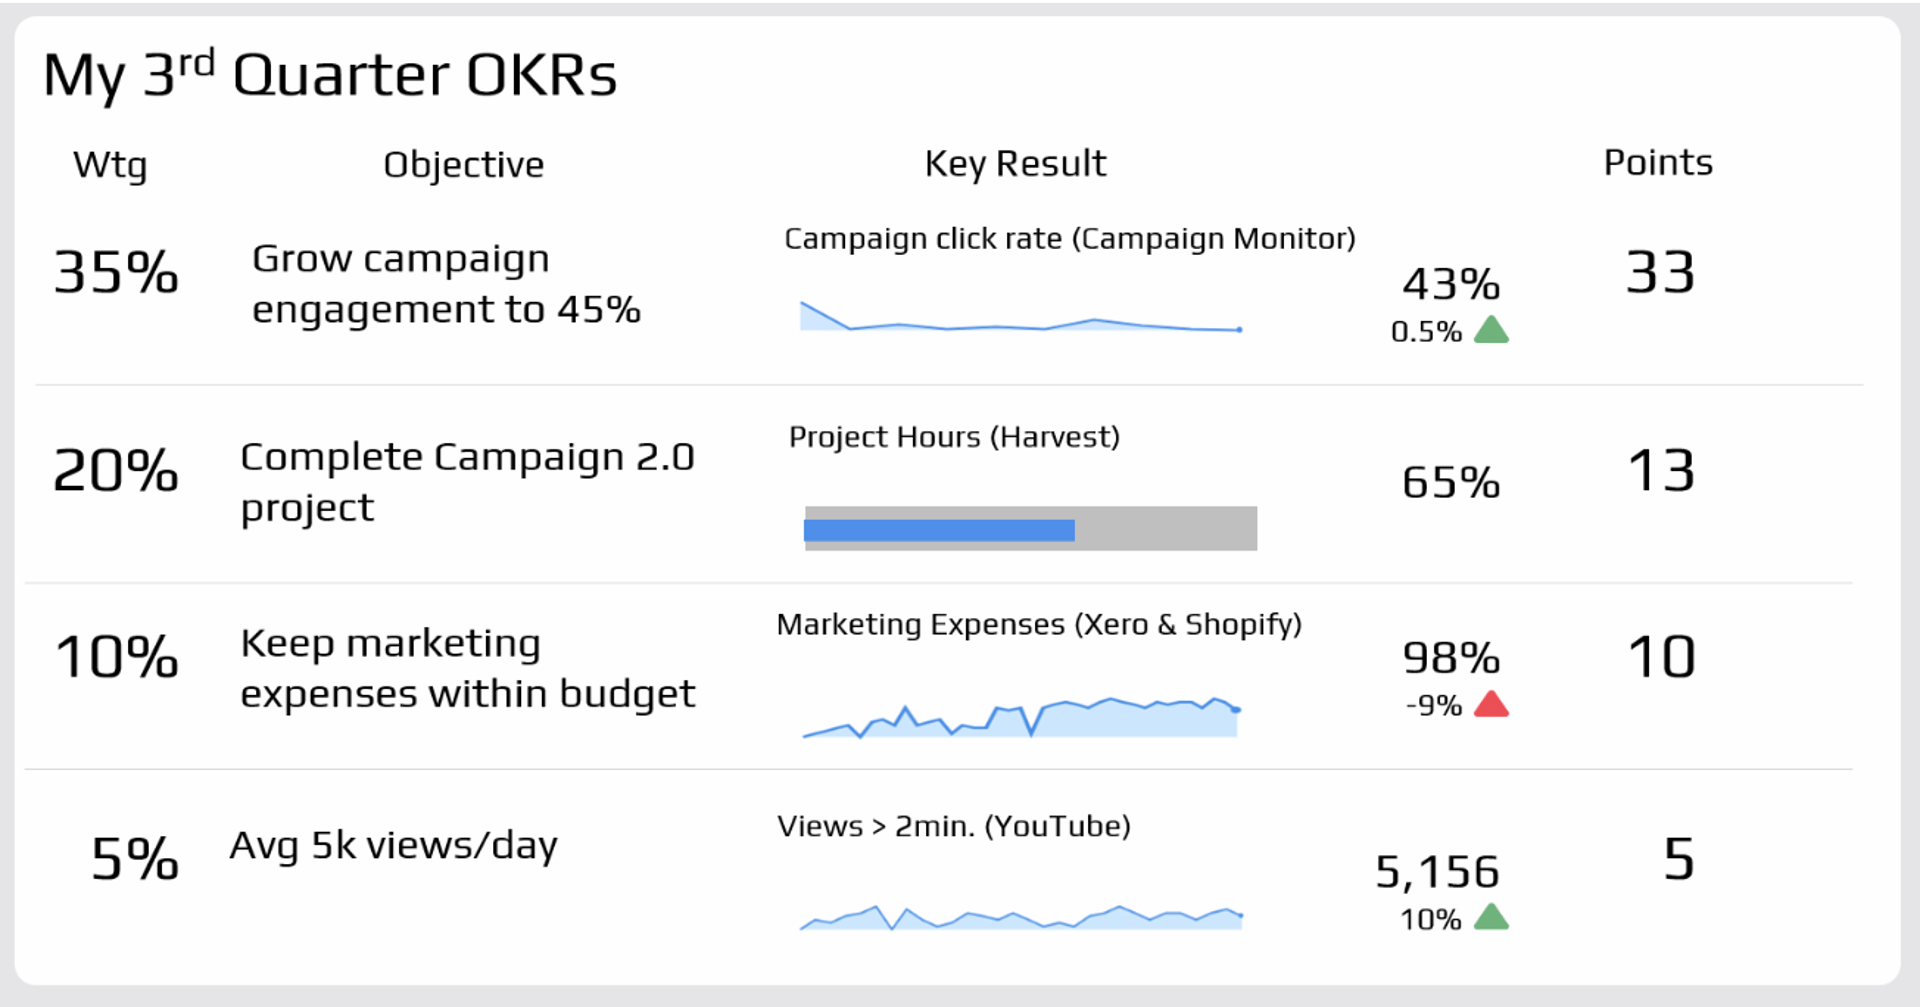
Wtg - The priority weighting set by the employee and their boss for this quarter. The sum of all the individual’s OKRs equals 100%.
Objective – What is require of the employee this period, stated with a [verb][ noun] and [target].
Key Result – The measurable (SMART) outcome that will be achieved by the end of this period if the employee successfully completes their responsibility. We stick to five visualizations only:
- Sparklines - For when we are primarily concerned with the flow across periods. INSERT IMAGE

- Bullet charts - For projects in which just want to know the level of completion (not worrying about other metrics like cost and on-time) INSERT IMAGE

- Thermometers – For non-projects where we just want to know the final score INSERT IMAGE
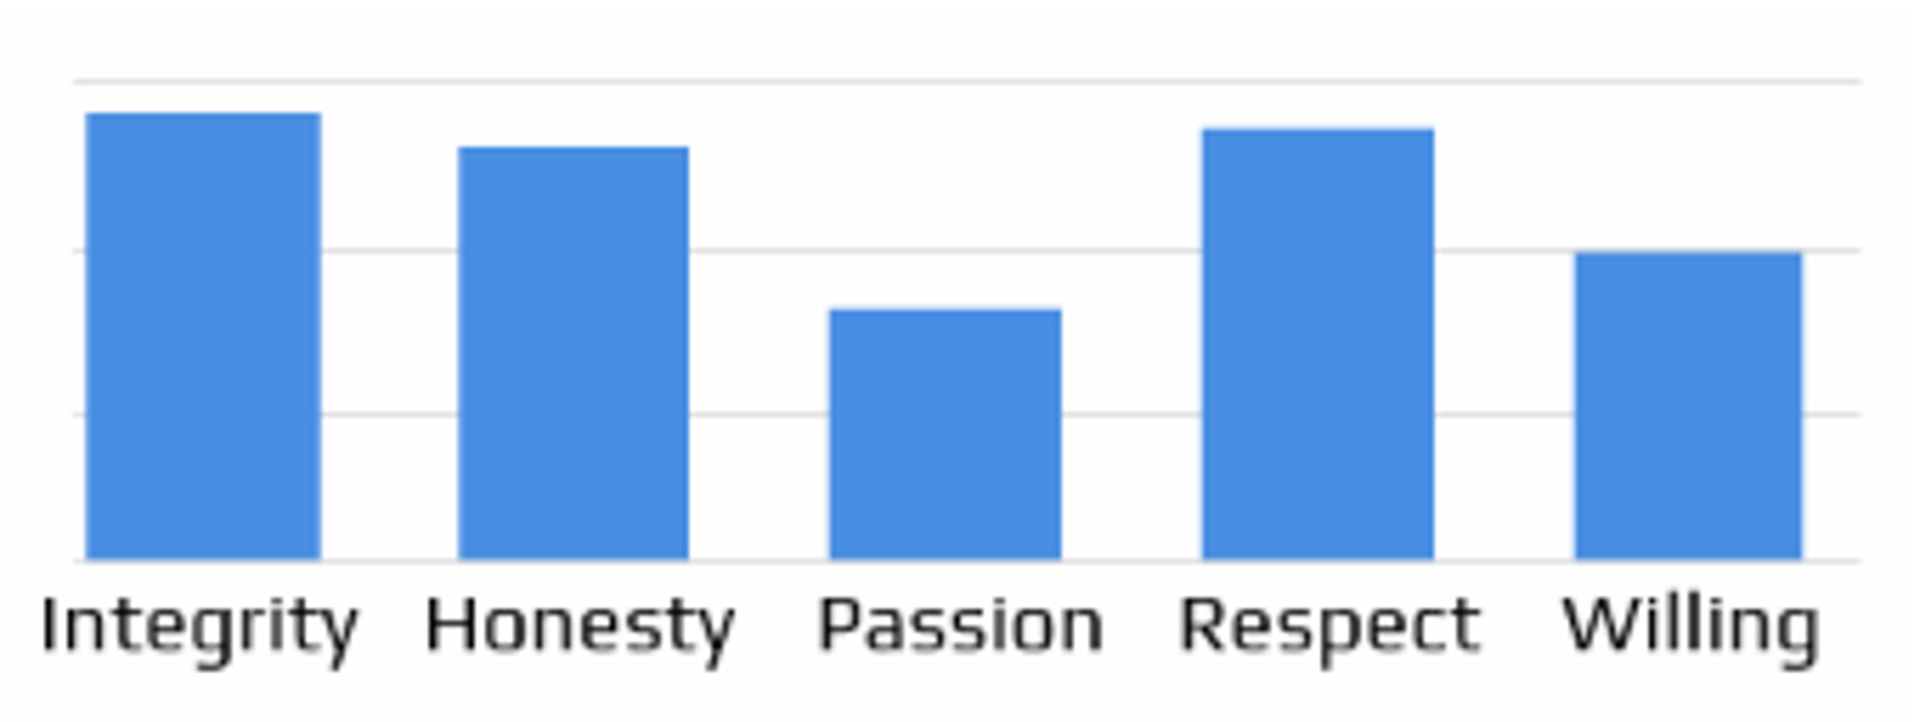
- Simple bar charts – For where we need to see several items together that are not a (process) flow across the period INSERT IMAGE

- Stars - For when we are scored by outsiders (customers, vendors, stakeholders) INSERT IMAGE

For each key result we note where the data is coming from (e.g. Google Analytics, Shopify, Oracle, etc.) on the title line.
Points – Each Key Result (KR) is scored out of 100. If the employee achieves the desired performance for the period, they earn 100 “strategy points”. The points earned is then multiplied by their weighting to calculate the points they earn for the OKR this period.[1]
In more sophisticated implementations, the role (e.g. RACI) you have in that process also influences your score – if you are responsible for doing the task you may get 100% of the strategy points. If you are accountable maybe you get 50% of the points, consulted 15% and informed, 0%.
----------------
[1] It is important to note that this scoring framework is not that advocated by John Doerr. John recommends a scoring scheme from 0 to 1. We have found that is difficult for employees to understand and also does not provide enough granularity to accurately score performance. But conceptually we're following this same idea but using a scale from 0 to 100 instead of 0 to 1. As I mentioned earlier, there are no hard rules to how you must do OKRs in your organization.
The Complete Picture
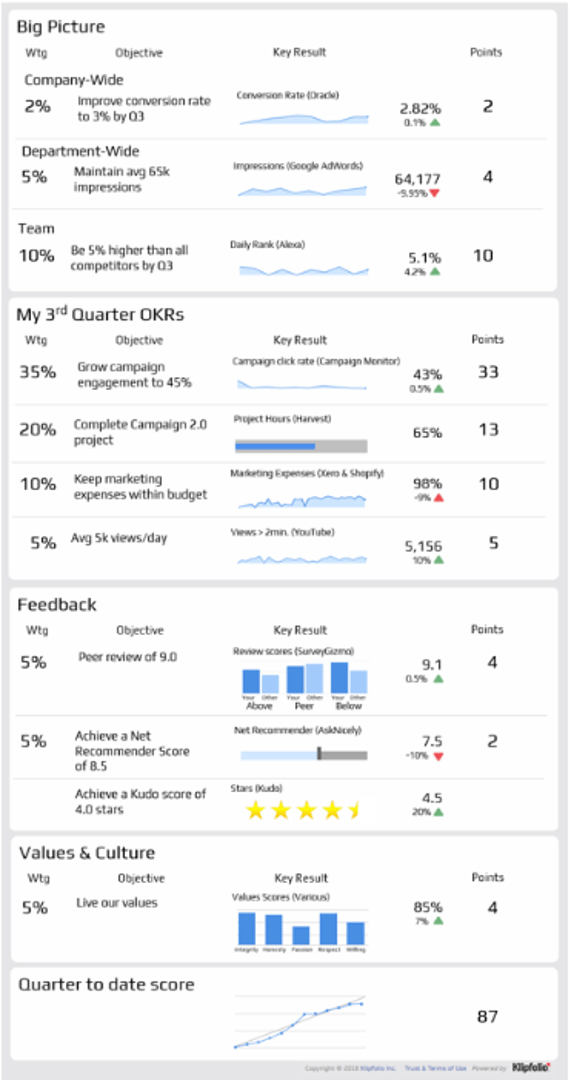
When we bring this all together we end up with an OKR dashboard like this.
There are a number of features of this dashboard:
- No one has to enter any data – it is automatically fed direct from your external sources
- It is real-time, removing the need for periodic performance reviews – you know all the time how you are performing. No surprises!
- It is easy to understand – you can read yours, anyone else’s, and any team or department’s without any special prior knowledge
- It is multi-platform and mobile for team meeting rooms, performance meetings, or while remote
- It does not duplicate what your Human Resources (HR) department already has in place. This adds to HR’s existing processes like annual goal-setting, performance coaching & conversations, documenting performance, etc.

Next Steps
Your OKR dashboard is standardized across your organization, but each team needs to fine-tune it for their responsibilities, priorities, etc. We typically run a three-day workshop to help create the Team OKR Dashboard that performs the strategic cascade, identifies key performance nodes, finds the KR, and helps to define the OKRs.
About Pm2
Brett is an Executive Partner at Pm2 (Performance Measurement & Management) an international consulting firm specializing in the development and implementation of strategic dashboards and scorecards. The frameworks they use includes OKRs (Objective and Key Results), Balanced Scorecard, 4DX (Four Disciplines of Execution) Lean, Six-Sigma, etc. Their work has been profiled in Harvard Business Review, Fortune and Forbes magazines as well as countless business books and periodicals. We are pleased to have this thought leader as an active contributor to our blog posts.
Related Articles

The Hidden Value of SaaS Sign Up Rate Benchmarks
By Priyaanka Arora — January 10th, 2026
Klipfolio Partner How-To #1: Duplicating dashboards across client accounts
By Stef Reid — November 27th, 2025
17 KPIs Every Data-Driven Manager Needs to Lead Their Team
By Danielle Poleski — October 14th, 2025

