
Summary - Are you making critical business decisions with incomplete data or gut instinct? Many businesses operate in the dark, waiting weeks for financial reports that are already out of date. This article outlines a practical, three-step process to help you choose the right systems, keep your data current, and use a real-time dashboard to monitor the financial metrics that truly matter. Move your business into the light and start making smarter, faster decisions today.
My journey into financial consulting for small and medium-sized businesses revealed a surprising, and risky, trend.
I was shocked to find how many companies were operating in the dark, with no visibility into their key financial metrics. Many leaders I met were making critical decisions based on incomplete information or, worse yet, gut instinct alone. They would often wait until year-end to discover their bottom line, simply because they hadn't defined their organization's KPIs. It was a common, and dangerous, blind spot.
Fortunately, I was introduced to Allan Wille, the CEO of Klipfolio, early in my consulting career. I was impressed with Klipfolio's mission to not only operate their own business with full transparency but to help others do the same. I’ve had the benefit of working with Klipfolio as they've grown their dashboard software into a leading SaaS business. Their ability to monitor key financial metrics in real time has been a massive contributor to their success. Every time I meet with Allan, he points to a metric on his dashboard, always focused on using data to gain insight or improve efficiency. At Klipfolio, having data available isn't just a goal; it's the only option for making smart, data-driven decisions.
Applying this data-first mindset to my clients, it became clear that the biggest challenge was accessing the right data in the right time frame. The traditional accounting cycle can take up to a month to close, which is often too late to react to problems or seize opportunities.
This led to a constant cycle of questions:
- Is the bookkeeping up to date?
- What other systems contain important financial metrics that we should be monitoring?
- Where is money being spent with zero return on investment?
Helping companies move from the dark into the light involves a clear, three-step process:
Choose your systems and set them up properly. An accounting system is priority number one. Accounting packages like Xero are easy to get started with and are an essential tool for any business. Hundreds of other systems are available to track various types of data. Decide which ones add the most value and, if possible, integrate with your accounting software to save time and money.
Keep your data as up-to-date as possible. This is easier than ever with automated online systems that provide data in real time. Google Analytics, for example, can give you website statistics at any moment. Other systems, like Salesforce or Basecamp, may require manual updating, so the key is to build processes that ensure data is always current.
Monitor and report effectively. Once your systems are in place, decide which key financial metrics need to be measured. Then, find a tool that helps you monitor that critical information in real time.
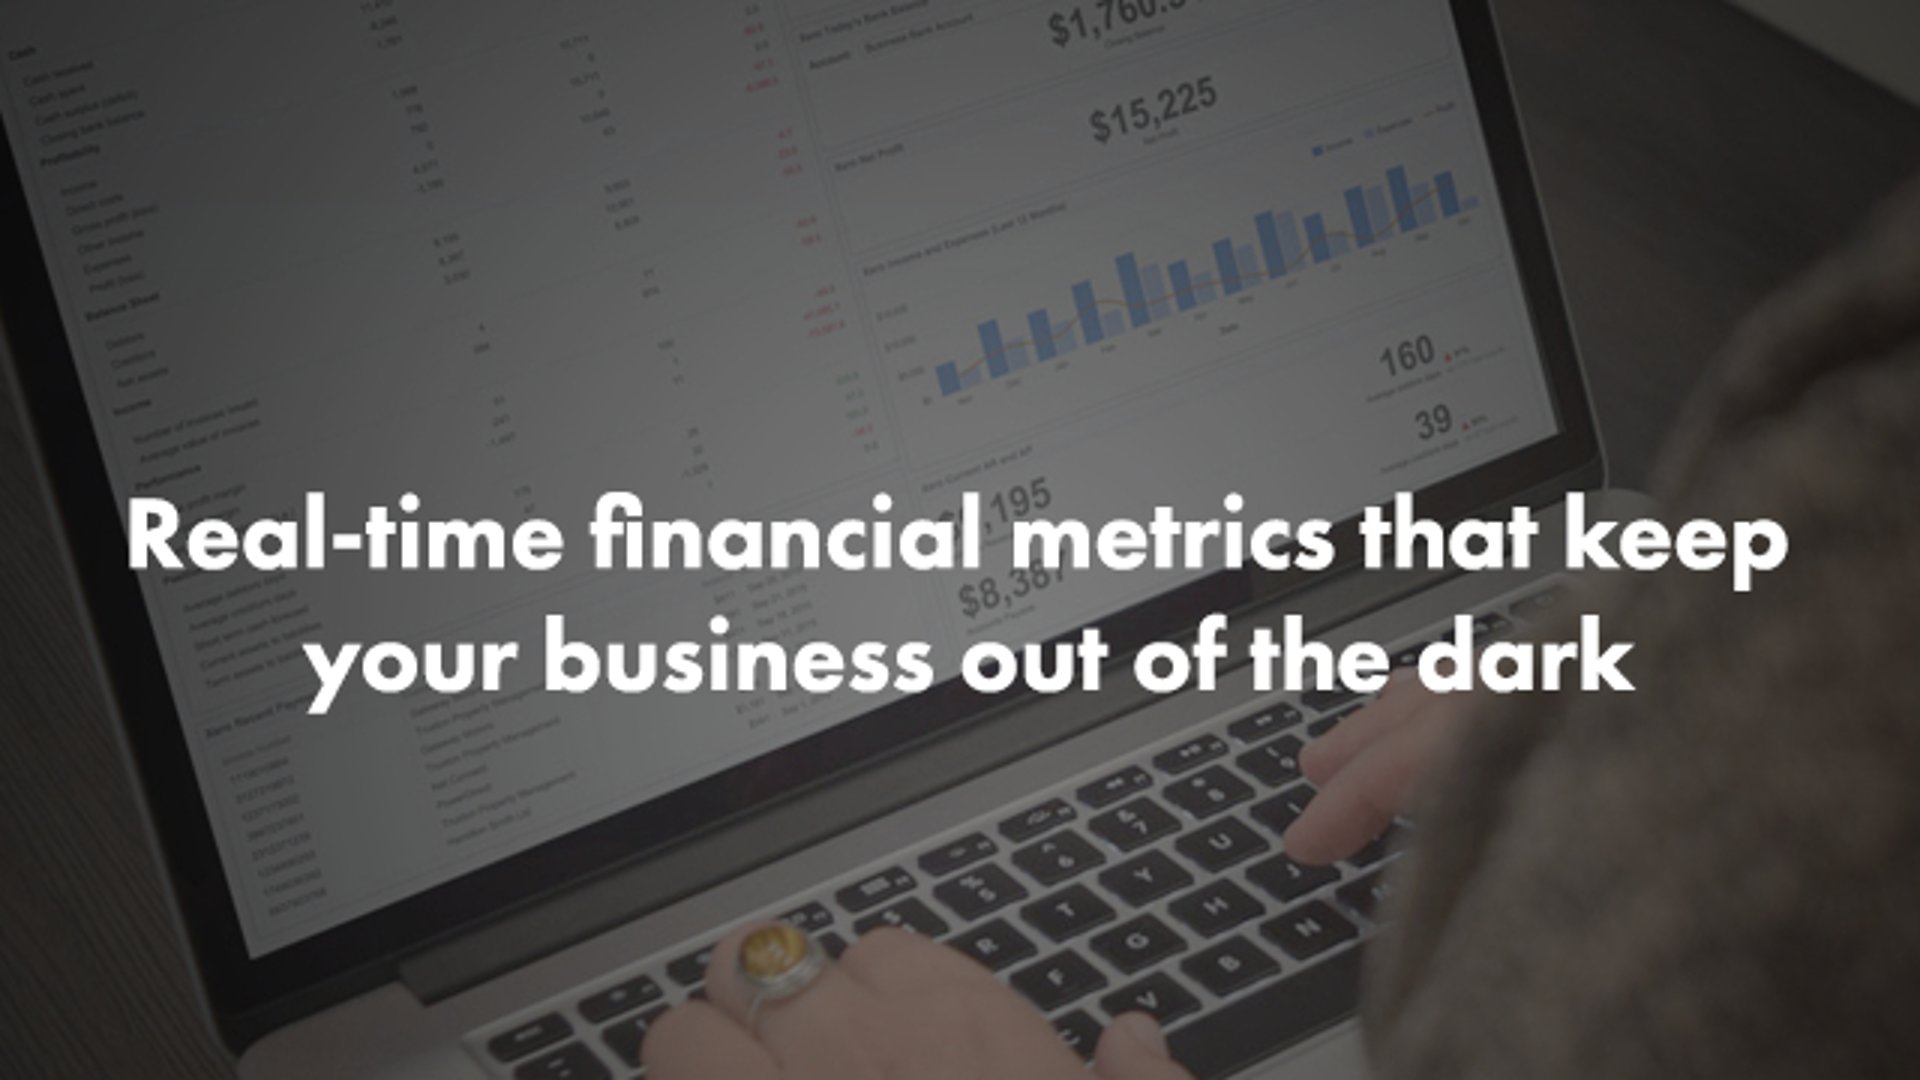
This is where Klipfolio excels. It allows you to pull data from various sources and present it on a single, unified dashboard. Instead of logging into multiple applications, the data is accessed through APIs and centralized for real-time monitoring. So, even if the accounting cycle isn’t complete, you can track critical metrics like payables, receivables, cash flow, billings, budget vs. actual, and monthly recurring revenue.
By combining different data sources, you gain constant visibility into key financial metrics. No more waiting for accountants to close the books to understand your most important numbers. With Klipfolio, you can create powerful financial and accounting dashboards in minutes, just like this Xero dashboard example.
I recall creating a financial dashboard for a client who was tired of spreadsheets. Although we had made great strides in organizing and monitoring her data, she simply didn’t want to open another Excel file. Learn more about Excel dashboards.
She wanted pictures, charts, and colours. We built a simple dashboard that gave her real-time visibility into her key financial metrics. We pull data from multiple locations, but it all appears on one dynamic dashboard. Our finance reviews are now more engaging and productive. Instead of having our heads buried in a spreadsheet, we can visually see how the business is progressing and have more strategic conversations about the path forward.
Taking a step back to identify what’s important and how it can be monitored is key to improving any business’s chance of success. Of course, it’s possible to grow without it, but why not reduce the sleepless nights? The information you need is out there. You just have to go get it.
Related Articles

5 tips to understand (and organize) your restaurant data
By Saleem Khatri — June 9th, 2026
6 dashboards I use daily to run my SaaS company
By Allan Wille, Co-Founder — April 10th, 2026
Business Metrics vs. KPIs: What’s the Difference?
By Jonathan Taylor — March 13th, 2026