

Summary - Need help dealing with information overload? A recommender system is a filter that will help your customers sort through the noise and find products they’ll find useful. Here’s how to create one.
Recommender systems are essential for web-based companies that offer a large selection of products. Amazon, Spotify, Instagram, and Netflix all use recommender systems to help their online customers make sense of the large volume of individual items – books, films, electronics, whatever – found in their content catalogues.
Those recommender systems provide value to customers by understanding an individual user’s behaviour and then recommending to them items they might find useful.
This blog post explains in five steps how to set up a recommender system, using the work we did at a Klipfolio hack day initiative as an example.
Why you need a recommender system
Over time, the main problem customers face has gone from lack of information to information overload.
Never before has information been so easy to obtain.
But there’s so much information out there that it’s easy to get overwhelmed.
Users need help filtering out the noise.
As Clay Shirky, a writer who has spent a lot of time thinking about the effects of the Internet, once put it:
“It’s not information overload, it’s filter failure.”
Recommender systems provide the help by creating a filter.
They have become so valuable that Netflix even created a competition called the Netflix Prize. The company released a dataset consisting of users and their individual ratings of certain movies. With that data, competitors were challenged with creating a system that predicted the ratings other users would give the movies. The winners received $1 million.
And get this: the winning algorithm was 10% more accurate than Netflix’s own algorithm.
The bottom line?
For customers, recommender systems are “smart” filters that help them discover what they like.
For businesses, recommender systems drive engagement with content and increase revenue.
Two kinds of recommender systems
There are two basic ways to filter information for users.
1. Item-based filtering recommends items similar to those a customer has already bought, based on a domain-specific notion of item content.
With item-based collaborative filtering, if a person liked Movie A, a movie recommender system would recommend movies with similar characteristics. Those characteristics could include producer, starring actors, genre, run time, release date, etc.
2. User-based collaborative filtering works differently. It finds customers who have similar preferences, and then it gives recommendations to one customer from a set of items that are new to that particular customer and preferred by other customers with a similar profile.
User-based collaborative filtering operates on the assumption that people with similar movie watching habits have similar preferences in general. It finds people who watch movies similar to those the user watches, then it identifies movies those similar users have watched, but which the first user has not. And it makes recommendations on that basis.
As a hack day initiative at Klipfolio, I decided to use a user-based collaborative system to recommend new Klips to our active users.
Here’s a high-level basic overview of the steps required to implement a user-based collaborative recommender system.
1. Collect and organize information on users and products
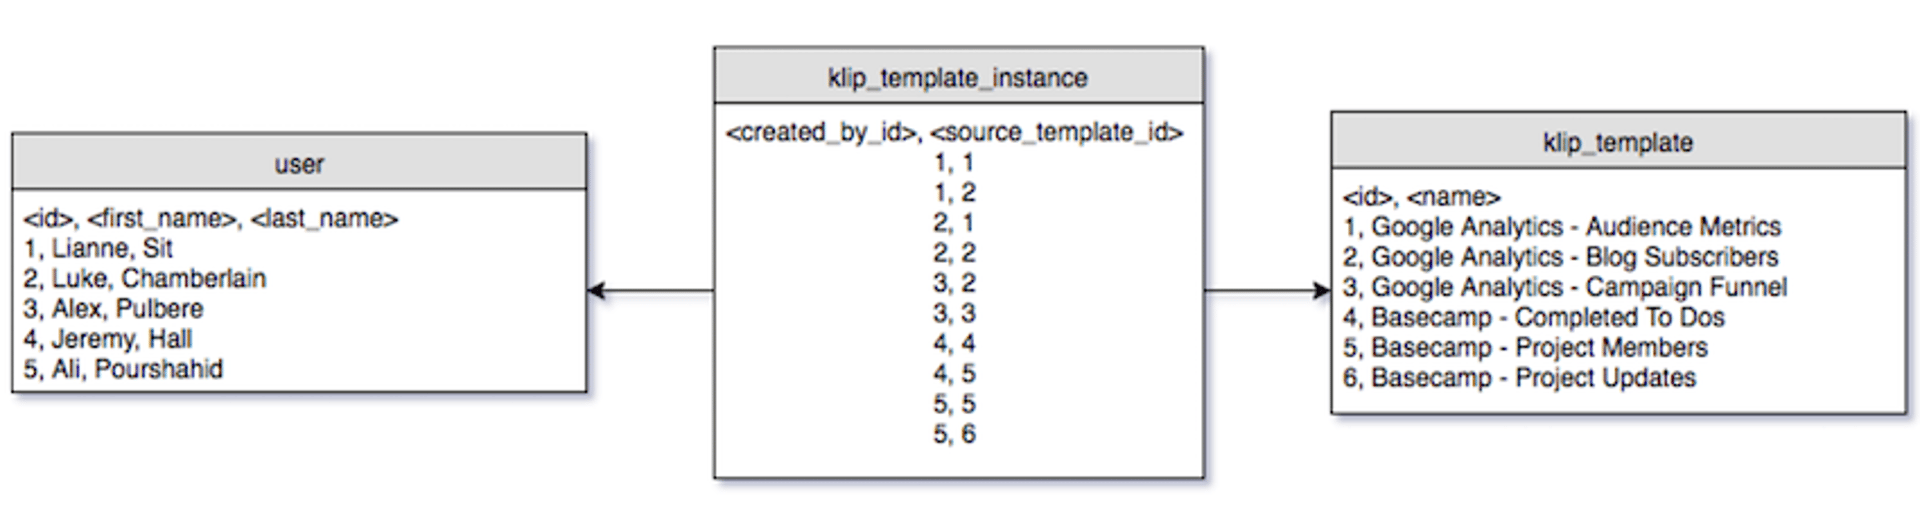
This is the essential first step. You need to know who your users are and what they are using. In our case, it was Klips, the data visualizations that drive engagement with data that Klipfolio users connect to in the product.
We needed to understand the connection between the Klips being used and the profiles of the people using them.
In our production database, we had tables that would link users to the Klips that they have used. Using some basic queries, we were able to extract this information, transform it into a standard (canonical) form, and load it into an in-memory table that could be queried much faster and easier than the production database.
This process is generally referred to as an ETL (extract-transform-load).
As you collect the information, it's important to organize the material into some sort of standard form. With a standard form, a customer and the products he or she uses can be compared easily to other customers and other products.
In this situation, we represented each user as an n-dimensional row in a table. The n columns corresponded one-to-one with every possible Klip in the product.
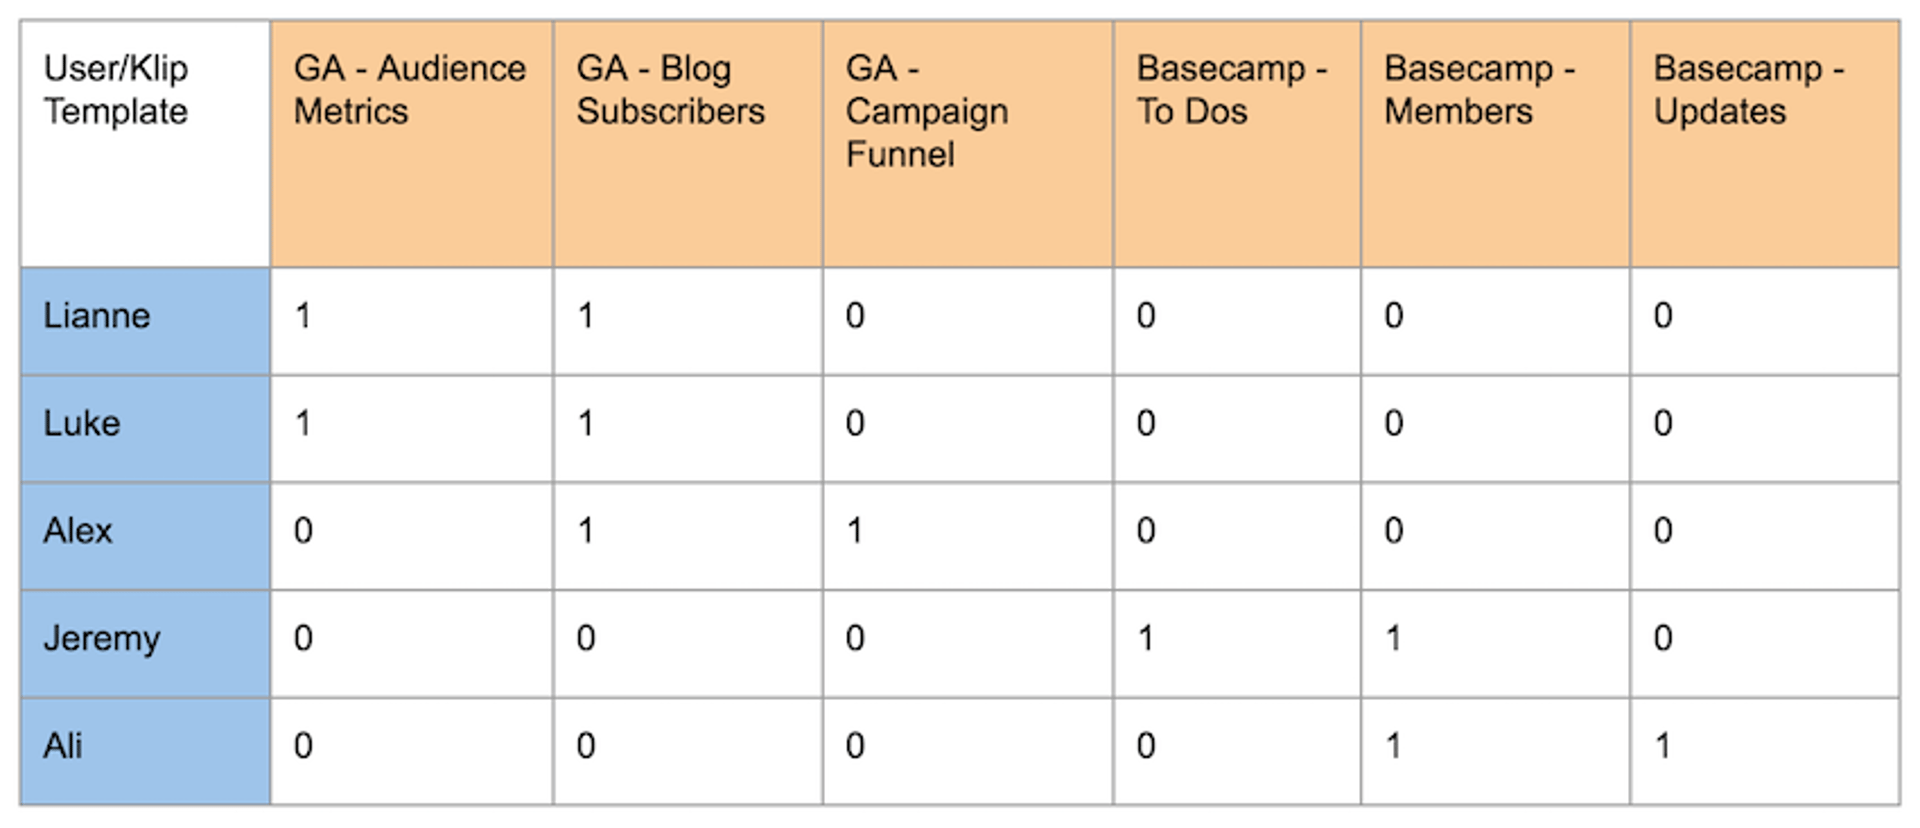
If a user had used the Klip in that column, then they were marked as having done so, and if they had not, they were marked as having not. This was done using values of 1 and 0, respectively.
As an example, the sample data presented above would transform into the following representation:
With this transformed data, we can then discuss the steps that would have to be taken to make Klip recommendations for a given user.
Let’s call the person we want to provide recommendations for User A.
2. Compare User A to all other users
Using those standard forms, you next design a function that compares User A to all other users.
This function should create a set of users (along with the Klips that each has used) that are most similar to User A.
Using common machine learning libraries like Python's scikit-learn, we are able to use the Nearest Neighbours algorithm out of the box on our transformed data to compute this user set.
This algorithm uses some of the most common distance measures (e.g., Euclidian) in linear algebra to compute the similarity between a set of vectors (e.g. the table above) and a single query vector (i.e., the vector that represents the Klips that User A has already used).
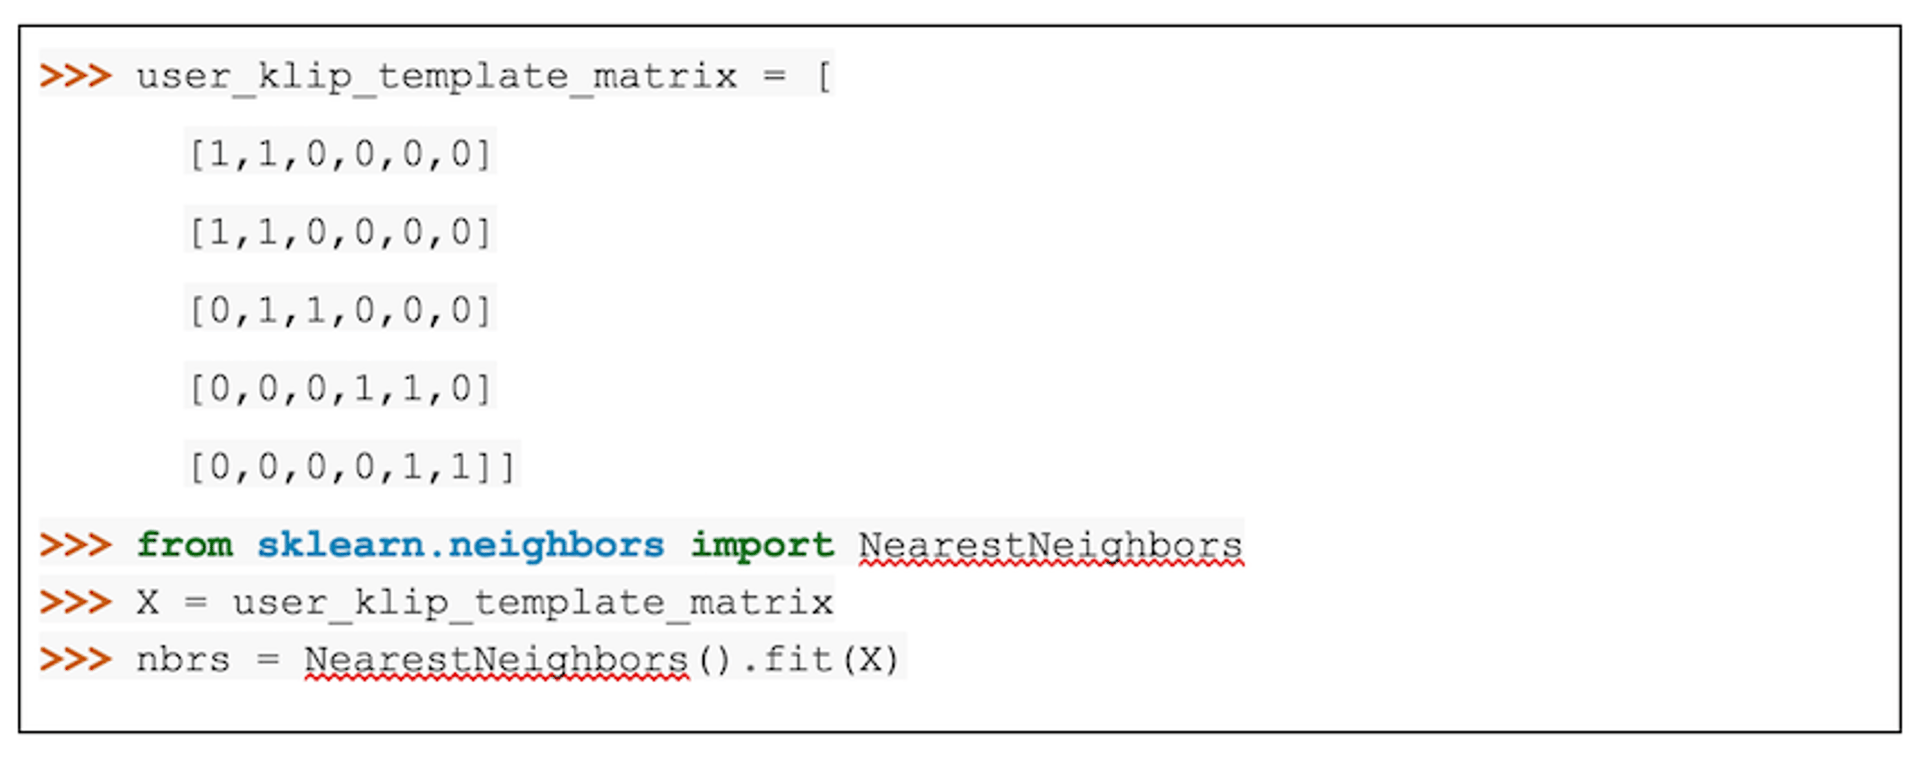
With the above model, we are able to input a query vector that is of the same n-dimension, and receive a set of users in the original dataset that are most similar to User A.
As an example, suppose User A has used the Google Analytics Audience Metrics Klip and the Google Analytics Campaign Funnel Klip.
The query vector in the same standard form as presented above looks like the graphic below, and can be used as input to receive a list of the users (represented as their row number in the table).
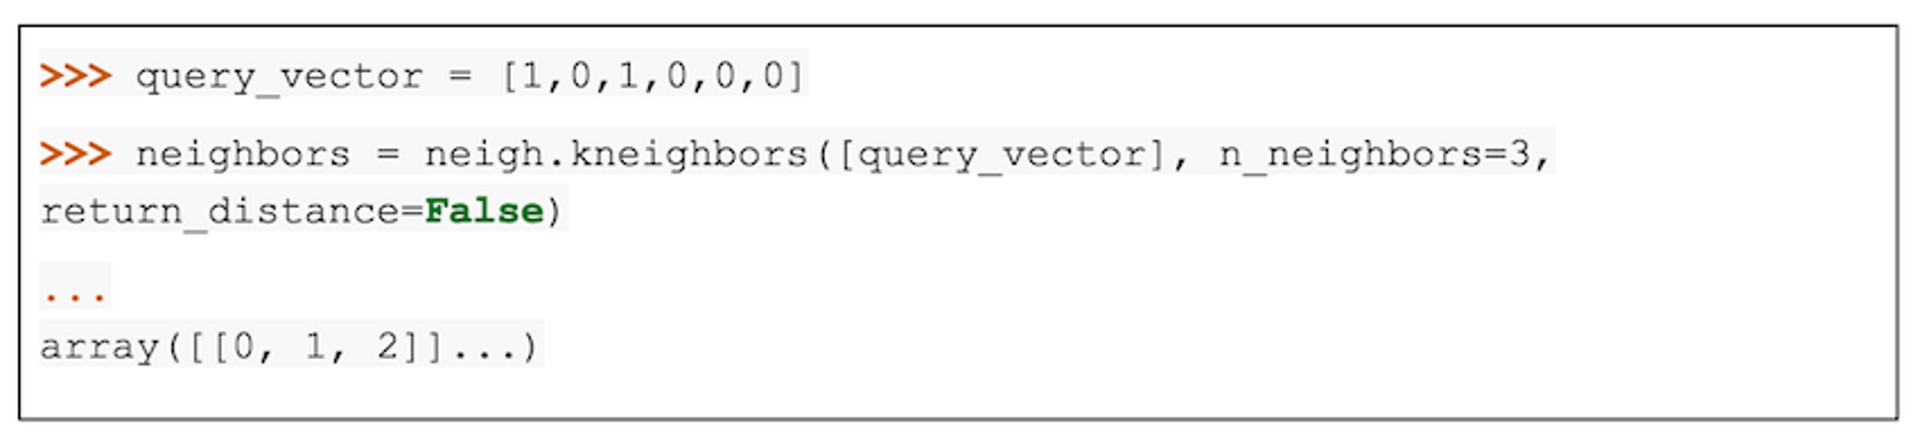
Users 0, 1, and 2 correspond to the users Lianne, Luke & Alex in the original dataset.
3. Create a function that finds products that User A has not used, but which similar users have
Since we discovered that Lianne, Luke, and Alex are most similar to User A, we can examine each user’s vector to determine the Klips which are new to User A but used by these similar “neighbours.”
This can be done using basic set theory operations on the set of Klips used by the neighbours, and the set of Klips used by User A. For example:

And in our example dataset, it looks like this:

These products are ones that a user-based recommender algorithm could recommend to the user. The intuition originates from the fact that because the users have used similar Klips to User A, the additional Klips that they have used may also be of interest to User A.
4. Rank and recommend
If we want to interest User A in new products, we’ll increase our chances of success by assigning a higher rank to products that customers similar to User A already use.
We can extend the recommendation system by ranking the recommended items to User A. The greater the number of similar customers using a Klip, the higher the rank that Klip gets assigned.
The intuition behind this is that if many of the similar customers use a specific product, it is likely that User A will find it useful as well.
The system will then recommend to User A the items that rank highest on the list.
5. Evaluate and test
Don’t assume you are going to get it right the first time. Test the accuracy of the recommendations your system generates by using the original collection of users and their products from Step 1.
Select a few users to act as “test users” to be compared to the remaining users.
For each test user, we remove some of the Klips we know they have used. After processing them with Steps 2-5, we then see if the recommended results match those that were removed.
If their extracted items are recommended to them again, you know the system is working accurately.
For example, in our example dataset in this post, a typical situation could look this:
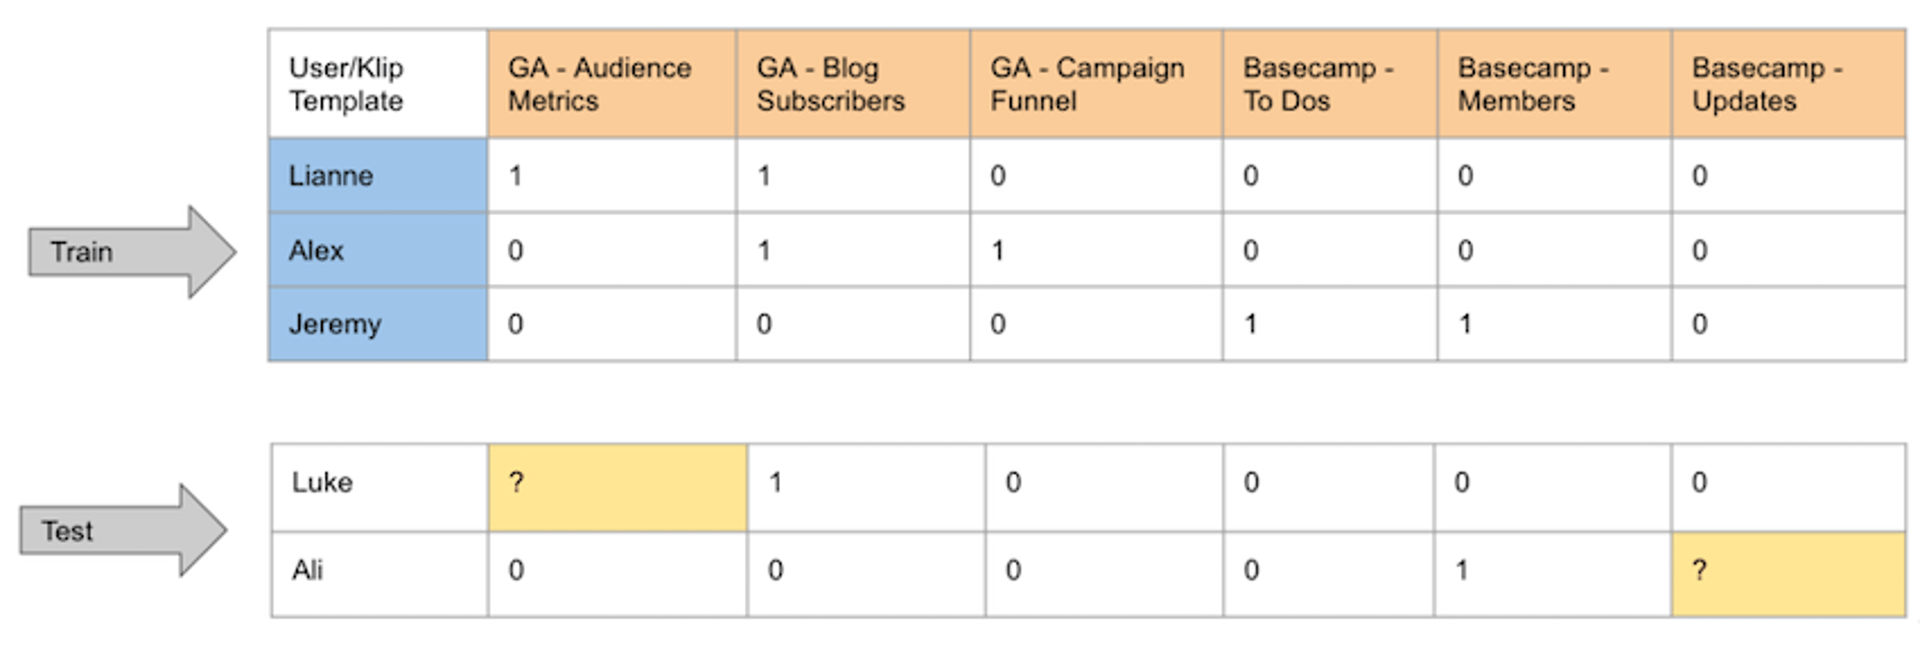
In this scenario, we would be querying recommendations for the users Luke and Ali, against a dataset containing Lianne, Alex and Jeremy.
If the recommendations provided correspond to the Klips that had been removed for the test users (yellow), then we can start to have more confidence in the effectiveness of our recommender system.
Wrapping up
In summary, the process of implementing a basic user-based collaborative filtering recommender system can be realized in five pieces.
First, collect each users' usage counts for the items you are going to recommend in your system (e.g., Klips). This should be collected in a standard form so that comparisons can be made easily between the item usage of any two users.
Second, given a user, User A, who needs recommendations for new items, compare that user’s current item usage to the current item usage of all other users. We can obtain the users with the most similar usage patterns to User A using distance-based neighbour algorithms operating on the vectors representing each user's item usage.
Third, gather all the items that are used by the users most similar to User A. Using this set of items, we can remove the items that User A is already using. The remaining items become candidates for recommendation to User A because they are used by the similar users but not yet used by User A.
Fourth, with this set of novel items to recommend, rank the order in which the items are recommended by counting the occurrence of each item in the set. If an item occurs more frequently among the neighbours, then that item should be recommended with more confidence.
Fifth, the system can be tested using common cross-validation methods. In our example, we demonstrated the simplest holdout validation strategy. A subset of the users and their usages of specific items are “withheld” and they are added as test users for which item recommendations are to be made.
The remaining users are used as training data (i.e., the set of users to which we compare the test users for recommendations). The aim in testing is to correctly recommend the withheld items from the test users' usage patterns.
Understanding these five pieces provides a great entry point into realizing the benefits of a recommender system. With this information, you can start to explore the improvements that can be made so that a recommender system not only optimizes the experience for users filtering through large web catalogues, but also increases their engagement with your product.
Shaughn Finnerty is a software developer at Klipfolio.
Related Articles

Anatomy of a great API
By Danielle Hodgson — January 21st, 2026
Klipfolio Partner How-To #1: Duplicating dashboards across client accounts
By Stef Reid — November 27th, 2025
Klipfolio Partner How-To #2: Company Properties can simplify client set-up
By Stef Reid — November 26th, 2025