

Summary - Most businesses still rely on metrics and dashboards designed in the 1960s. Learn why real-time, strategically contextualized dashboards are essential for managing a modern organization and how the RTS Dashboard framework helps every team stay aligned.
Executive summary
Most businesses still rely on metrics and dashboards designed in the 1960s. That approach no longer works. Here are four reasons why you need a new framework:
- The pace of business has accelerated far beyond what it was even a decade ago
- Accurate daily and weekly data is now available and actionable
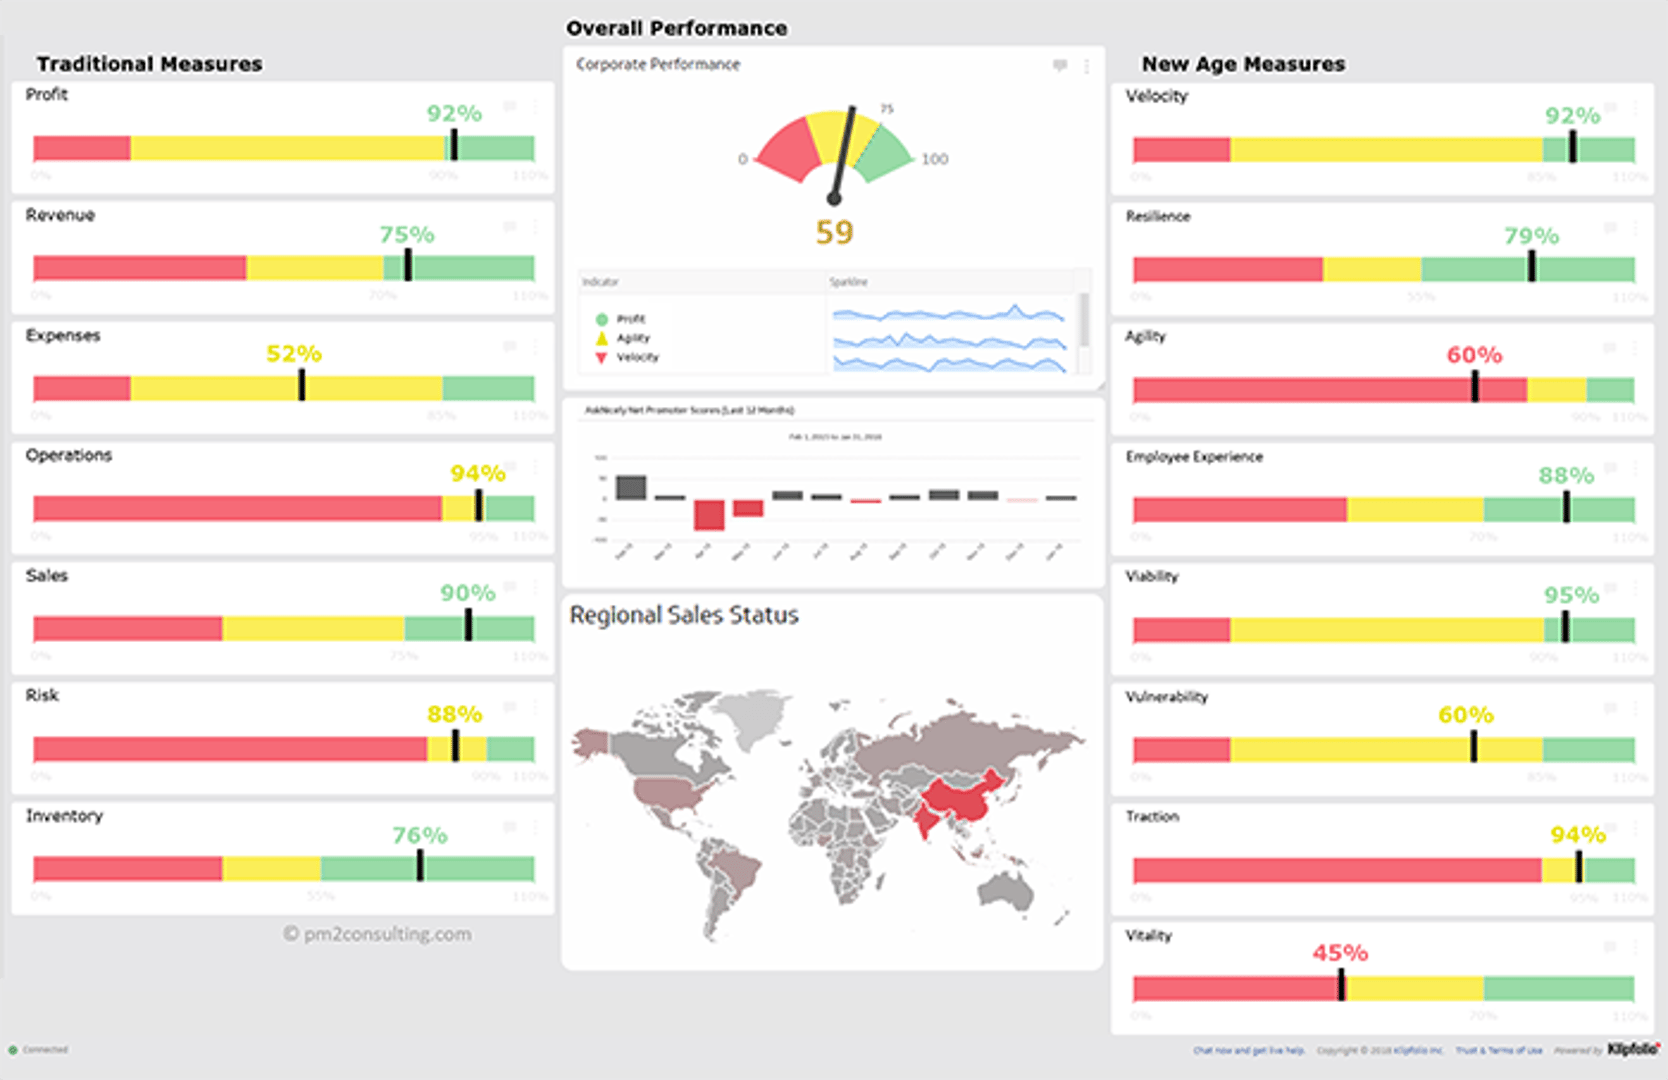
- What drives success has changed — organizations now track Risk, Traction, Velocity, Viability, and Vitality
- Strategy is everyone's everyday job — you can no longer wait for a command-and-control hierarchy to react to business issues
So where does that leave us? Looking for real-time feedback. Performance needs to be placed in strategic context. And that context needs to be as accessible and intuitive as your car's dashboard. That is the Real Time Strategy Dashboard, or RTS Dashboard.
More about the need for an RTS dashboard
Measure more
Today's cars produce about 22% more power from engines less than half the size of those built in the 1960s. Why? Better-designed processes, multiple onboard computers managing sub-systems like fuel and combustion, improved materials, and society's demand for greater efficiency.
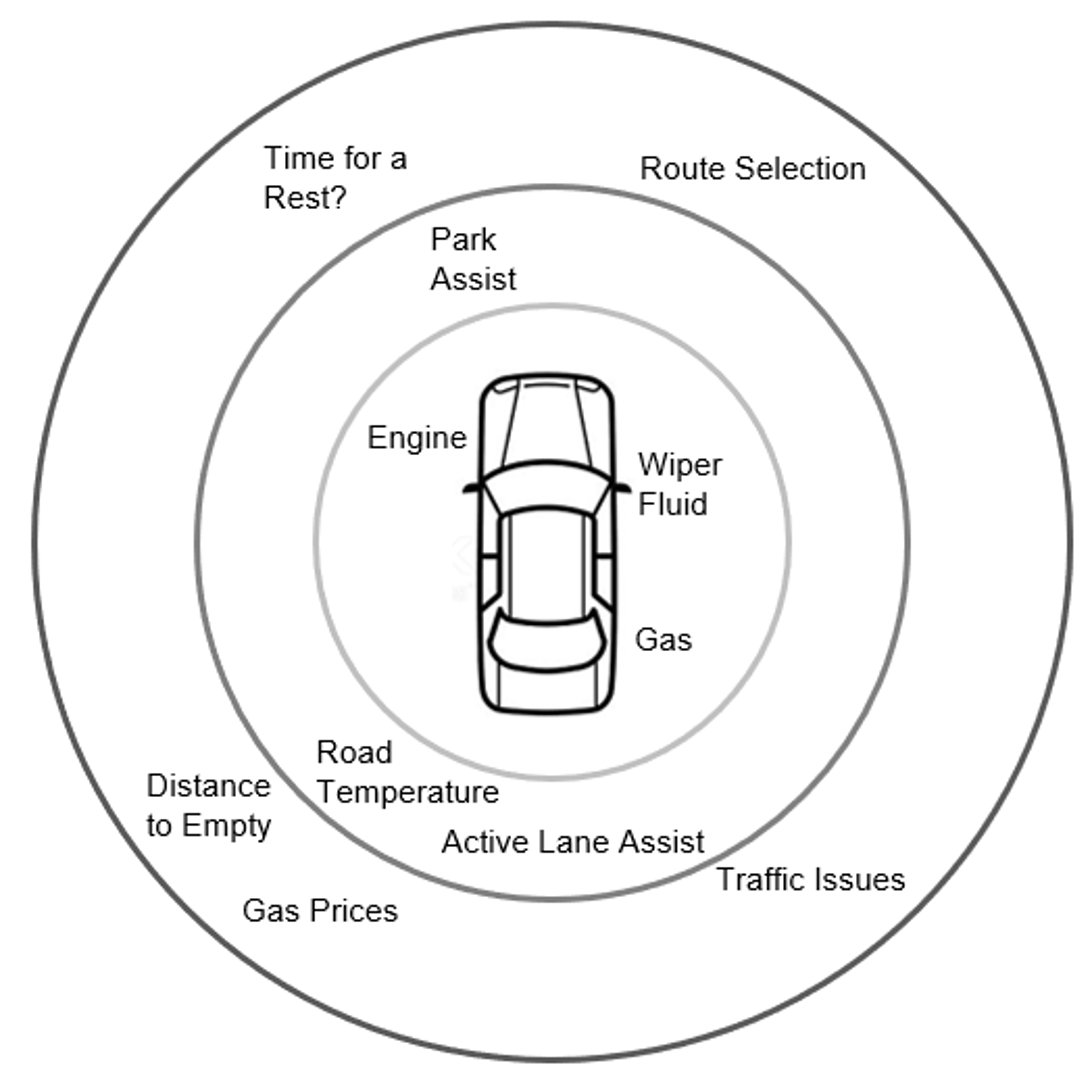
Car dashboards have evolved just as dramatically. In the 1960s, a dashboard showed only the internal workings of the vehicle: gas level, speed, engine oil, engine temperature, voltage. You needed to think like a mechanic to interpret it.
Today's dashboards are different. They simplify information so anyone can understand it — a "check engine" light instead of raw voltage readings. They pull in data from outside the vehicle too: road conditions, traffic, alternative routes. The result is a far more effective driving experience.
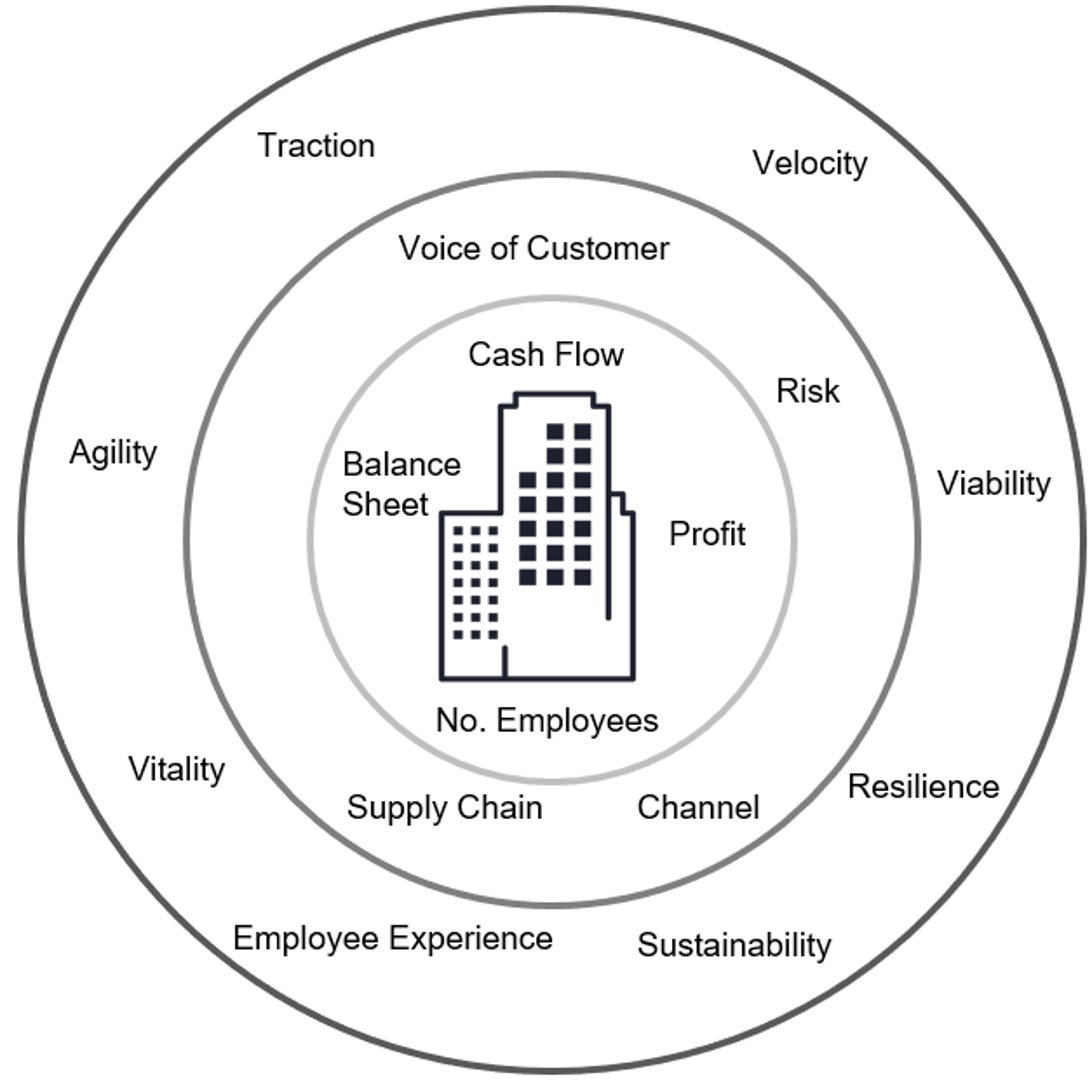
Businesses face the same challenge. Traditional measures focus only on internal operations, and you still need a process expert to interpret them. We moved our work from paper and flip charts to computers, yet we still present information in spreadsheets and slide decks — formats that demand the same level of expertise as before.
Management needs the same upgrade that transformed our vehicles. Businesses are exponentially more complex than they were in the 1960s. CRM tools, HRIS platforms, project management software — each operates in isolation, generating countless decisions that never get aggregated into a single view of the truth.
Moving forward also means measuring what lies beyond the organization's walls — the equivalent of traffic, weather, and road conditions. Social media gives online voice real influence. The perception of your organization must be monitored. That same online voice can promote your products or surface the next big opportunity. Community relationships shape how you are perceived. And the signals extend well beyond social media: point-of-sale activity, foot traffic, and much more.
Measure faster
Everything about business moves faster than it did a decade ago: changing products, shifting consumer demands, new technology, volatile markets, fluctuating exchange rates. Your business needs to change faster than change itself. Agility is no longer optional — if you are not agile, your competition will outpace you at an ever-increasing rate.
The need for speed
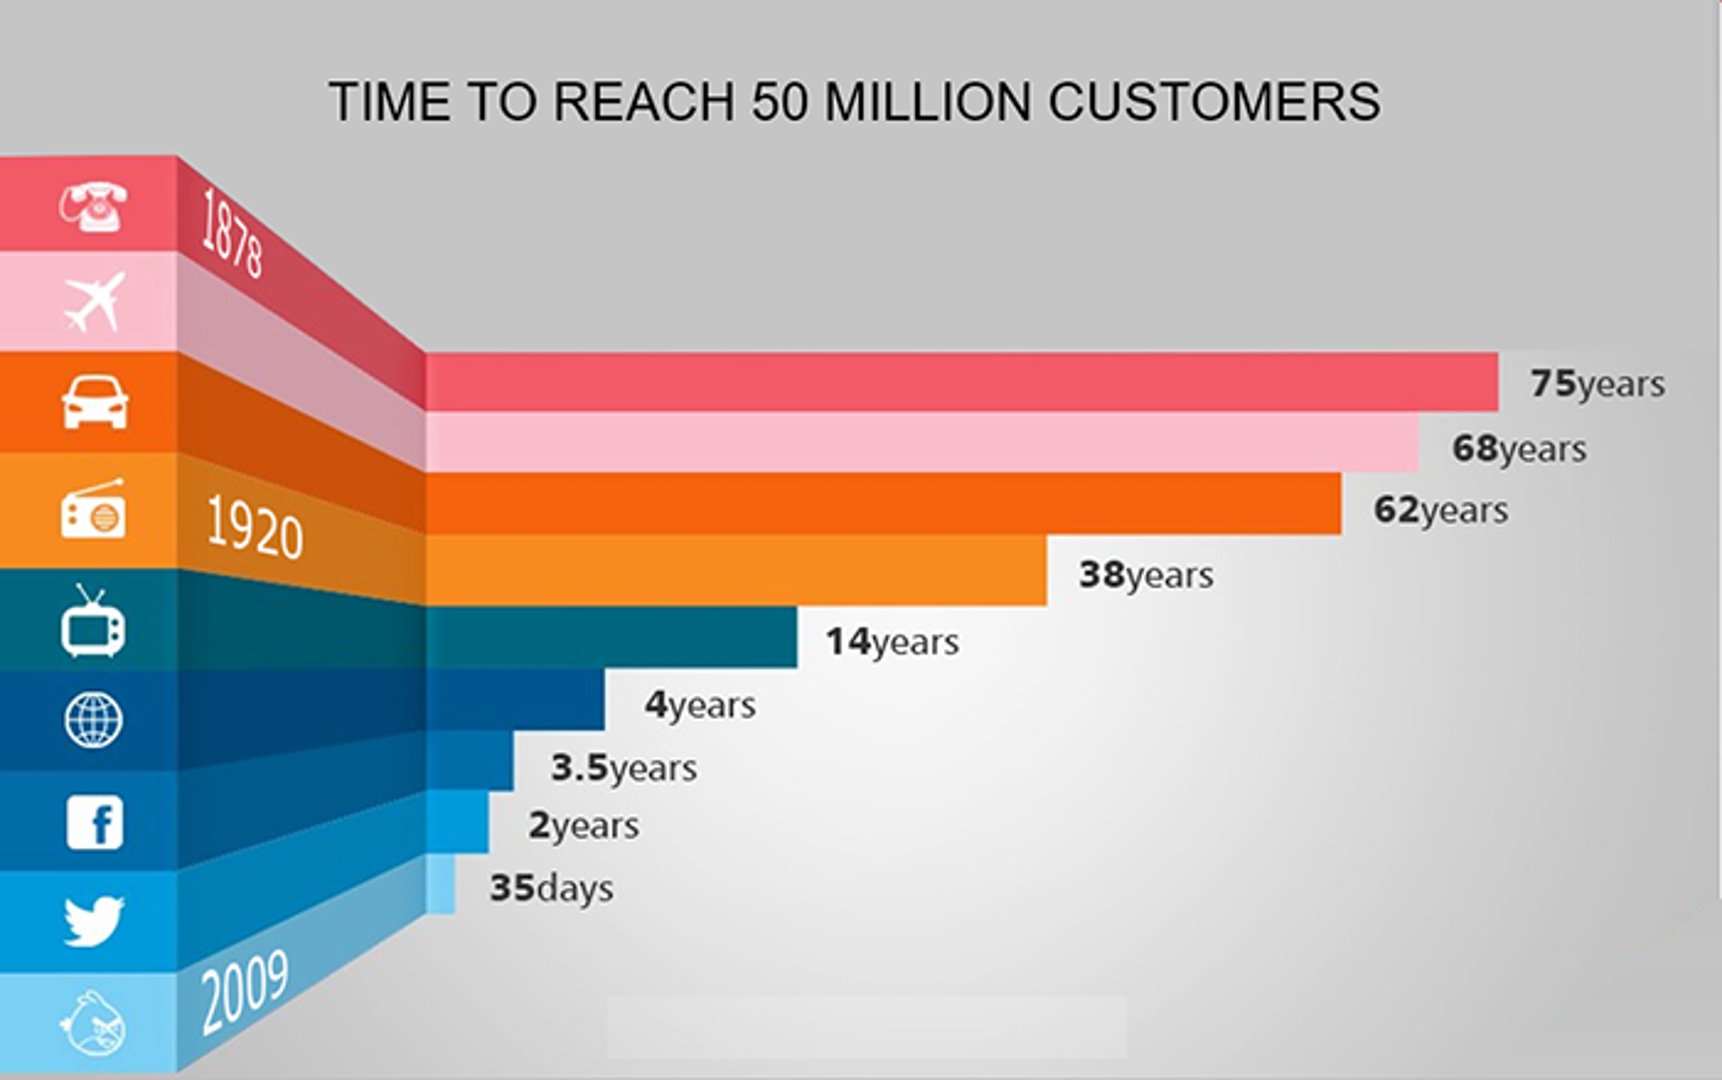
We have all seen charts describing the ever-increasing speed of business and new product introductions. But consider this perspective:
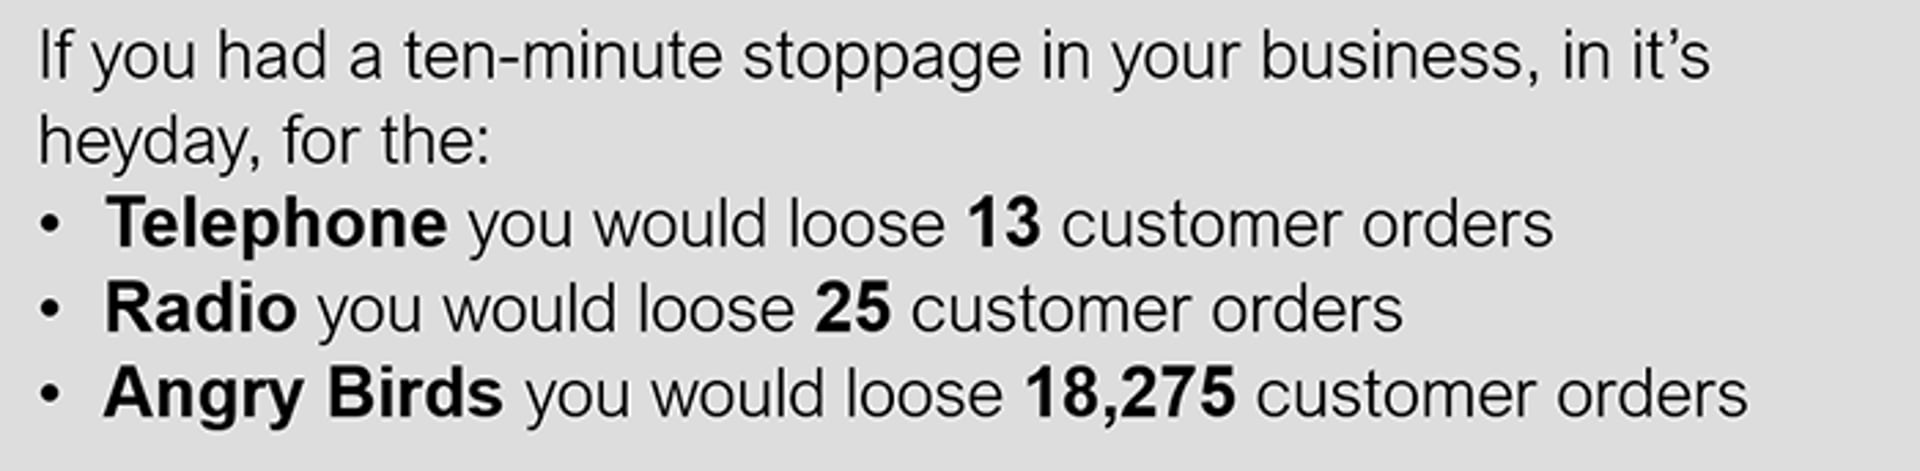
A ten-minute outage in a major app's sales process today would equal roughly 10% of radio's entire annual sales in 1925.
Your current reporting framework was designed in the telephone and radio era. It does not have the near-real-time data you need to manage a business today.
Look at measures through a strategic filter
A dollar of sales gained in your strategically critical market is worth far more than a dollar of sales in your traditional market.
Strategy is everyone's everyday job
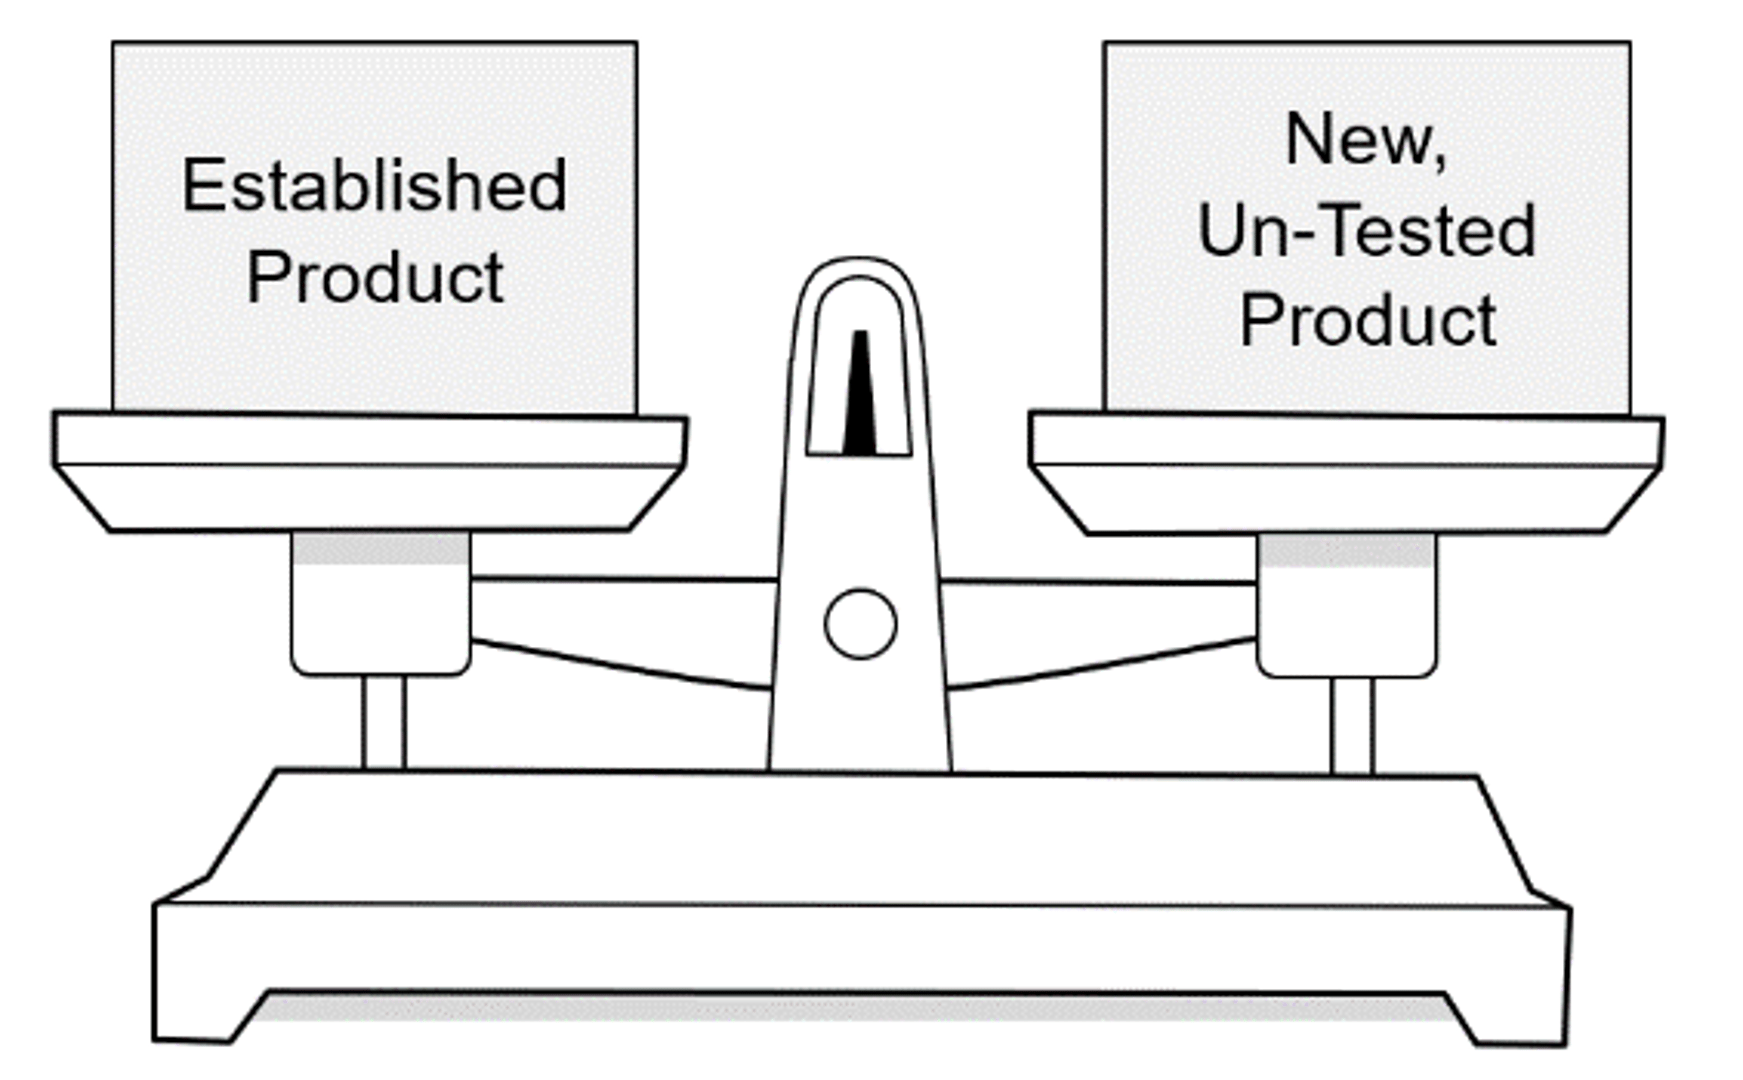
Imagine your company has two products. The first is a market leader — it has owned its category for 20 years, commands a premium price, and has loyal customers with satisfaction scores higher than any competitor. The second is untested. It targets a completely different market, in a sector the company has never entered, doing something no one has seen before.
Which product does your sales team sell? The established one, every time. Every sale is straightforward. There is no competition.
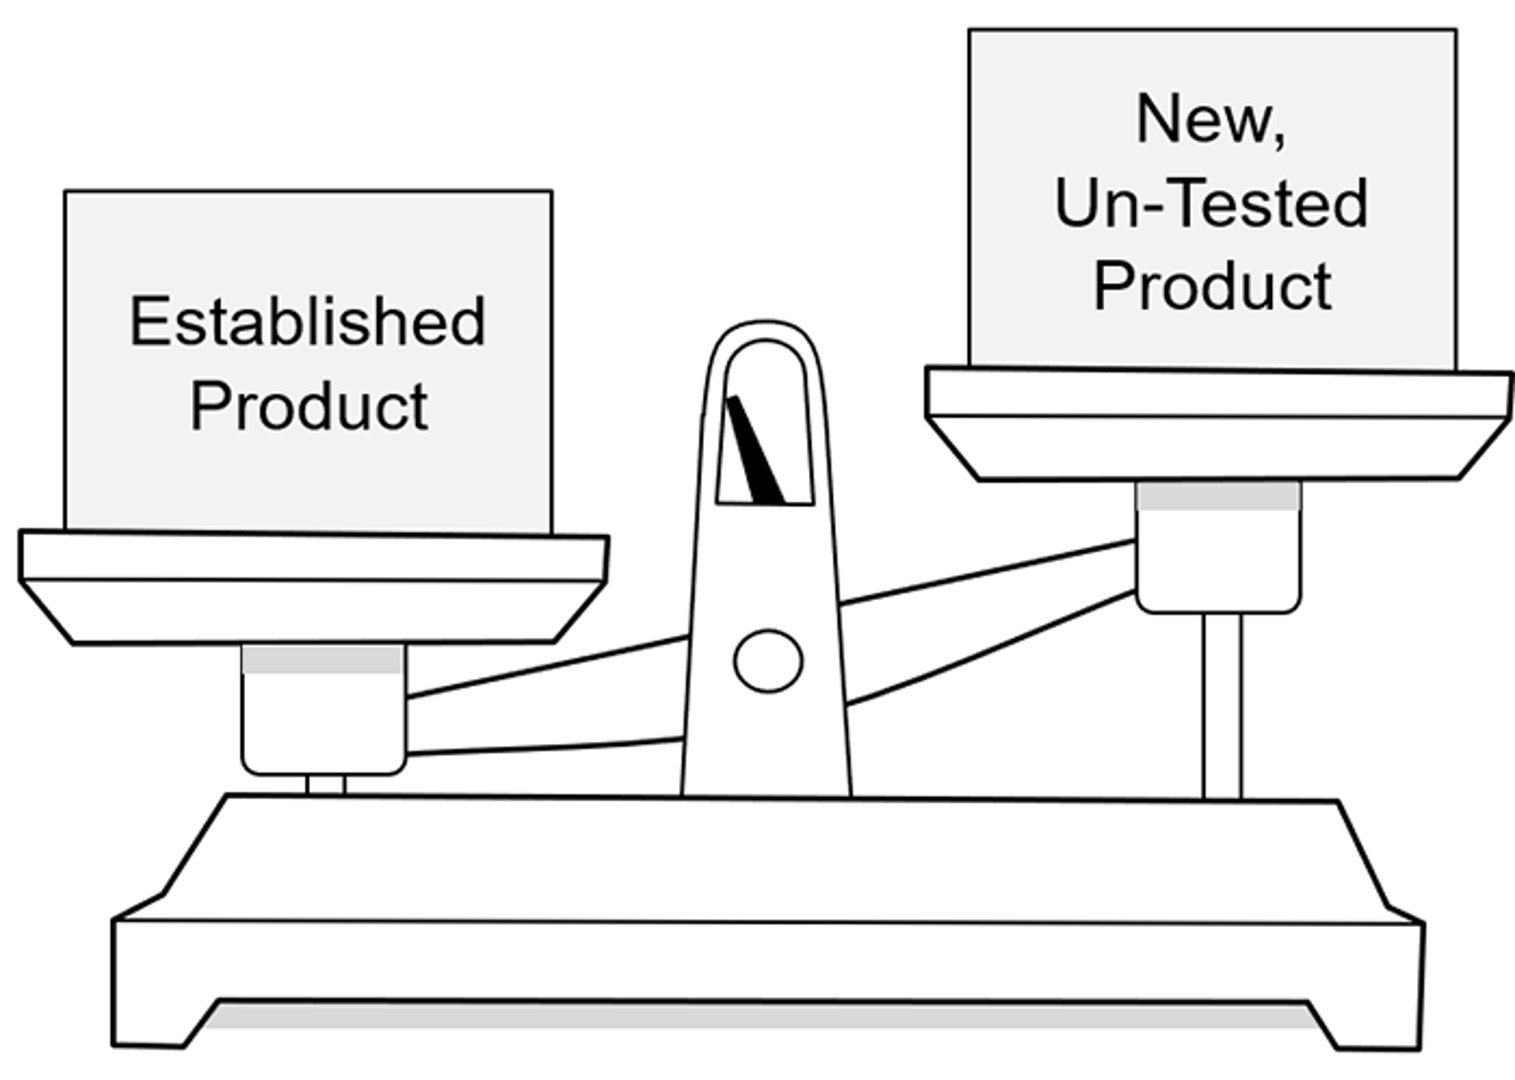
The new product requires training time. Sales will be slow at first — and possibly for a long time. Revenue may not even cover costs.
The established product wins every time. (Read Clay Christensen's The Innovator's Dilemma for a deep exploration of this dynamic.)
The company's problem: they are fairly certain the new product is going to take off — and it may even surpass the established one.
To act on that conviction, the organization must cascade its strategy down to the team and individual level. It needs a dashboard — available down to each individual salesperson — that makes performance expectations and rewards for selling the new product crystal clear. That dashboard could even show how someone earns more "strategy points" for activities that lead to new product sales, including training.
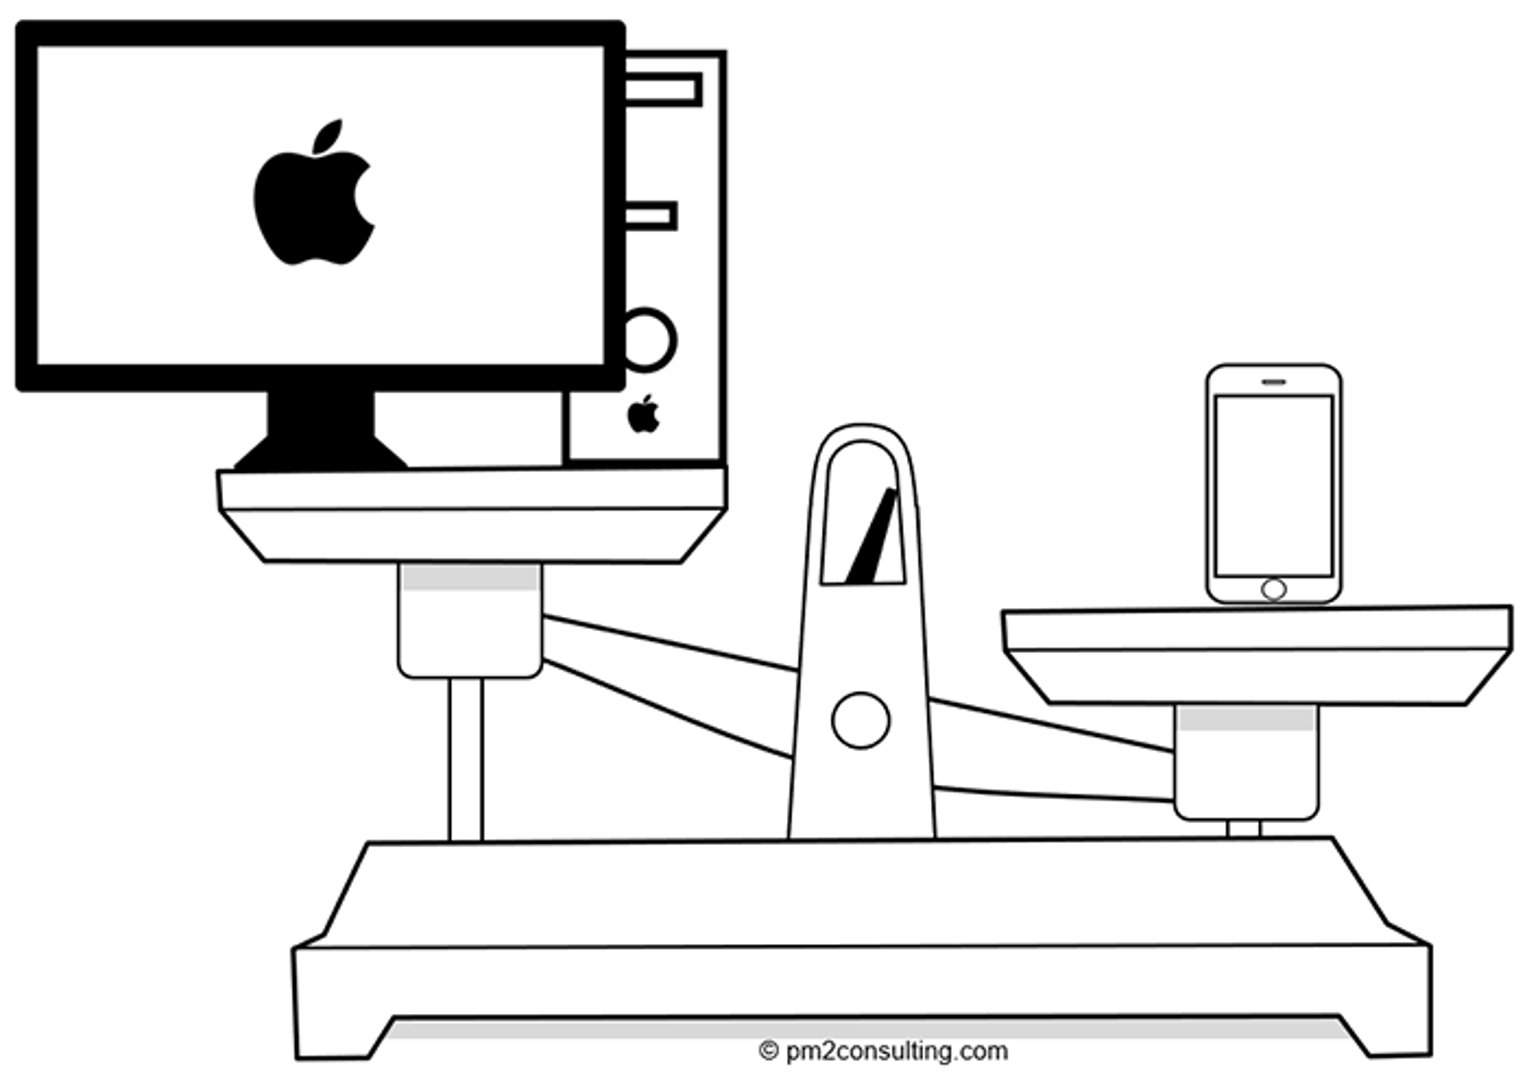
Apple demonstrated the power of this approach. The iPhone had every characteristic of the untested product: new market, unproven product, different customers, different technology. It had everything working against it. It succeeded, in part, because every employee kept the Apple strategy in mind as they went about their work.
Looking out the windshield, not the rear-view mirror
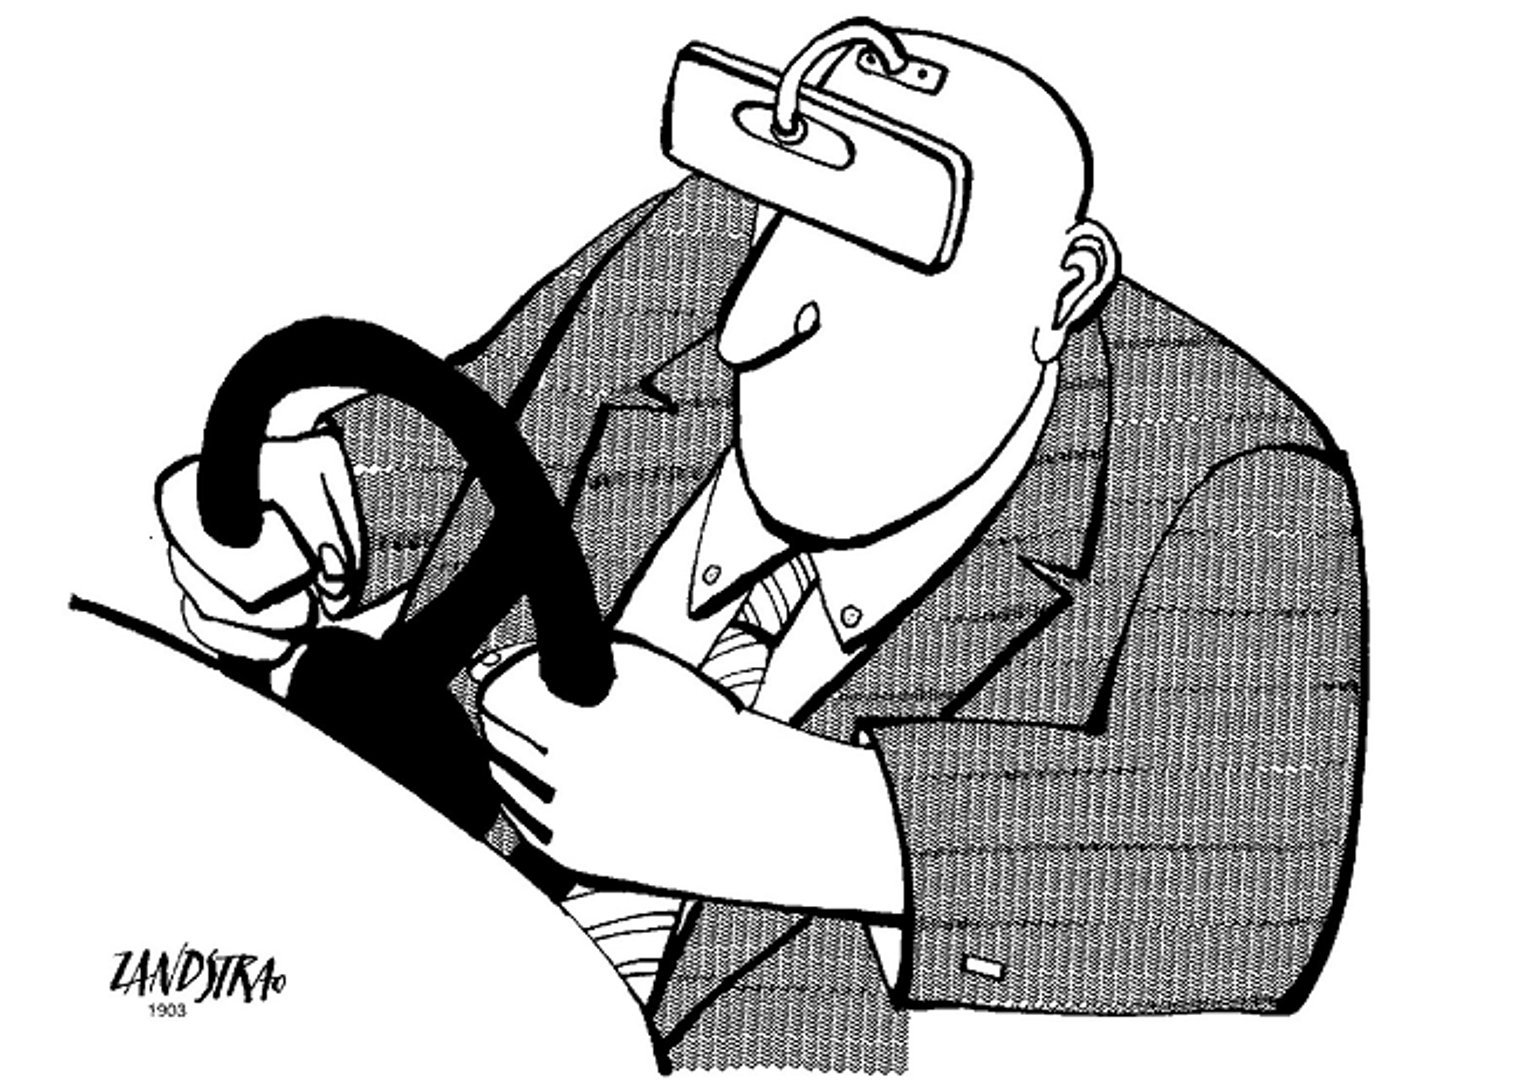
Managing a company on financials alone is like driving by looking in the rear-view mirror. It is actually worse than that — at least the rear-view mirror updates in real time. Financial reports are frozen in time. They are not just outdated; they are still photos.
What if the measures you tracked were not only real-time, but predictive? What if your dashboard could be instantly tailored for each viewer — so each person sees their own metrics rather than a generic executive summary? What if the data in your meeting reflected today, not the PowerPoint someone assembled a week ago when the meeting was scheduled?
New measures let you serve multiple stakeholders at different levels of complexity, including your own employees. The question is how to do that without building a different slide deck for every audience. The answer is role-specific dashboard views within your RTS dashboard. With data flowing in real time and the ability to customize each view for its audience, a slide deck starts to feel exactly like what it is: a still photo taken from the rear-view mirror.
About the RTS dashboard
The RTS dashboard could not have been built until recently. The data, the dashboard tools, and the devices to make them always available simply did not exist before.
The foundation of the RTS dashboard rests on three pillars:
- Real-time data flowing continuously from across the organization and beyond
- Strategic context that connects every metric to the goals that matter
- Accessibility — available your way, on any device, at any time
Fifteen universal measurement families form the core of the framework. This makes implementation straightforward — it is nearly an off-the-shelf approach that can be tailored through a simple diagnostic. RTS Dashboards vary by function, business, and maturity. A DevOps team measures Velocity through deployment frequency and change lead time; that approach does not translate directly to Human Resources.
In practice, around 20 modifications accommodate different functions, businesses, and maturity levels. A structured diagnostic helps determine which measures fit your situation best.
Benefits of the RTS dashboard
Clients have reported consistent gains across several dimensions. Here is what they tell us:
- Agility: With live data and role-specific views, everyone can anticipate and respond to internal or external change quickly.
- Alignment: Everyone sees the same data. Leadership communicates clearly. The era of 20 conflicting slide decks telling 20 different stories is over.
- Predictability: Real-time data dashboards enable real-time strategic decisions. Forecasts improve because they are built on current information, not last month's numbers.
- Wide ownership: When everyone works from the same tool, meetings become dramatically more efficient. Teams rarely want to return to the old way.
- OKRs: The biggest challenges in creating Objectives and Key Results are data access and shared visibility. An RTS dashboard addresses both — and shows how individual contributions connect to company strategy.
- Rewards: Live performance data removes the guesswork from recognizing and rewarding your team.
What to do now
Start by deciding that driving through the rear-view mirror is no longer acceptable. Take the diagnostic to identify what your company should actually be measuring. Find the right measures, build your dashboards, begin learning from the data, and keep improving.
About Pm2
Brett is an Executive Partner at Pm2 (Performance Measurement & Management), an international consulting firm specializing in the development and implementation of strategic dashboards and scorecards. Their frameworks include OKRs (Objectives and Key Results), Balanced Scorecard, 4DX (Four Disciplines of Execution), Lean, and Six Sigma. Their work has been featured in Harvard Business Review, Fortune, and Forbes, as well as numerous business books and periodicals. We are pleased to have this thought leader as an active contributor to our blog.
Related Articles

5 tips to understand (and organize) your restaurant data
By Saleem Khatri — June 9th, 2026
6 dashboards I use daily to run my SaaS company
By Allan Wille, Co-Founder — April 10th, 2026
Business Metrics vs. KPIs: What’s the Difference?
By Jonathan Taylor — March 13th, 2026
