Zapier
Connect Zapier to Klipfolio to build real-time dashboards from your automated workflows. Visualize data from thousands of apps without manual exports.
Track all your Zapier KPIs in one place
Sign up for free and start making decisions for your business with confidence.


Stop manually stitching together data from dozens of apps. When Zapier powers your workflows, Klipfolio turns those automated data streams into real-time dashboards that keep your whole team aligned.
What is a Zapier dashboard?
A Zapier dashboard is a live reporting view that pulls data from your Zapier-connected apps into a single display, so you can monitor key metrics without switching between tools or exporting files manually.
How to build a Zapier dashboard
Zapier connects thousands of apps through automated workflows called Zaps. Klipfolio taps into those Zaps to surface your data as visual, real-time metrics.
- Create your Zap in Zapier. Set up a Zap that sends data from your source app (e.g., a CRM, form tool, or e-commerce platform) to a destination Klipfolio can read, such as a Google Sheet or webhook.
- Connect Zapier to Klipfolio. Use Klipfolio's Zapier connector to link your Zap output to a new or existing dashboard. Learn how to connect Zapier to Klipfolio.
- Select your metrics. Choose which data points from your Zap you want to display, such as lead counts, form submissions, or order totals.
- Build and customize your dashboard. Use Klipfolio's layout tools, formula functions, and visualization types to present your data the way your team needs to see it.
View the step-by-step setup guide
Top reasons to use Klipfolio for Zapier dashboards
Here's what you gain by connecting Zapier to Klipfolio:
Real-time visibility across all your apps. Because Zapier connects thousands of tools, Klipfolio can surface data from virtually any source, all in one dashboard.
No more manual exports. Your Zaps push data automatically, so your dashboard stays current without any copy-pasting or file downloads.
Combine data from multiple Zaps. Merge metrics from different workflows, such as sales, marketing, and support, into a single view for cross-functional reporting.
Flexible customization. Use Excel-like formulas, 30+ visualization types, and custom layouts to build dashboards that match your reporting needs exactly.
Distribute to your whole team. Share dashboards via TV mode, public links, scheduled PDF emails, or embedded views, so everyone sees the same data.
From Zapier to dashboard: what changes
| What you do in Zapier | What Klipfolio adds |
|---|---|
| Build Zaps that move data between apps | A live dashboard that visualizes that data in real time |
| Trigger actions when events occur | Automatic metric updates every 1 minute to 24 hours |
| Manage workflows across dozens of tools | A single reporting view that consolidates all your Zap outputs |
| Export data manually for reporting | Scheduled reports and always-on dashboards with no manual work |
Stop manual reporting. Start automating your dashboards with Klipfolio and Zapier.
Use pre-built Zapier metrics
Assemble a Zapier dashboard by selecting pre-built metrics from the Klip Gallery.
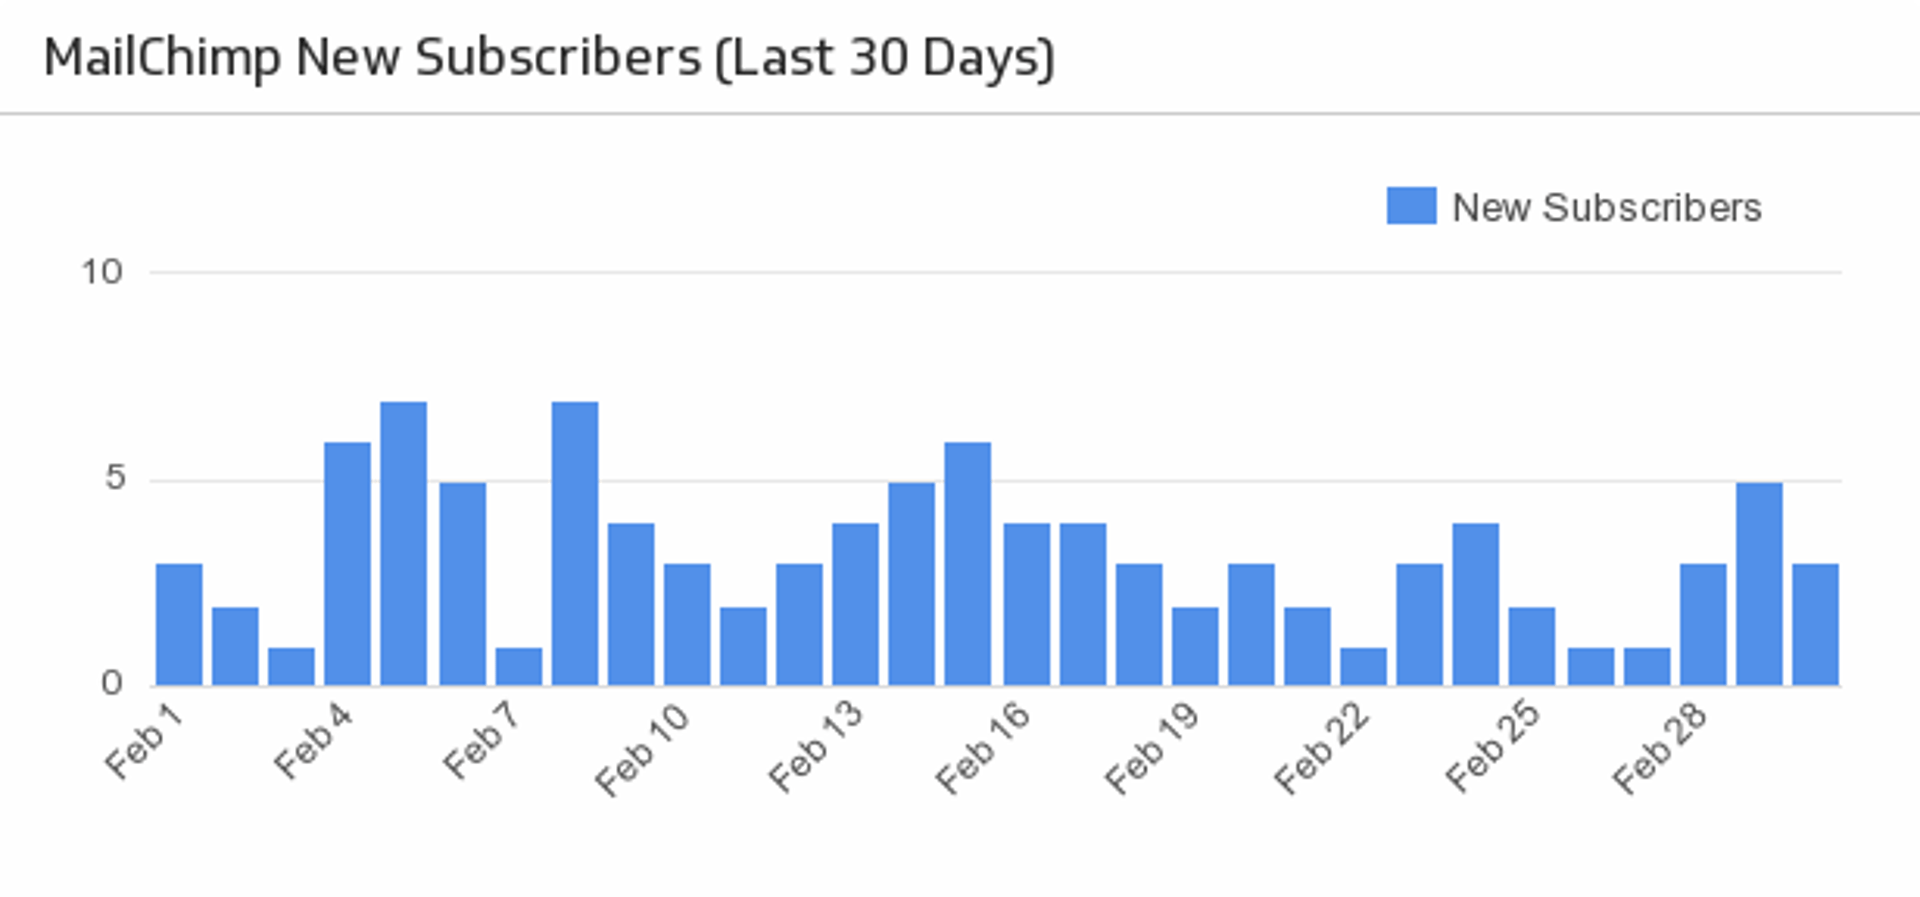
MailChimp New Subscribers
Make sure your MailChimp email campaigns are fruitful with a handy bar chart monitoring the daily number of new subscribers over the past month.
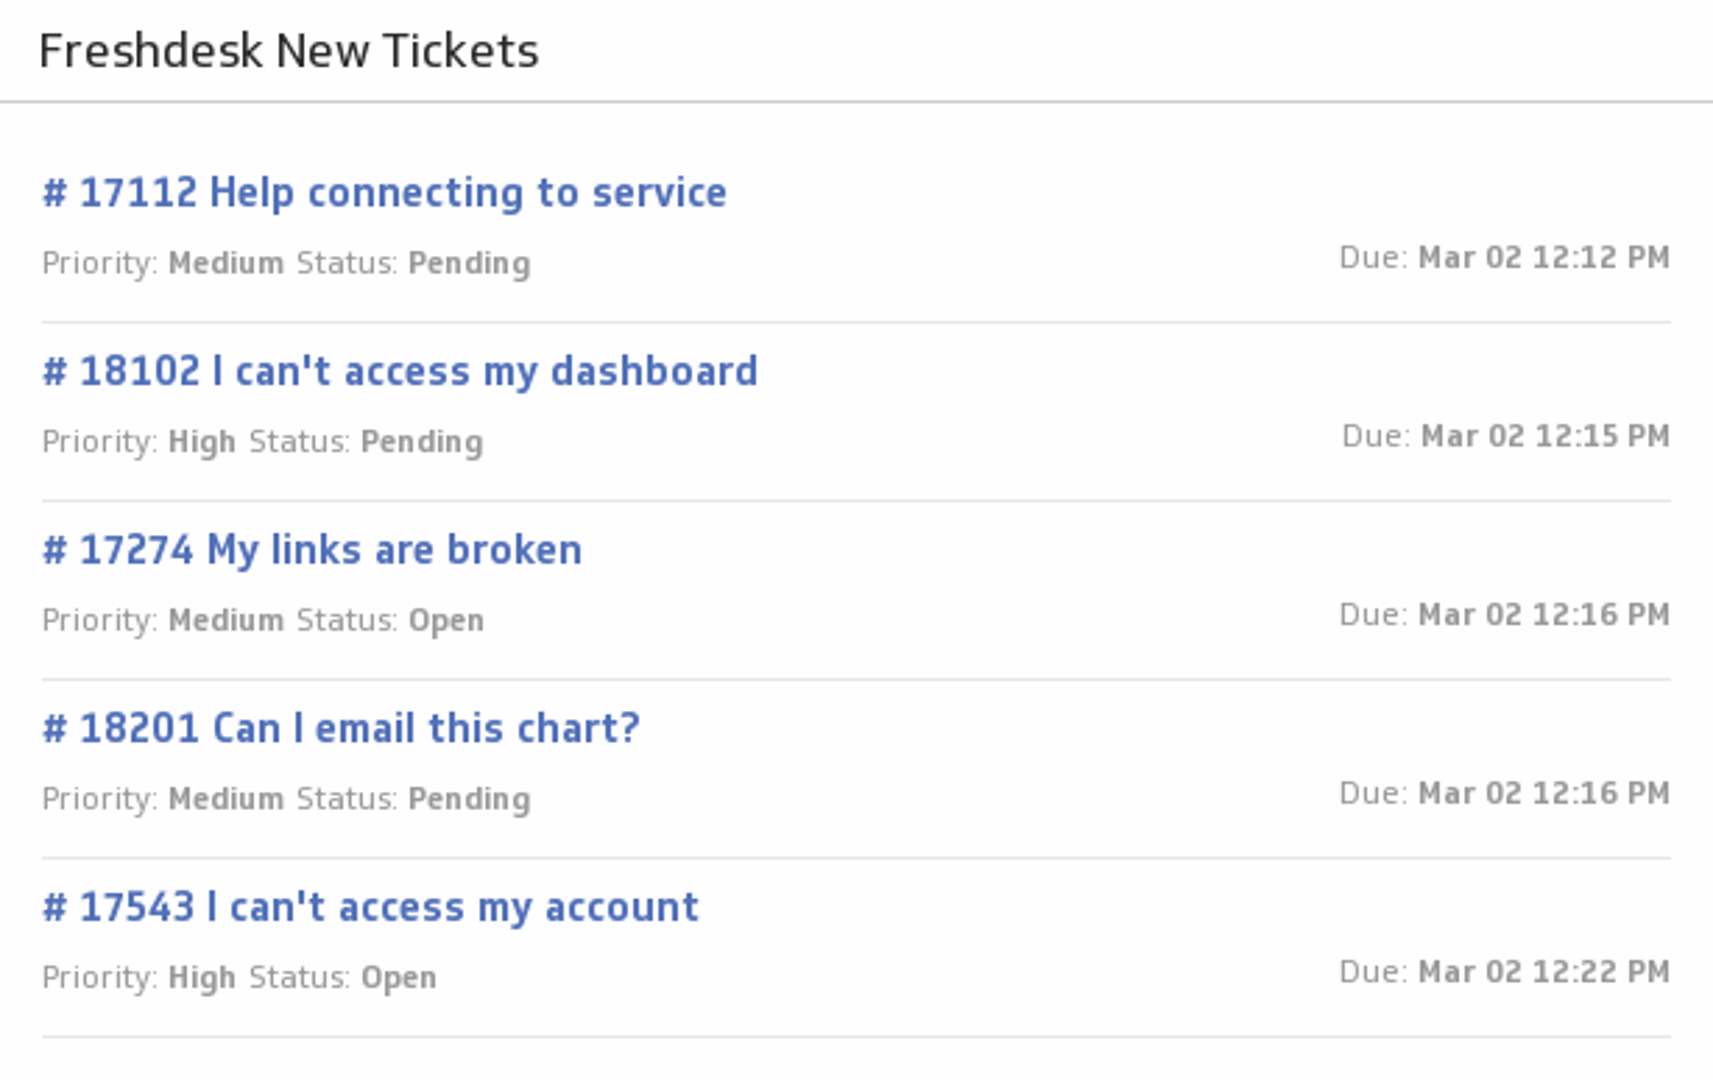
Freshdesk New Tickets
Be the best customer support team you can be! Add a list of your latest Freshdesk tickets to your dashboard, and track their status and priority levels.
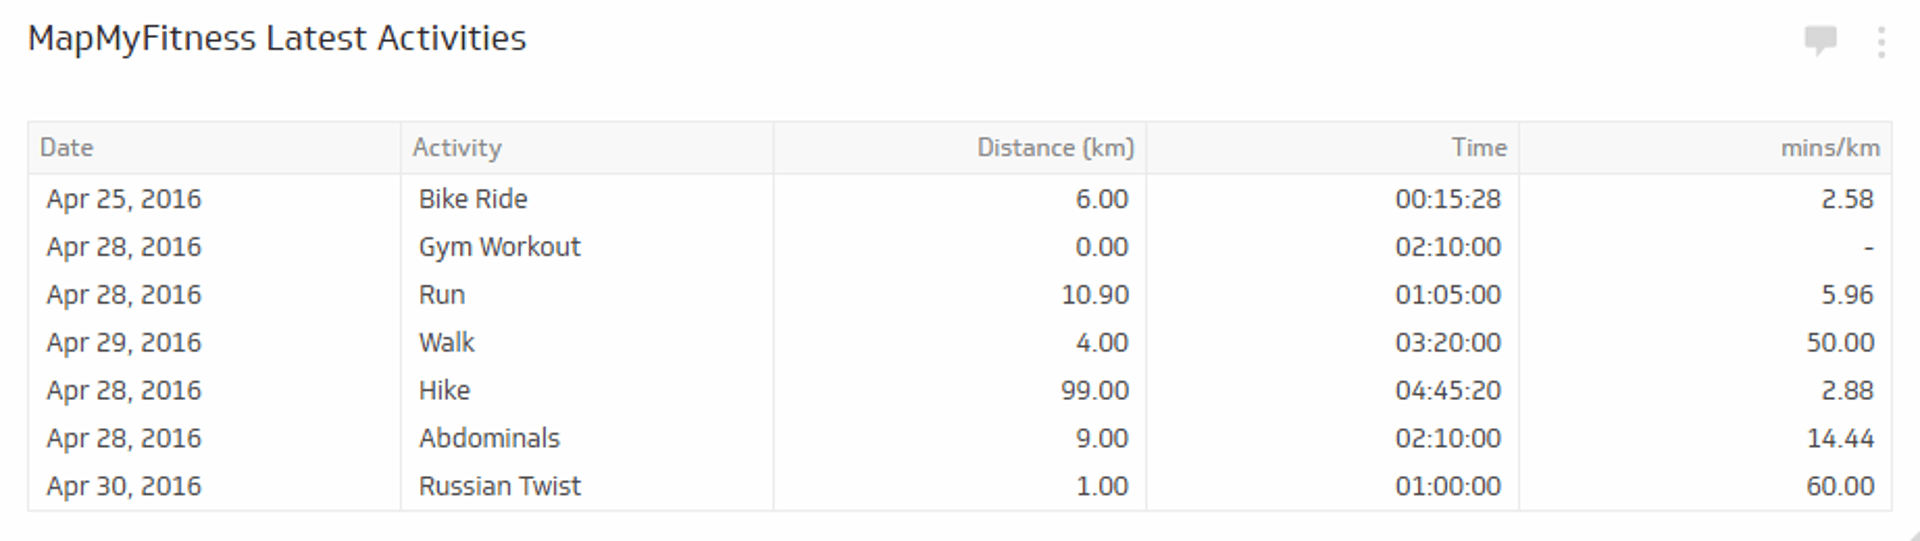
MapMyFitness Latest Activities
Keep track of all your workouts in one integrated Klip with this MapMyFitness-Klipfolio Zap.
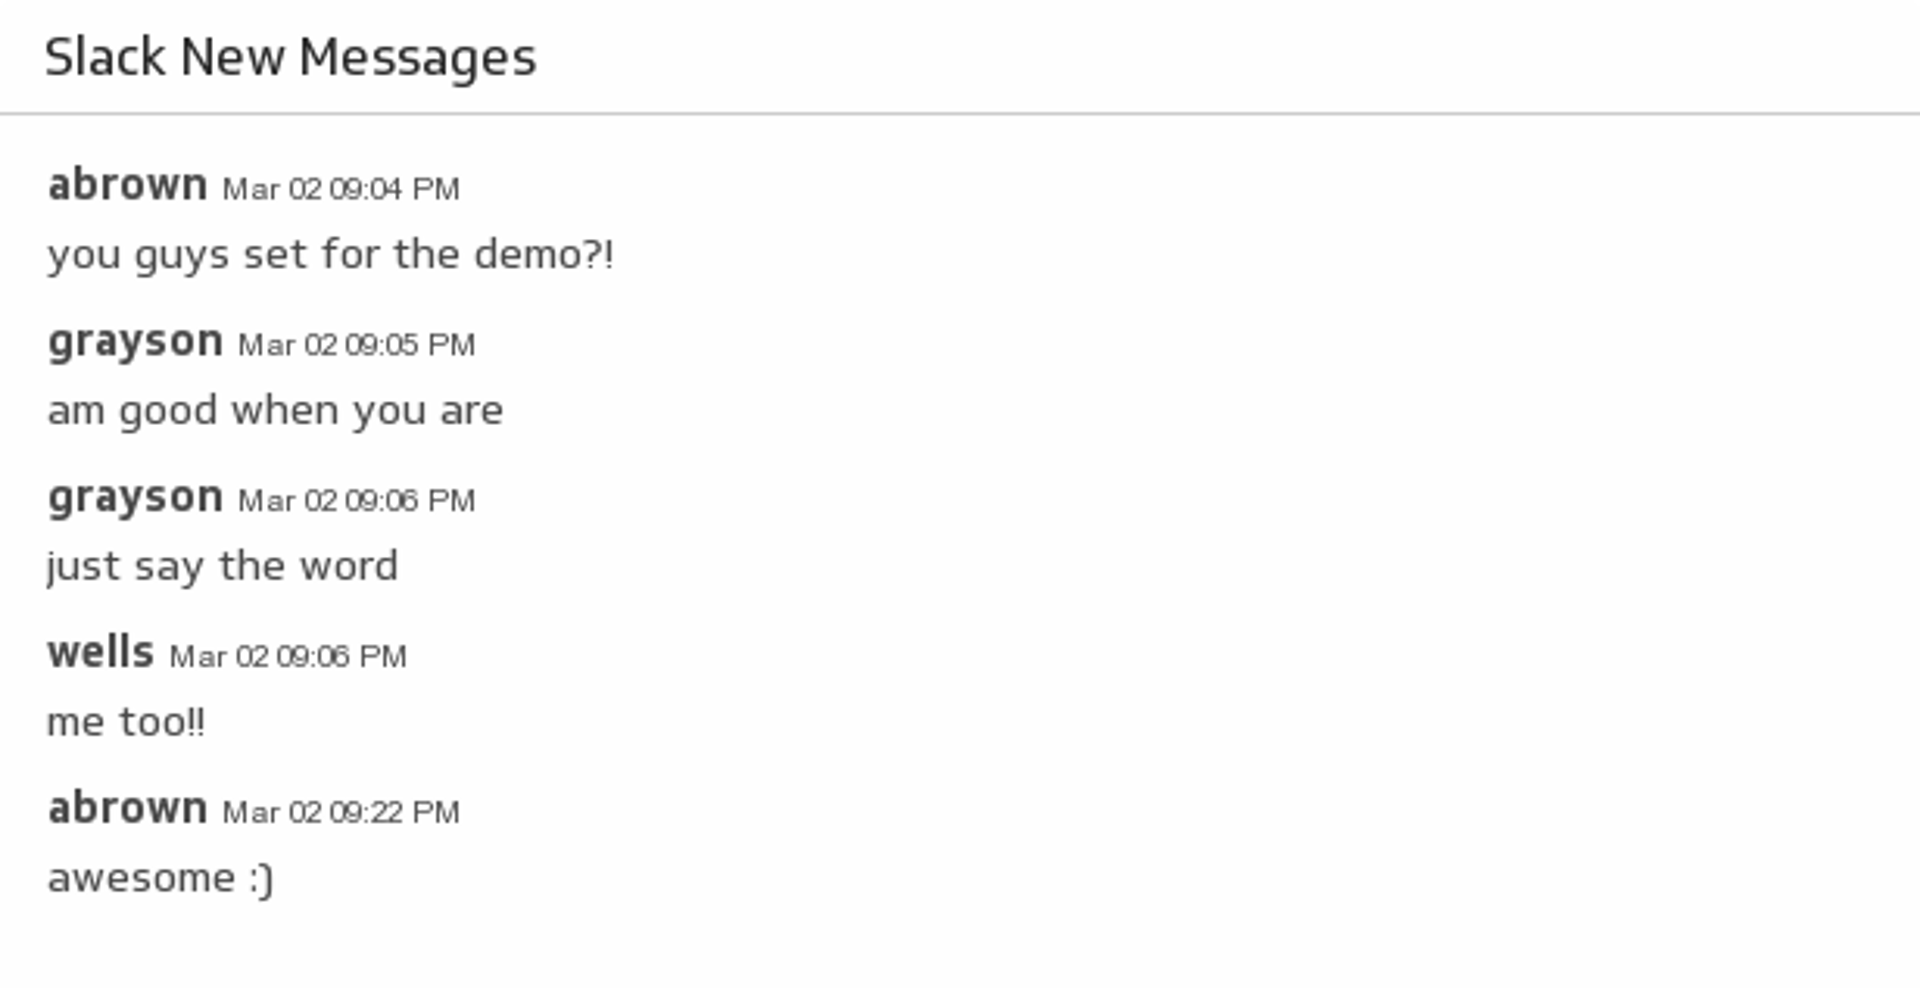
New Messages
Make it easy to see the conversations on your favourite Slack channel by adding it to your dashboard.


Use the Connector Gallery to create a custom Zapier dashboard
With our Connector Gallery, you can create custom API queries to pull in data from your Zapier account. Building custom queries allows you to specify the metrics and time periods that you want to track.
You can use custom queries to build out visualizations in Klipfolio. You can also combine your Zapier data with other relevant data to create your custom dashboard.
Learn more about working with the Zapier API and how you can start building your own Zapier queries in Klipfolio.
