Callback Messaging Metric
Track the number of callers leaving messages requesting a callback instead of waiting on hold.
Track all your Call Center KPIs in one place
Sign up for free and start making decisions for your business with confidence.
Overview
Callback messaging occurs when a caller leaves their contact information with a message requesting a callback instead of waiting on hold or in a queue. This metric tracks the volume of callback messages your call centre receives, helping you understand caller preferences and queue management effectiveness.
Understanding callback messaging is essential for call centres that want to balance customer convenience with operational efficiency. When callers opt for a callback rather than waiting, it signals either high hold times or a preference for asynchronous communication. By monitoring this metric, you gain insight into caller behaviour and can adjust staffing, queue management, and callback protocols to improve both customer satisfaction and agent productivity.
Why callback messaging matters
Callback messaging serves as a proxy for queue health and customer patience. A high volume of callback requests may indicate:
- Long wait times that frustrate callers
- Inadequate staffing during peak periods
- Customer preference for flexibility over immediate connection
- Operational inefficiency in call routing or queue management
By tracking this metric, call centre managers can identify bottlenecks, adjust resources proactively, and reduce abandoned calls. Additionally, callback messaging data helps you evaluate whether your current staffing model meets customer demand or whether investment in additional agents or technology is needed.
How to calculate callback messaging
Formula: Number of callback messages received during a specific period (typically daily)
Calculation example:
- Monday: 8 callback messages
- Tuesday: 12 callback messages
- Wednesday: 6 callback messages
- Weekly total: 26 callback messages
Most modern call centre software automatically logs callback requests, making this metric straightforward to extract from your phone system or customer relationship management (CRM) platform.
Reporting frequency and targets
Reporting frequency: Daily or weekly, depending on call volume
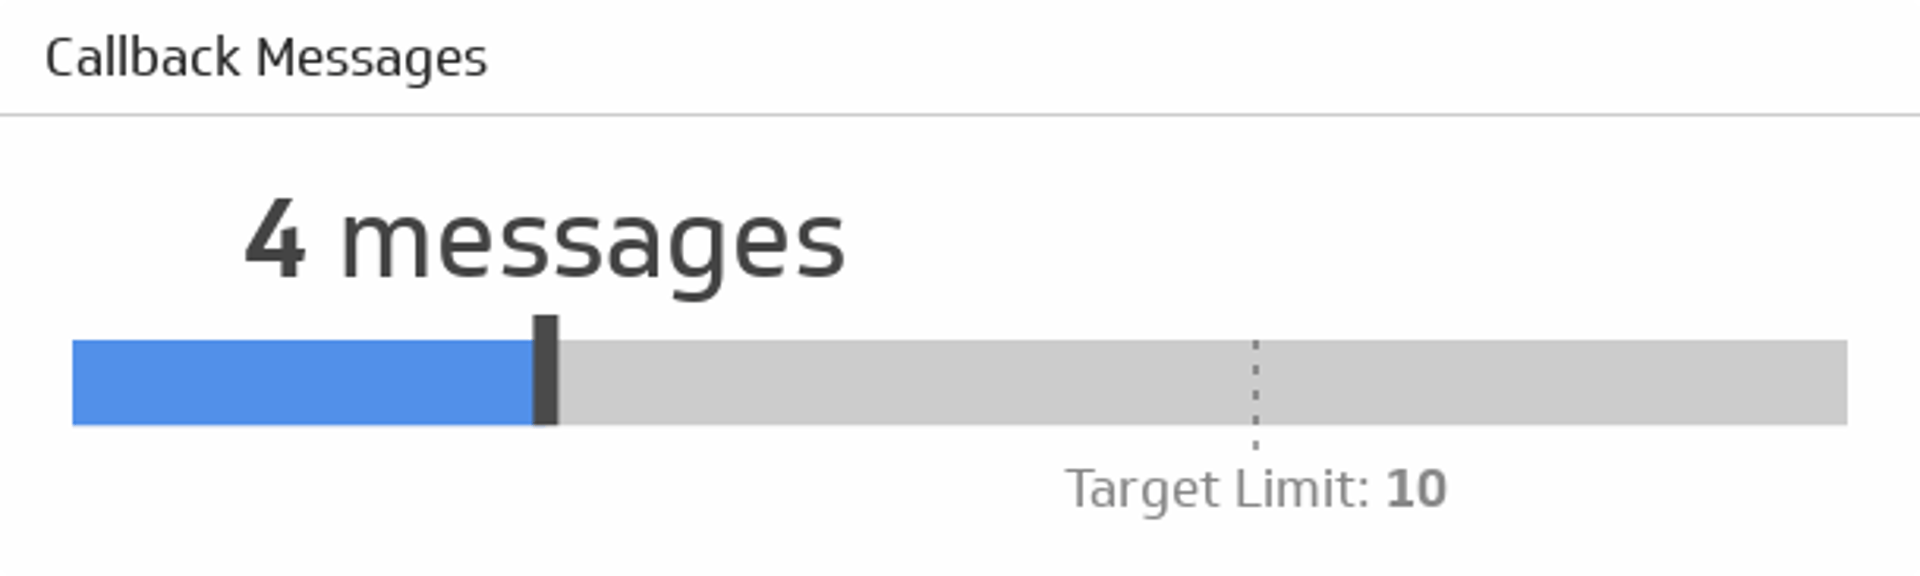
Example KPI target: 4–10 messages per day (varies by centre size and industry)
Benchmark context: Callback message volume depends heavily on your call centre's size, industry, and service model. A small legal firm might receive 2–5 callbacks daily, while a large financial services centre might see 50+. Compare your baseline against your own historical trends rather than industry averages.
Who should monitor this metric
Primary audience: Call centre managers and supervisors
Secondary stakeholders:
- Workforce planning teams (to forecast staffing needs)
- Customer service directors (to assess service quality)
- Operations teams (to optimise queue management)
- Finance teams (to evaluate efficiency and cost-per-resolution)
Related variations and metrics
Variations of callback messaging:
- Messages requesting a callback
- Callback requests by time of day
- Callback abandonment rate (callbacks requested but never completed)
- Average callback wait time (time between request and agent callback)
Related metrics to track alongside callback messaging:
- Abandoned call rate: Percentage of calls disconnected before reaching an agent
- Average wait time: How long callers wait before reaching an agent or choosing callback
- Service level: Percentage of calls answered within a target timeframe
- First contact resolution: Percentage of issues resolved on the first call
- Customer satisfaction (CSAT): Post-call satisfaction scores
How to reduce callback messaging
If your callback message volume is higher than target, consider these strategies:
- Increase staffing during peak call times
- Implement callback technology that automatically calls customers when an agent becomes available
- Improve call routing to reduce wait times
- Train agents to resolve issues faster and improve first contact resolution
- Offer alternative channels (chat, email, self-service) to reduce phone volume
- Analyse callback patterns to identify peak periods and adjust schedules accordingly
Tracking callback messaging in your dashboard
To monitor callback messaging effectively, use a dashboard that connects to your call centre system—whether that's your phone system, CRM, or contact centre platform. Visualise callback trends over time with line charts, compare daily or weekly targets with actual performance, and segment data by agent, team, or time period.
A well-designed callback messaging dashboard helps you spot trends quickly, respond to queue issues in real time, and make data-driven decisions about staffing and resource allocation. By centralising this metric alongside related KPIs like service level and abandoned call rate, you gain a complete picture of call centre health and customer experience.
Related Metrics & KPIs