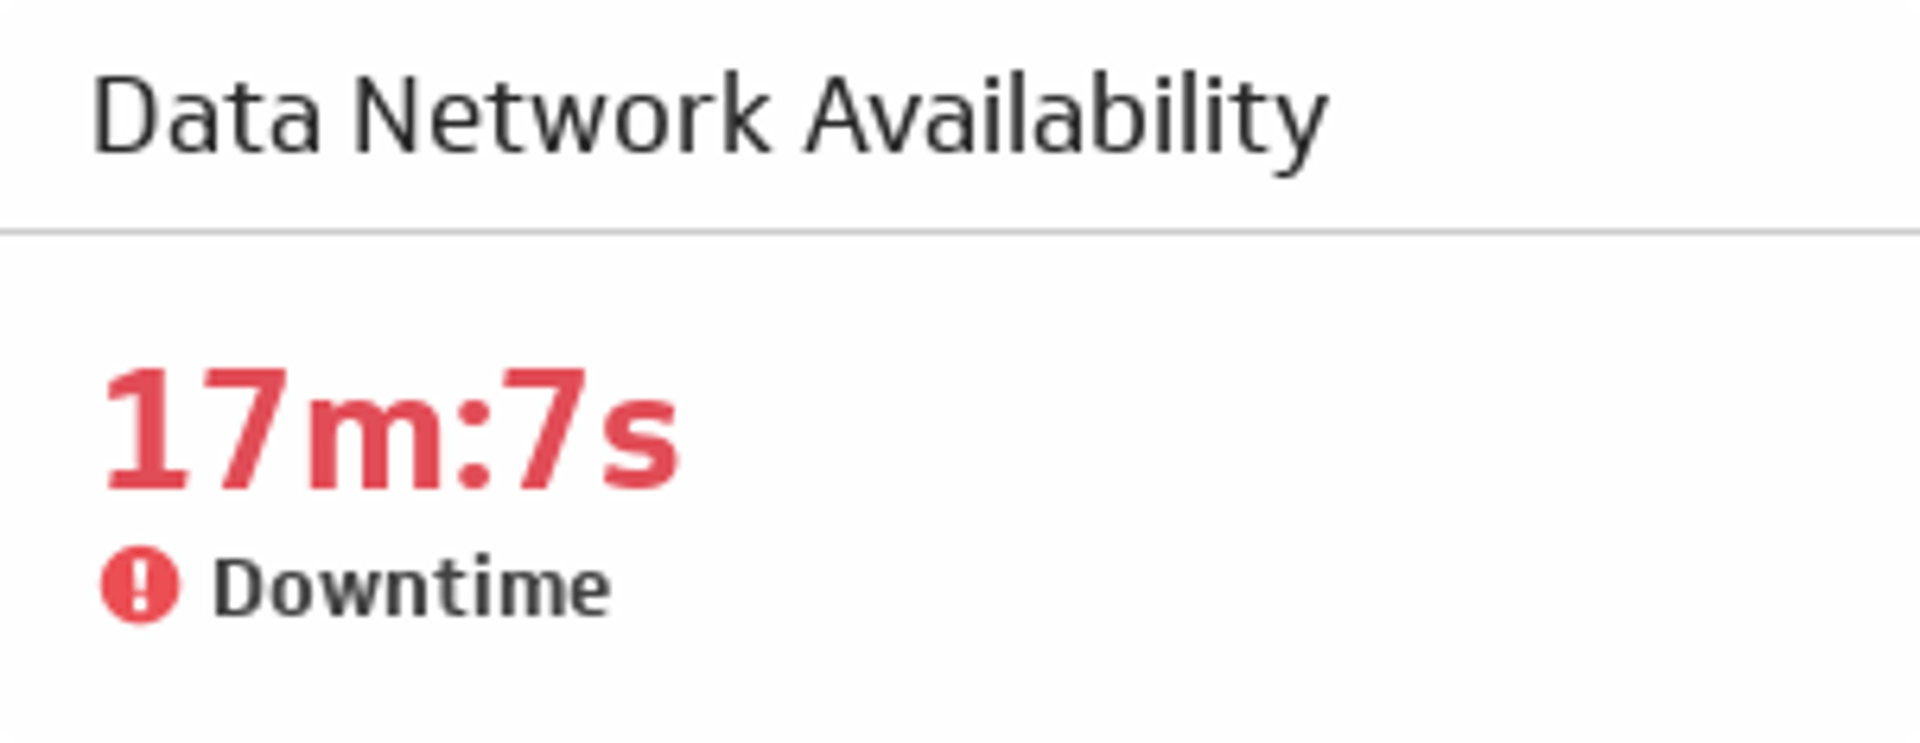
Data Network Availability Metric
Measure the amount of time your data network is available for access.
Track all your Call Center KPIs in one place
Sign up for free and start making decisions for your business with confidence.
Overview
Your data network may not be supported at all times. The Data Network Availability metric helps your team monitor the share of time that your data network is actually available.
Formula
(Hours that the data network is available/Total number of hours the network is supported for)x100
Reporting frequency
Weekly
Example of KPI target
100% uptime
Audience
IT Manager
Variations
Availability of data network
Network data availability
Why this KPI matters
Availability affects revenue, productivity, and customer trust. One outage can ripple across teams and regions. Tracking this metric shines a light on fragile systems and justifies investments in resilience.
How to calculate it correctly
- Define supported hours. Include planned service hours. Exclude planned maintenance windows if you do not consider them downtime.
- Sum uptime. Use monitoring data to count minutes available during supported hours.
- Compute availability. Availability (%) = Uptime minutes / Supported minutes x 100.
- Segment by region and service. A single global rate hides local pain.
Related reliability metrics
- Mean time between failures (MTBF)
- Mean time to resolve (MTTR)
- Change failure rate
Improve availability
- Eliminate single points of failure. Add redundancy where it matters most.
- Instrument everything. Collect logs, metrics, and traces for faster diagnosis.
- Practice incident response. Run drills, improve runbooks, and shorten handoffs.
- Stage changes. Ship in smaller steps and watch error rates closely.
Track network availability in Klips
- Connect monitoring. Pull uptime and incident data from your monitoring tools.
- Model calculations. Compute availability by service, region, and time window.
- Visualize. A single-value Klip for current availability, a time-series for daily uptime, and a table of recent incidents.
- Set thresholds. Colour rules flag services below your SLO.
- Share. Send a weekly reliability report to engineering and operations.
Common pitfalls
- Counting planned maintenance as downtime. Be consistent in definitions and communicate them.
- Relying on a single probe. One check can miss partial outages. Use multiple vantage points.
- Ignoring user impact. Pair availability with latency and error rate to capture real experience.
Track this KPI in Klips. Build a live dashboard that updates in real time, shares easily, and keeps your team aligned.
Related Metrics & KPIs