Engagement Rate
Video Engagement Rate measures how actively viewers interact with your content, expressed as a percentage of total views, reach, or impressions that result in a meaningful action.
Video Engagement Rate
Engagement Rate measures how actively an audience interacts with your content, expressed as a percentage of total views, reach, or impressions that result in a meaningful action.
Video content is one of the highest-engagement formats in digital marketing. 83% of video content consumers say they would share a video that aligns with their interests, which means every interaction has the potential to extend your reach without additional spend.
For marketers and business leaders, Video Engagement Rate is a signal worth watching closely. It tells you whether your content is earning attention or just collecting views, and it gives you a clear basis for deciding what to keep, cut, or change.
What is Video Engagement Rate?
Video Engagement Rate is the percentage of viewers who take a meaningful action after watching a video, such as liking, sharing, commenting, clicking a link, or subscribing. It measures active participation, not passive viewing.
Viewer count tells you how many people watched. Engagement Rate tells you how many of them cared enough to do something about it. That distinction matters when you are making decisions about content strategy and budget.
Who tracks this metric?
Marketing teams, content strategists, and business owners use Video Engagement Rate to assess whether their content is connecting with the right audience.
It is especially relevant for anyone running video campaigns across platforms like YouTube, TikTok, LinkedIn, or Instagram, where algorithmic reach is tied directly to engagement performance. The higher your Engagement Rate, the more the platform surfaces your content to new viewers organically.
Why does it matter?
A high Engagement Rate signals that your content is resonating. A low one signals a gap between what you are publishing and what your audience actually wants.
Beyond surface-level performance, Video Engagement Rate helps you:
- Gauge content quality by seeing where viewers drop off or respond
- Predict retention by understanding how much of your message audiences are absorbing
- Inform future decisions about format, length, topic, and distribution channel
If you are waiting for someone to pull these numbers for you, or piecing them together from platform dashboards manually, you are already a step behind. The teams that act fastest on this data are the ones who have it in one place, updated automatically.
How to calculate Video Engagement Rate
There are several ways to calculate Engagement Rate, and different platforms use different formulas. The right method depends on what you are measuring and why.
Simple engagement formula
The most common approach divides total engagements by total views:
Engagement Rate = (Total Engagements / Total Views) × 100
For example, if a video receives 10,000 views and 4,000 viewers share, like, or comment, the Engagement Rate is 40%.
Engagements typically include:
- Likes and reactions
- Shares and reposts
- Comments
- Clicks on embedded links
- Follows or subscriptions triggered by the video
Reach-based formula
Some platforms calculate Engagement Rate against reach rather than views:
Engagement Rate = (Total Engagements / Reach) × 100
This version is more precise when a single viewer might account for multiple views.
Video engagement graphs
Platforms like YouTube, TikTok, and Wistia provide engagement graphs that show retention across the full length of a video. These graphs divide the video into three zones:
- The nose: The first few seconds, where most drop-off happens
- The body: The middle section, where sustained attention is measured
- The tail: The closing seconds, reached only by the most engaged viewers
A sharp drop at the nose means your hook is not working. A gradual decline through the body is normal. If viewers are making it to the tail, your content is doing its job.
Factors that affect Video Engagement Rate
Several variables shape how audiences respond to video content. Understanding them helps you diagnose low engagement and make targeted improvements.
Length
Shorter videos generally produce higher engagement because they ask less of the viewer. Longer videos can sustain attention when the audience has a strong reason to stay, such as educational content or in-depth product walkthroughs. Match length to audience expectation and content purpose.
Create custom dashboards for you and your team.
Get started with KlipsQuality
Research confirms that production quality directly affects engagement. Audiences have come to expect clear visuals and professional presentation. Poor resolution or shaky footage signals low effort, and viewers respond accordingly.
Audio
Bad audio drives viewers away faster than bad video. If your content has sound, make sure it is clean and clear. If your audience expects a silent video, background noise is a distraction. Set expectations early and deliver on them.
Relevance to your audience
Content that speaks directly to your audience's interests, questions, or challenges earns more engagement than content that is broadly targeted. Relevance is not just about topic. It includes tone, format, and timing. Capitalizing on trends can boost relevance quickly, but only when the connection to your brand feels genuine.
How to improve Video Engagement Rate
Once you know where your engagement is falling short, these practices give you the clearest path to improvement.
Edit tightly
Remove anything that does not serve the central message. Every extra second is an opportunity for a viewer to click away. Tight editing signals respect for your audience's time, and audiences respond to that.
Hook viewers in the first few seconds
Research shows that the opening seconds determine whether a viewer stays or leaves. Lead with something that earns attention: a surprising fact, a direct question, or a bold claim. Save the context for after you have them.
Place calls to action strategically
If engagement is low, your calls to action may be missing, buried, or mistimed. Test different placements based on where your engagement graph shows drop-off. A call to action just before a peak retention moment often outperforms one placed at the end.
Personalize your content
Generic content produces generic results. The more specifically your video speaks to your audience's situation, the more likely they are to engage. Research your audience, study what your competitors are doing, and find the angle that only you can own.
Use music deliberately
Audio shapes how viewers feel about your content. A well-chosen soundtrack can increase emotional connection and make your brand more memorable. Choose music that fits the tone of the content and the expectations of your audience.
Tracking Video Engagement Rate with a dashboard
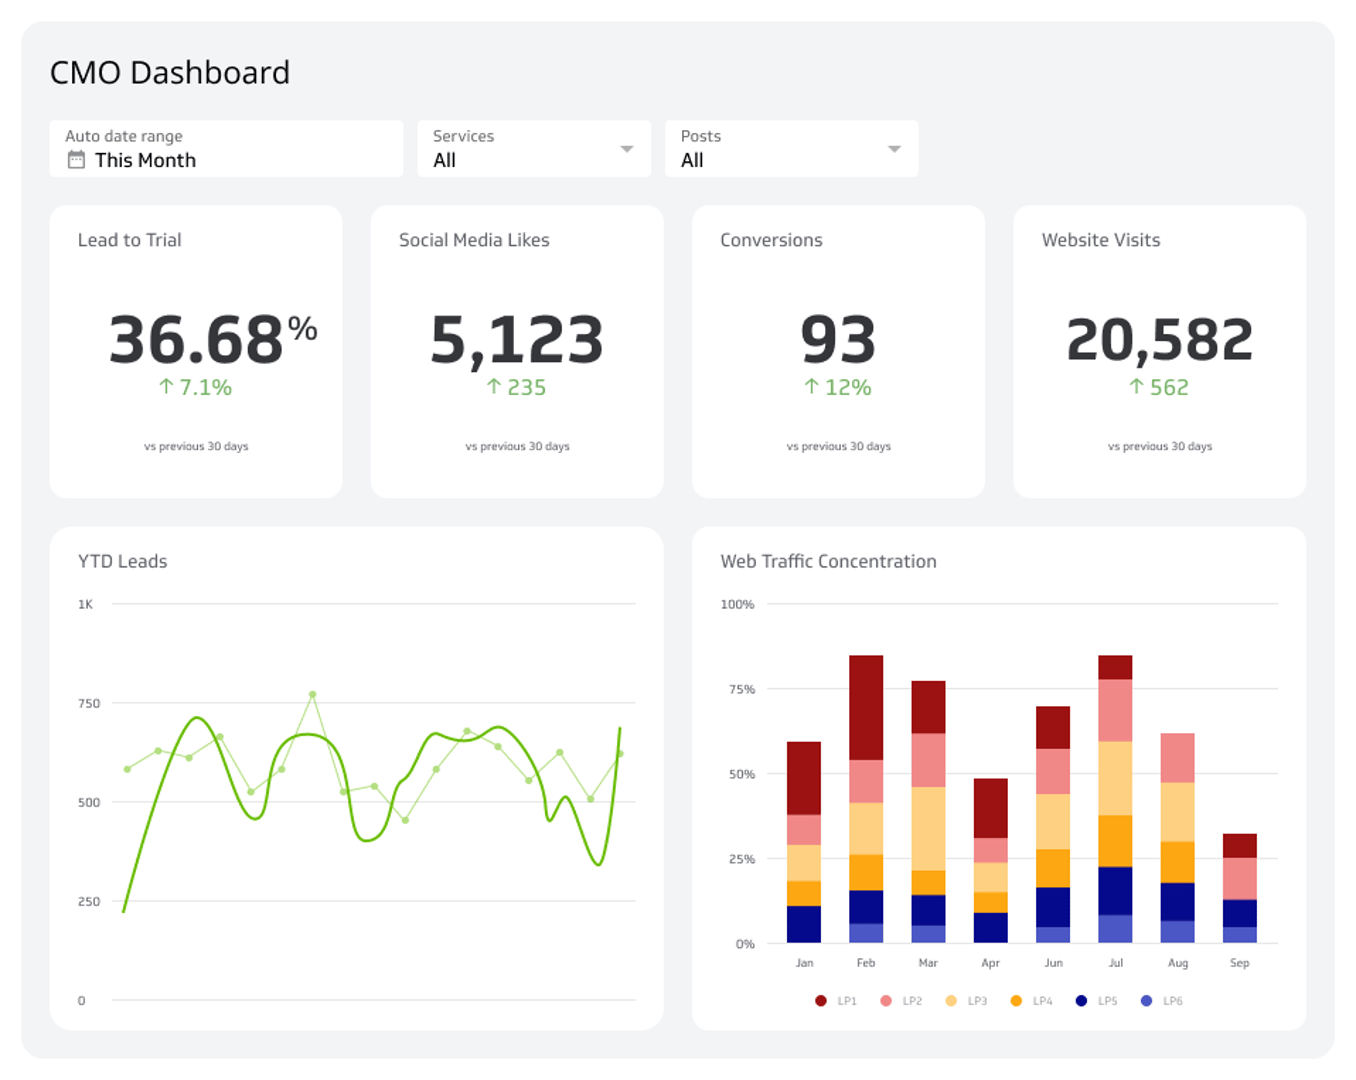
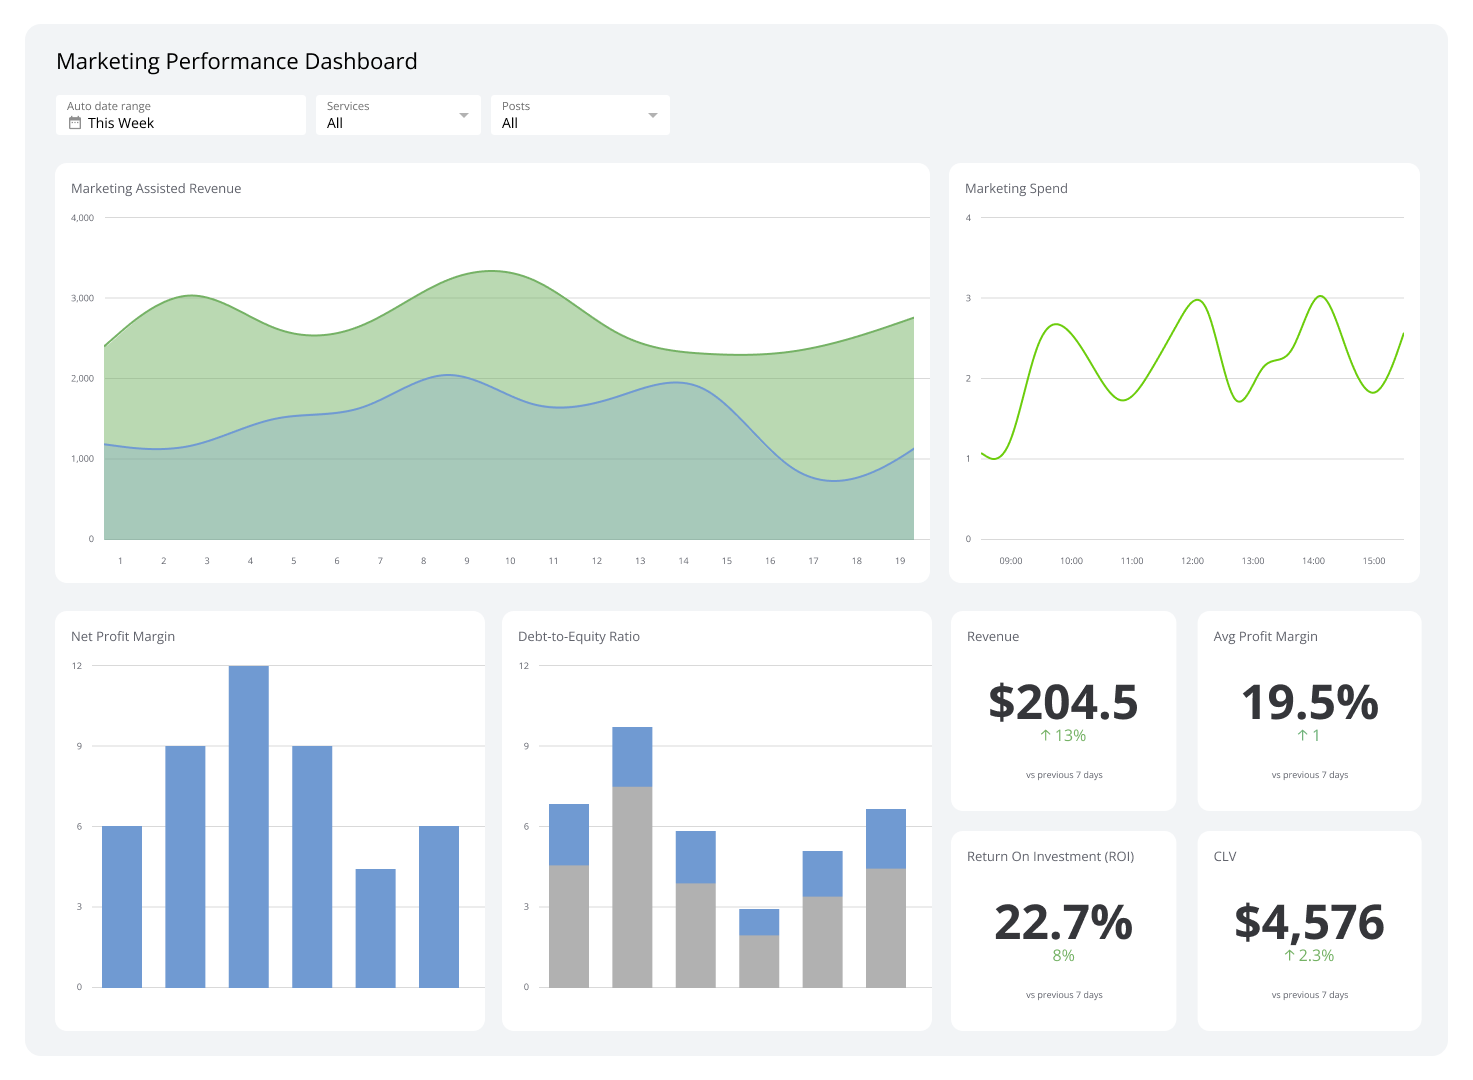
Checking Engagement Rate platform by platform is slow and easy to misread. A digital marketing metric dashboard pulls your video performance data into one view, keeps it current, and makes it easy to spot trends across channels without waiting for someone to compile a report.
With Klips, you can connect your video platforms, set automatic refresh rates, and share performance data with your team in real time. That means less time hunting for numbers and more time acting on them.
Create custom dashboards for you and your team.
Get started with KlipsWhat a good Engagement Rate tells you
A strong Video Engagement Rate confirms that your content is reaching the right people and giving them a reason to respond. It is one of the clearest signals that your message is landing.
A weak rate is not a verdict. It is a prompt. Use your engagement graph to find where viewers are leaving, test a stronger hook, tighten your edit, and check whether your content is actually relevant to the audience you are reaching.
The teams that improve fastest are the ones who treat Engagement Rate as a decision-making tool, not just a reporting number.