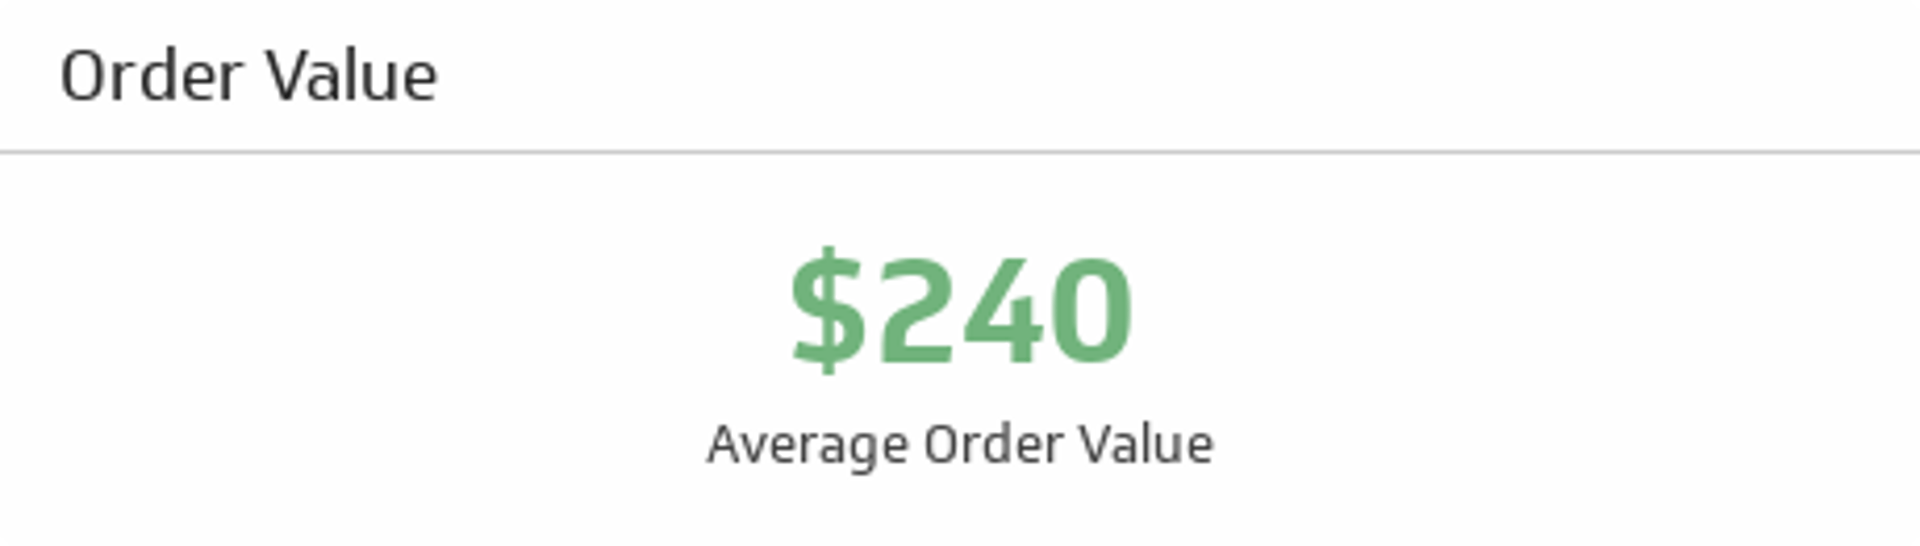
Average Order Value (AOV)
Measure the average value of orders from your customers.
Track all your Ecommerce KPIs in one place
Sign up for free and start making decisions for your business with confidence.
What is Average Order Value (AOV)?
Average Order Value (AOV) measures the average amount a customer spends each time an order is placed. It helps you understand the value of each transaction and where pricing, merchandising, and promotions are lifting or lowering revenue. Put simply, AOV connects your store’s traffic and conversion efforts to the dollars that come through with every checkout.
Formula
AOV = Total revenue from orders ÷ Number of orders
Decide what “revenue” includes before you calculate. Most teams exclude taxes, shipping, and refunds so the value reflects what customers actually spend on products. If you operate internationally, convert to a single currency first.
Reporting frequency
Daily for trading visibility, then weekly and monthly for trend analysis. Use the same definition across cadences so results stay comparable.
Example KPI target
$250 per order
Example calculation
Imagine your store processed 1,200 orders last month. Product revenue (excluding taxes, shipping, and refunds) was $276,000.
- Total revenue: $276,000
- Number of orders: 1,200
AOV = 276,000 ÷ 1,200 = $230
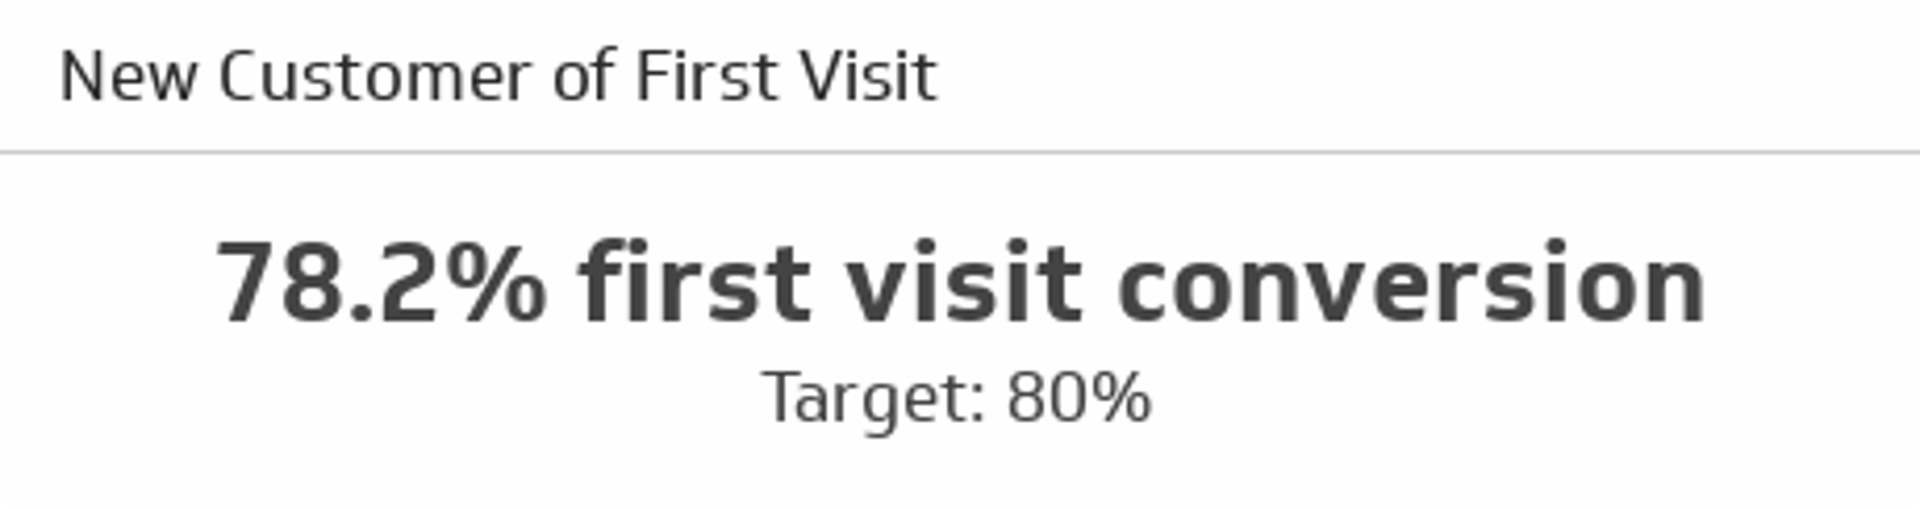
Segmenting sharpens the picture. If returning customers placed 400 of those orders and generated $120,000, returning-customer AOV would be $300. New-customer AOV for the remaining 800 orders would be $156, which suggests an onboarding or offer strategy opportunity.
Why AOV matters
- Revenue leverage: A small AOV lift multiplies across every order. A $10 increase on 50,000 yearly orders is $500,000 in added sales before considering margin.
- Unit economics clarity: AOV works with conversion rate and traffic to explain sales. Revenue - Sessions × Conversion Rate × AOV.
- Merchandising signal: Bundles, price points, and featured items show up quickly in AOV trend lines.
- Promotion guardrails: Discounts might raise AOV while eroding margin. Track AOV with average selling price and gross margin so you grow profit, not just cart totals.
How to calculate AOV correctly
- Stay consistent: Use the same revenue definition across reports. Document whether you exclude taxes, shipping, and returns.
- Remove noise: Exclude test orders and staff orders. Handle cancelled and returned orders in the same period you recognise revenue.
- Unify currency: Convert revenue into a single reporting currency before you divide by orders.
- Watch out for outliers: Very large bulk orders can spike AOV. Use medians or winsorised averages for a second view if necessary.
Benchmarks and context
Benchmarks vary by category, catalogue depth, price architecture, and region. High-ticket categories (electronics, furniture) usually post higher AOV than fast-moving consumer goods. New stores often start with lower AOV as assortments are lean and returning-customer share is small. Mature stores lift AOV through better cross-sell, loyalty programs, and free?shipping thresholds. Compare yourself to close peers and focus on your own trend line first.
How to raise AOV without hurting margin
- Smart thresholds: Offer free shipping or a gift with purchase above a tested threshold that preserves contribution margin.
- Bundles and kits: Package items that solve a complete job. Price the bundle for value while protecting blended margin.
- Cross?sell in cart: Recommend add?ons that match the primary item, not generic best?sellers.
- Tiered pricing: Use volume breaks for B2B and wholesale segments where larger baskets make sense.
- Payment choices: Offer buy?now?pay?later and digital wallets to reduce friction on bigger baskets.
- Loyalty and perks: Give members early access, points multipliers, or exclusive bundles that encourage fuller baskets.
- Content and comparison: Use comparison charts and visual size guides to raise confidence in higher?value options.
Test each tactic. Pair AOV with margin per order and return rate so you scale what creates durable value.
How to monitor AOV in a dashboard
Track AOV in Klips with connected data from your commerce platform and order system. Helpful views include:
- AOV trend: 7, 30, and 90?day views with a same?period last year line.
- AOV by channel: Paid search, paid social, organic, email, referral, marketplace.
- AOV by device: Desktop vs mobile vs tablet.
- AOV by customer type: New vs returning, loyalty tier, geography.
- AOV with conversion rate: A dual?axis chart that shows trade?offs after promotions or pricing changes.
In Klips, connect your commerce data source, then build a simple formula: SUM(product revenue) ÷ COUNT(orders). Set refresh to match your trading cadence and distribute the dashboard by shared link, TV mode, or scheduled PDF so the team stays aligned.
Common pitfalls
- Counting sessions instead of orders: AOV uses orders, not visits.
- Including shipping and tax: These inflate AOV without reflecting product value and margin.
- Mixing cancelled orders: Treat cancellations and refunds consistently to avoid choppy trends.
- Ignoring segments: One blended number hides opportunities. Segment by channel, device, and customer status.
- Chasing AOV at any cost: Deep discounts can raise AOV while reducing profit. Measure contribution margin per order alongside AOV.
Related metrics
- Conversion Rate
- Revenue per Visitor
- Average Selling Price
- Cart Abandonment Rate
- Customer Lifetime Value
Audience
Store Owner, Online Sales Manager
Variations
Average order value, Average basket value, Order value per transaction
Looking for more ecommerce metrics? Explore our ecommerce KPI library and add key metrics to your Klips dashboard.
Related Metrics & KPIs