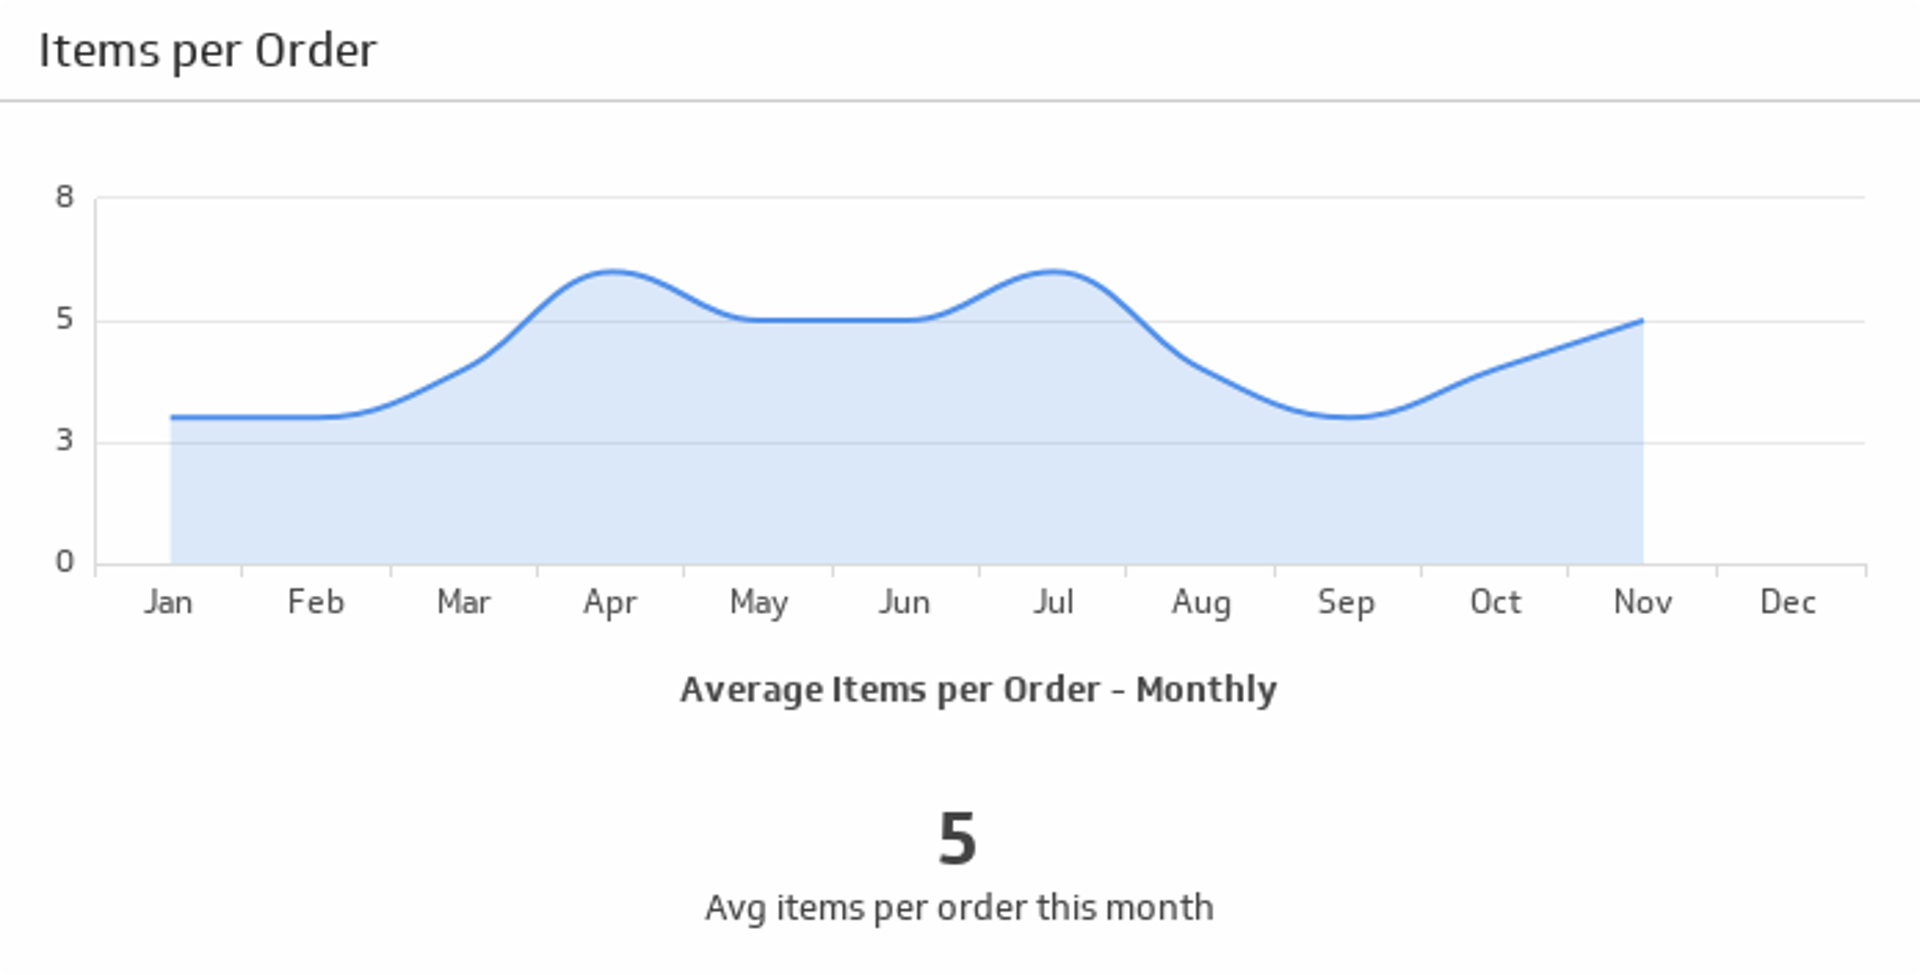
Items per Order Metric
Measure the total number of items purchased per order.
Track all your Ecommerce KPIs in one place
Sign up for free and start making decisions for your business with confidence.
Overview
The Items per Order metric helps your team track the average number of items purchased per order and aids in forecasting revenue.
This ecommerce metric highlights customer purchasing habits and bundling behaviour.
Formula
Total items purchased during the period / total number of orders during the same period
Reporting frequency
Weekly or monthly
Example of KPI target
5 items per order
Audience
Store Owner, Online Sales Manager
Variations
Shopping cart items per order
Example calculation
In the last 30 days, your store sold 750 items across 500 orders. Items per Order = 750 / 500 = 1.5.
Segment view: new customers 1.3, returning customers 1.8. That gap signals cross-sell potential for first-time buyers.
Why this KPI matters
- Revenue forecasting: A higher Items per Order with stable prices lifts revenue without more traffic.
- Merchandising insight: Bundles and recommendations reveal which products sell together.
- Unit economics: More items per order spreads shipping and pick-pack costs over a larger basket.
Benchmarks and context
Typical values vary by vertical, catalog size, and price point. Consumables and single-SKU purchases skew lower; bundles, accessories, and sets skew higher. Track your 12-month average and compare by category, device, and channel rather than chasing a single global number.
Ways to improve
- Bundles and kits: Offer prebuilt sets with a small saving.
- Cross-sell on product and cart pages: Suggest compatible add-ons and accessories.
- Free-shipping thresholds: Place the threshold slightly above current average order value to encourage an extra item.
- Volume pricing: Use multi-buy pricing on repeatable items.
- Inventory health: Keep top add-ons in stock. Backorders depress this metric.
- Checkout UX: Allow quick adds without leaving the flow.
Monitoring tips
- Segment: New vs returning, device, channel, and category.
- Pair with AOV and margin: Extra units should not erode profit.
- Watch seasonality: Promotions and holidays change basket size.
- Alerting: Flag sudden drops after pricing or UX changes.
Common pitfalls
- Counting cancelled or returned units: Use net shipped units for accuracy.
- Including freebies: Exclude free samples and gifts to avoid inflation.
- Order definition drift: Split shipments and partial fulfilments can double count if not normalised.
How to track it in Klips
Connect your ecommerce platform or database, calculate Items per Order in a data source, and visualise it alongside Average Order Value and conversion rate in a Klips dashboard. Schedule refreshes and plot trends by segment to spot shifts quickly.
Related Metrics & KPIs