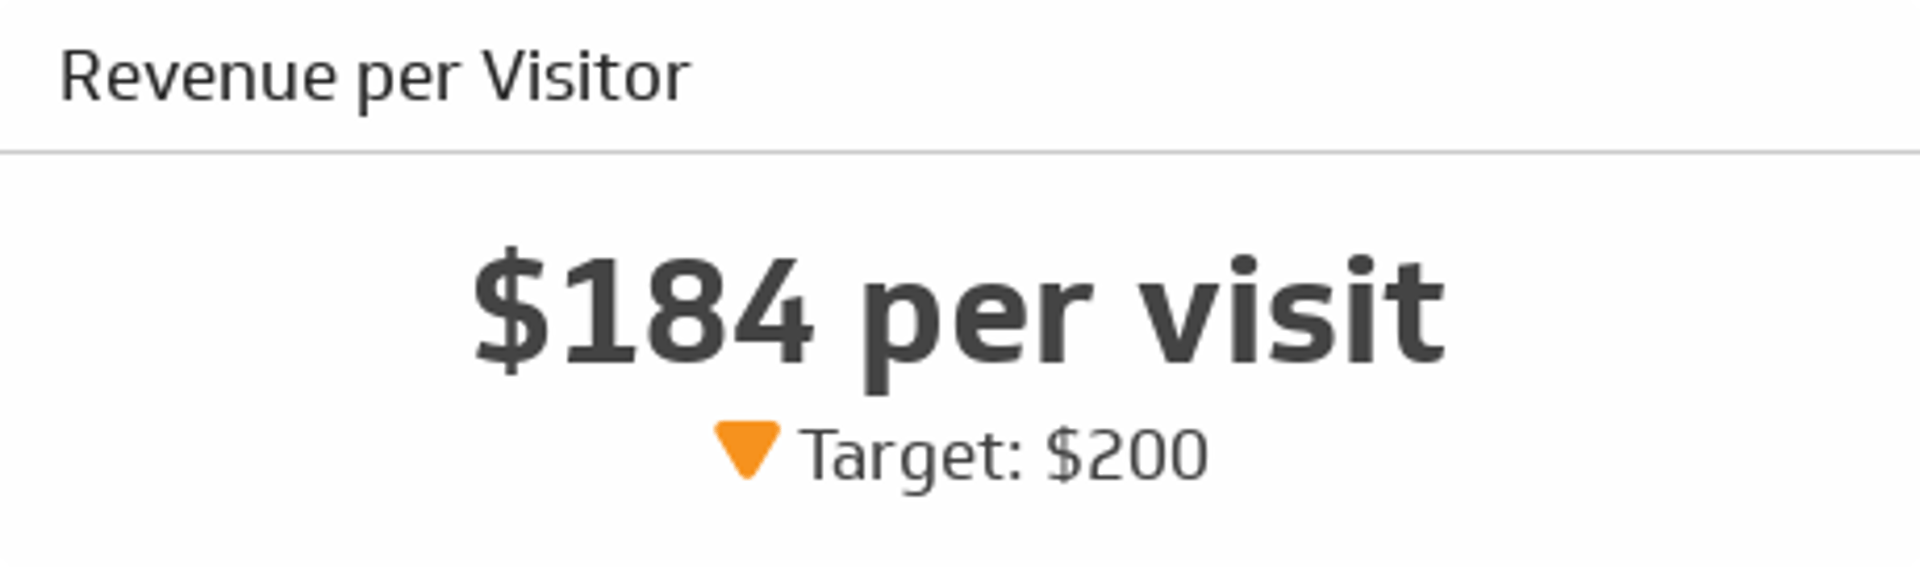
Revenue per Visitor (RPV)
Unlock the true value of your website traffic.
Track all your Ecommerce KPIs in one place
Sign up for free and start making decisions for your business with confidence.
What is Revenue per Visitor (RPV)?
Revenue per Visitor (RPV) is an e-commerce metric that measures the average amount of money generated each time someone visits your online store.
This KPI is essential for understanding the direct monetary value of your website traffic. By tracking RPV, you can effectively measure the impact of your marketing campaigns, assess the quality of your traffic, and make data-driven decisions to optimize your sales funnel and user experience. It helps you shift focus from simply driving traffic to attracting high-value visitors who are more likely to convert.
How to calculate Revenue per Visitor
To calculate RPV, you divide your total revenue over a specific period by the total number of unique visitors during that same time.
Formula: Total Revenue / Total Number of Visitors
Why is Revenue per Visitor important?
Monitoring your RPV provides critical insights into your business's performance. It helps you answer key questions: Are your marketing efforts attracting visitors who actually spend money? Is your website effectively turning browsers into buyers? A rising RPV indicates that your product offerings, pricing strategies, and on-site experience are successfully encouraging spending. Conversely, a falling RPV can be an early warning sign that you need to optimize your conversion pathways or marketing focus.
Who monitors Revenue per Visitor?
- Store Owners use RPV to gauge the overall profitability and health of their online business.
- Online Sales Managers track RPV to evaluate the effectiveness of sales strategies and promotional campaigns.
- Marketing Teams analyze RPV to determine the return on investment (ROI) of different traffic sources and campaigns.
How to improve Revenue per Visitor
Increasing your RPV is about maximizing the value of every visit. Here are a few strategies:
- Optimize Conversion Rates: Streamline your checkout process, improve site speed, and use high-quality product images and descriptions.
- Increase Average Order Value (AOV): Implement upselling and cross-selling tactics by suggesting complementary products or premium upgrades.
- Refine Your Pricing Strategy: Test different price points and offer product bundles to encourage larger purchases.
- Personalize the User Experience: Use customer data to offer personalized recommendations and targeted promotions that resonate with visitor behaviour.
How should you visualize this KPI?
When tracking Revenue per Visitor, it's best to visualize it on a dashboard using a summary chart to display the current value. A line chart is also effective for showing the RPV trend over time. This allows you to quickly see if your optimizations are having the desired effect.
Related Metrics & KPIs