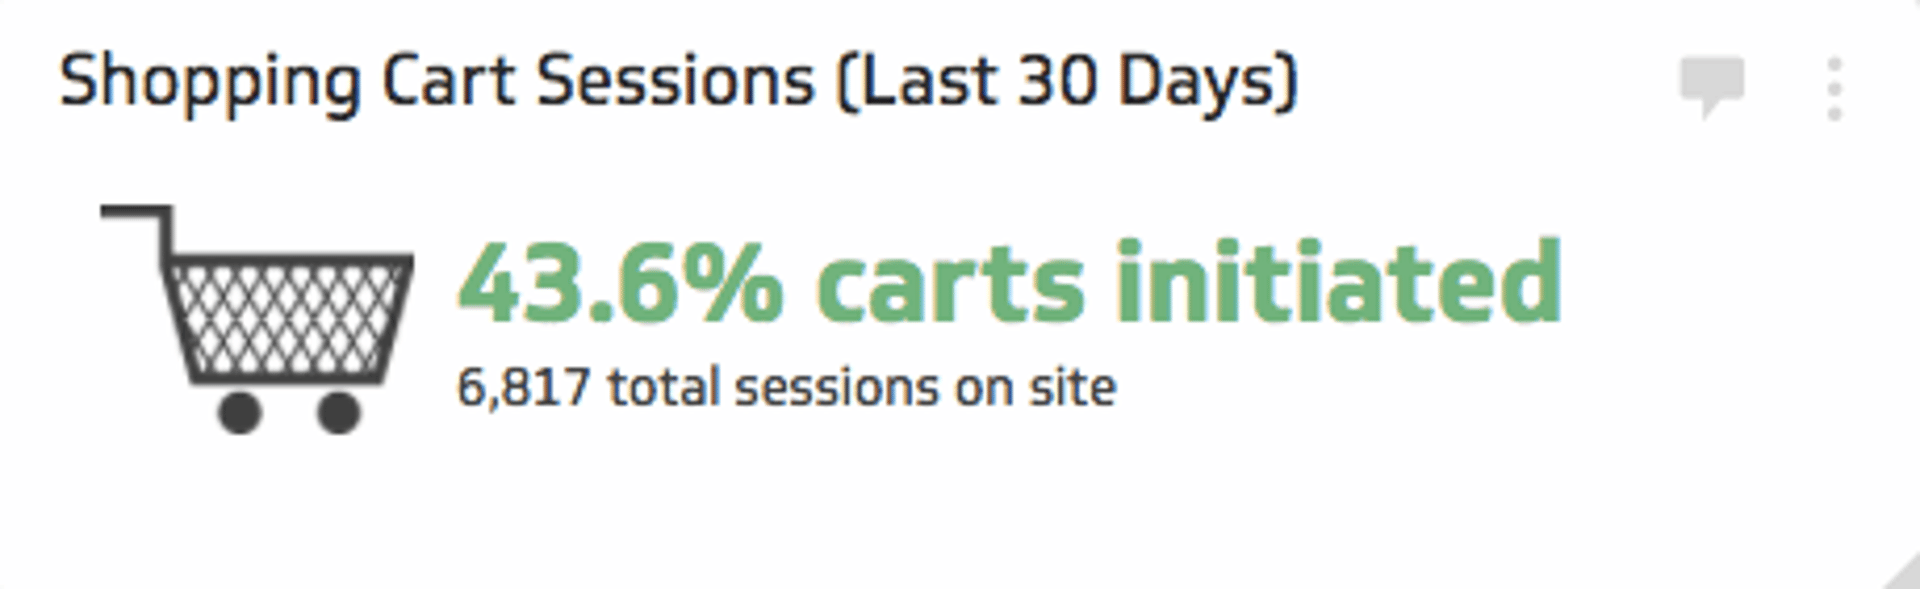
Shopping Cart Sessions
Track the total number of shopping cart sessions on your site.
Track all your Ecommerce KPIs in one place
Sign up for free and start making decisions for your business with confidence.
What is Shopping Cart Sessions?
Shopping Cart Sessions counts the number of website sessions in which a shopper creates a cart or adds at least one item to a cart. It is a leading indicator in the ecommerce funnel because it captures intent that sits between product views and checkout starts. When this number grows faster than overall traffic, merchandising, pricing, or on-site UX is usually doing its job. When it lags, something in discovery, product detail, or cart creation is adding friction.
Formula
You can track this KPI as a count or as a rate. Teams often report both.
- Count: Sessions with a cart created or an add-to-cart event
- Rate: (Sessions with a cart ÷ Total sessions) × 100
Decide what “cart” means in your stack. Many shops use the add-to-cart event. Others use a cart view event that fires once a cart exists. Be consistent across reports.
Reporting frequency
Daily for trading visibility; weekly and monthly for trends. Use the same definition at every cadence so comparisons hold.
Example KPI target
40% of sessions include at least one add-to-cart action.
Example calculation
Assume your site recorded 500,000 sessions last month. Of those sessions, 190,000 included at least one add-to-cart event.
- Cart sessions (count): 190,000
- Cart session rate: 190,000 ÷ 500,000 × 100 = 38%
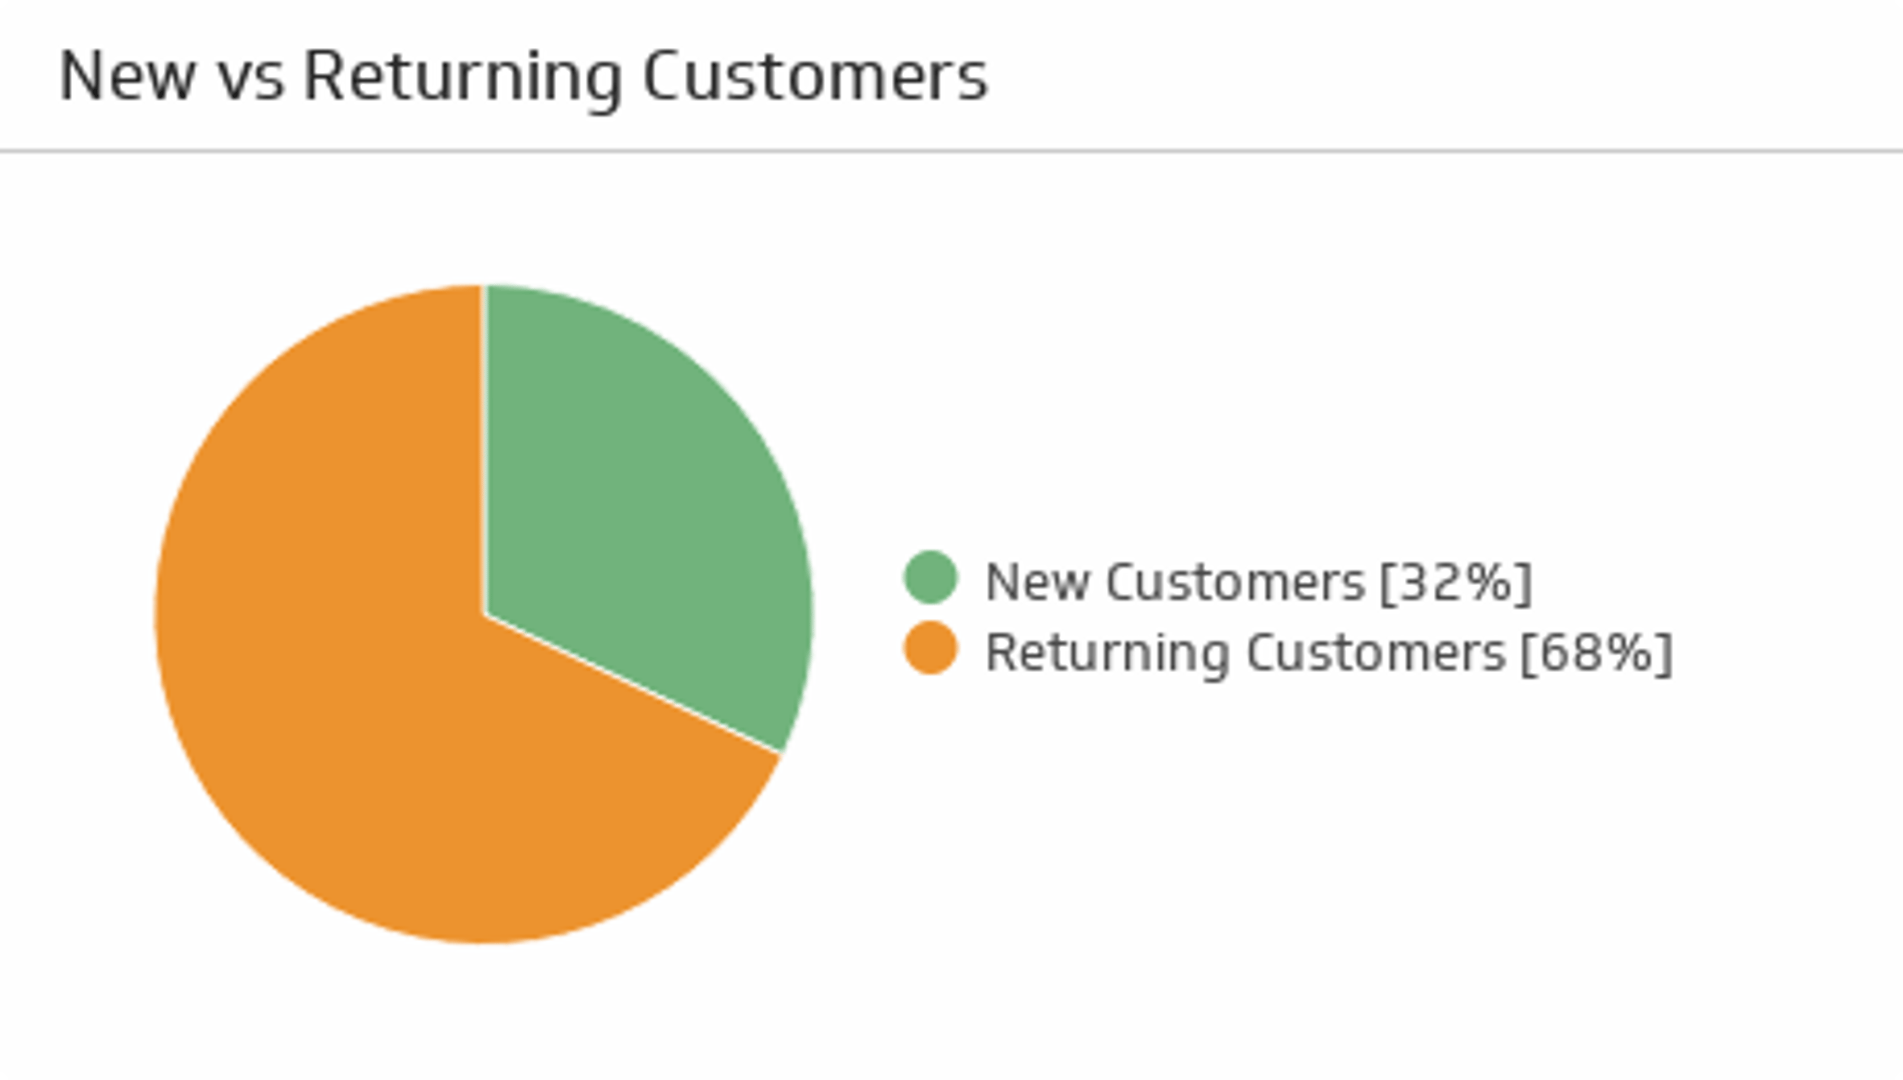
Segmenting reveals the story behind the average. If 120,000 of those cart sessions came from returning users and 70,000 from new users, returning users are driving most of the intent. That suggests an opportunity to strengthen first-visit discovery and reassurance. Device splits help too. If mobile posts a 30% cart session rate while desktop sits at 48%, image quality, page speed, or small-screen layouts might be holding back adds on mobile.
What is a good benchmark?
There is no single benchmark that fits every shop. The rate varies with category, price point, traffic mix, and merchandising strategy. High-consideration items often see lower cart rates than replenishment goods. B2B buyers who build bulk orders may have higher cart rates on weekdays and lower rates on weekends. Track your own baseline by channel, device, and customer type, then aim for steady lifts within each segment.
Why this KPI matters
- Early signal of revenue health: Cart sessions sit upstream of checkout starts and purchases. A dip here often predicts softer conversion later in the week.
- Merchandising feedback loop: Changes to featured products, search rules, filters, and recommendations show up quickly in cart behaviour.
- Media and landing page alignment: Campaign promises that do not match landing content create clicks without carts. This KPI helps you spot that gap fast.
- Remarketing fuel: More cart sessions expand audiences for cart-based email and ad sequences.
How to calculate Shopping Cart Sessions correctly
- Use the right event: Prefer the add-to-cart or cart-created event from your analytics or commerce platform.
- De-duplicate: Count one cart session per session, not every add-to-cart click. Multiple add-to-carts in the same visit should not inflate the session count.
- Exclude noise: Filter out test orders, staff traffic, bots, and quality-assurance sessions.
- Align time zones: Use a shared reporting time zone across sources so daily totals reconcile.
- Document the scope: Note whether quick-add from category pages is included, and whether the event fires for out-of-stock attempts.
How to improve the number without hurting profit
- Strengthen product discovery: Clean category pages, faceted filters, and useful search boost findability and add-to-cart actions.
- Raise confidence on PDPs: Clear photos, size guides, fit notes, and reviews reduce hesitation.
- Clarify shipping and returns: Prominent policy snippets near the add button calm last-second doubts.
- Use relevant cross-sells: Show add-ons that complete the job the shopper is trying to do.
- Speed matters: Faster page loads lift micro-conversions. Compress images, trim scripts, and defer non-essential tags.
- Test thresholds with care: Free-shipping thresholds can lift cart creation when the gap is small and visible. Protect contribution margin when you set the level.
How to monitor this KPI in a Klips dashboard
Connect your commerce and analytics sources, then create views that make action obvious. Useful components include:
- Trend chart: Cart sessions and cart session rate, with 7, 30, and 90-day lines and a same-period-last-year overlay.
- Segment table: Rate by channel (paid search, paid social, organic, email, referral, marketplace), device, new vs returning, and geography.
- Funnel view: Sessions - Cart sessions - Checkout starts - Purchases, with stage-to-stage rates.
- Campaign view: Landing page groups with cart session rate to verify message-match.
In Klips, pull add-to-cart or cart-created events and total sessions from your sources, then apply formulas like COUNT_DISTINCT(session_id where add_to_cart = true) and COUNT_DISTINCT(session_id). Compute the rate and display both values. Set automatic refresh to match trading cadence and share the dashboard via link, scheduled email, or TV mode so teams stay aligned.
Common pitfalls
- Confusing sessions with users: The KPI tracks visits with cart action, not people.
- Counting every add-to-cart: The KPI is session-level. Multiple adds in one session still count as one cart session.
- Missing server-side carts: If server-side events create carts, make sure they are stitched to sessions to avoid undercounts.
- Ignoring mobile UX: Small screens need bigger targets and lighter pages. Mobile cart rates often lag desktop for solvable reasons.
- Chasing carts at any cost: Heavy discounts can inflate adds while cutting margin and raising returns. Pair this KPI with gross margin per order and return rate.
Related metrics
- Add-to-Cart Rate
- Cart Abandonment Rate
- Checkout Conversion Rate
- Average Order Value
- Revenue per Visitor
Explore more ecommerce KPIs in our ecommerce KPI library and surface the metrics that matter on your Klips dashboard.
Audience
Store Owner, Online Sales Manager, Performance Marketer, Merchandiser
Variations
Cart sessions, Cart session rate, Sessions with add-to-cart, Cart initiation rate
Related Metrics & KPIs