Returning Customers
Track the total number of customers that keep coming back to your online store.
Track all your Ecommerce KPIs in one place
Sign up for free and start making decisions for your business with confidence.

Overview
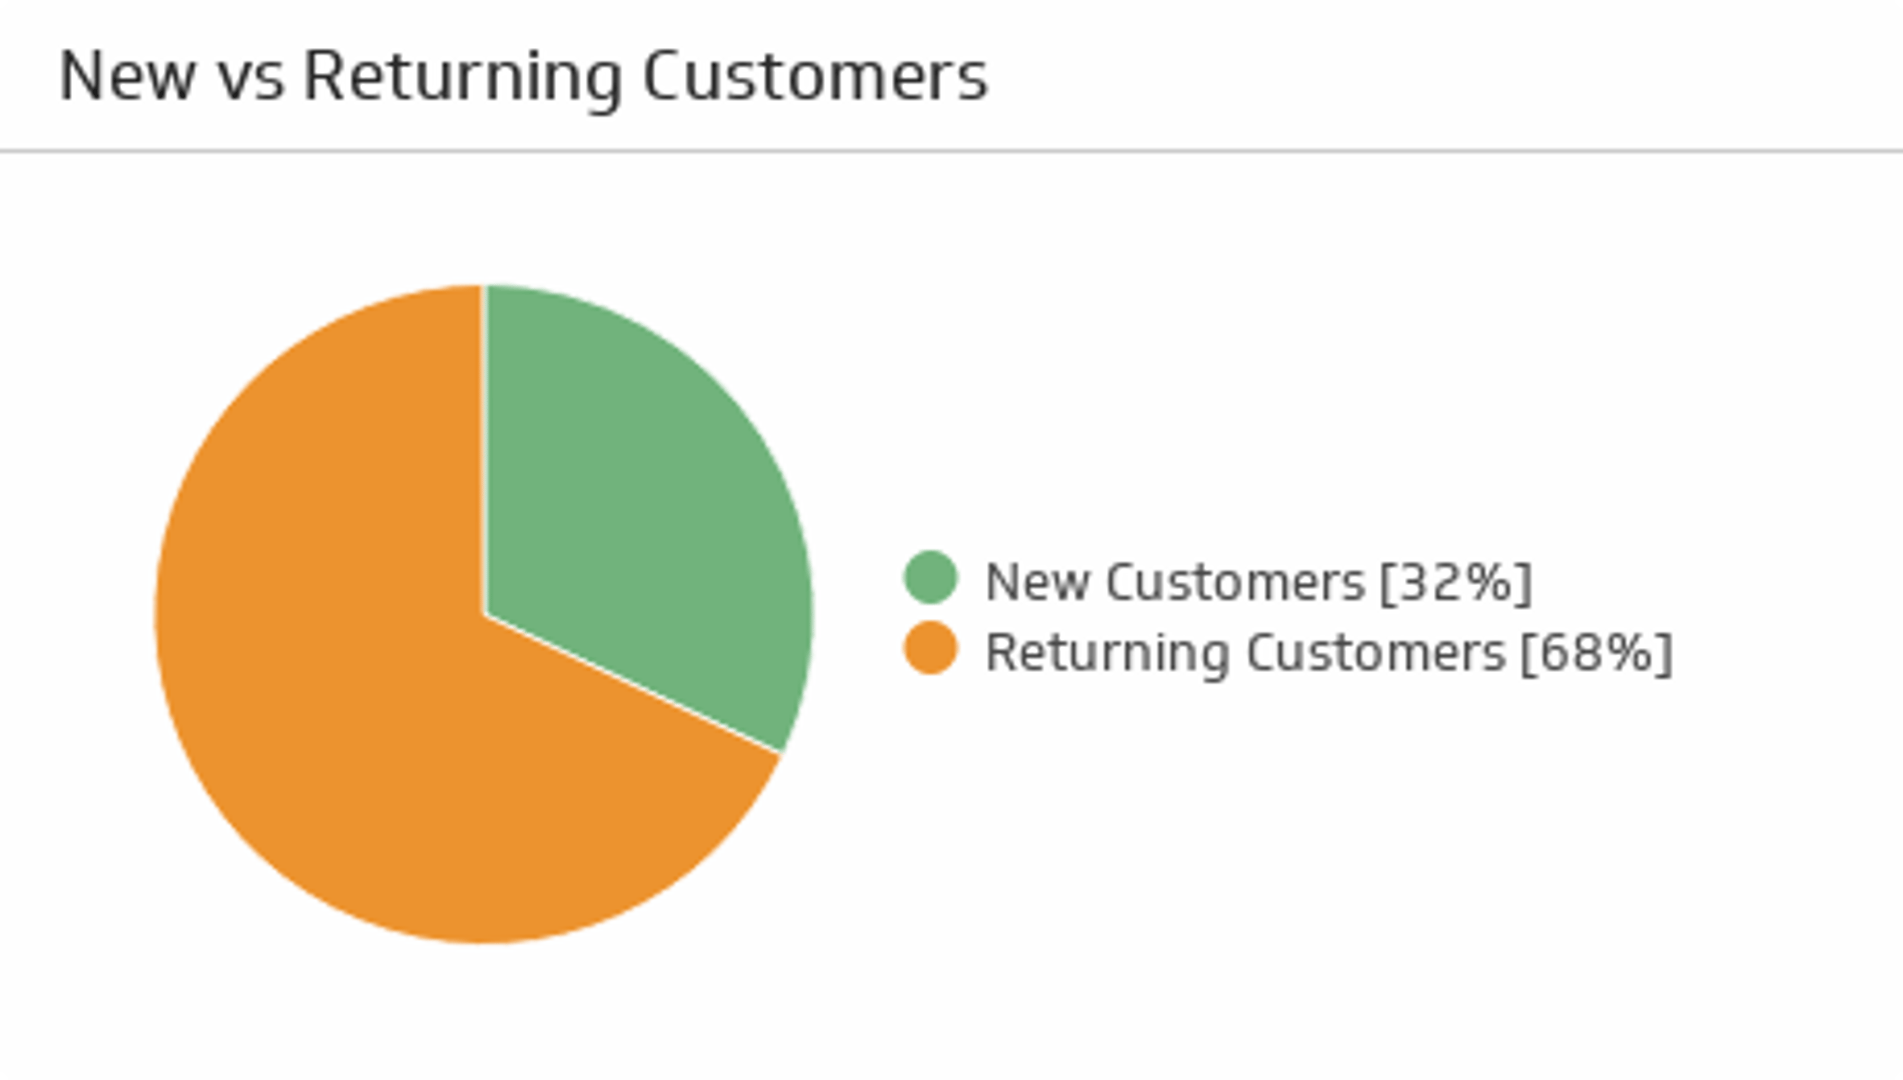
How effective is your online store at drawing your customers back time and time again? The Returning Customers e-commerce metric helps you track the percentage of your total visits from repeat customers.
A higher number of returning customers indicates that the business is successfully retaining its existing clients, which is essential for long-term growth and profitability. Retaining customers is often more cost-effective than acquiring new ones, as returning customers are more likely to make additional purchases and recommend the brand to others.
Formula
(Repeat online customers/Total number of online customers)x100
Reporting frequency
Monthly, Quarterly
Example of KPI target
65% returning customers
Audience
Store Owner, Online Sales Manager, Marketing Manager
Variations
Percentage of returning customers on site
Why this KPI matters
Winning a one-time order is expensive. Repeat buyers lift lifetime value, raise average order value, and lower paid acquisition pressure. A healthy returning-customer rate usually signals product-market fit and a smooth post-purchase experience.
How to calculate it correctly
- Define a returning customer. Use logged-in users or reliable identifiers. Cookies alone inflate counts.
- Pick your window. Monthly and quarterly windows are common. Keep it consistent for trend analysis.
- Count unique customers. Divide returning unique customers by total unique customers for the period, not sessions.
Data you need
- Order history with customer IDs and timestamps
- Customer profile status (new vs returning)
- Channel attribution for first and repeat orders
Ways to improve returning-customer rate
- Onboarding and post-purchase care. Send order updates, clear delivery timelines, and easy returns.
- Lifecycle messaging. Build flows for replenishment, win-back, and VIP recognition. Keep the volume respectful.
- Loyalty and referrals. Reward repeat purchases and give simple referral perks that feel fair.
- Personalized merchandising. Recommend items based on past behaviour and category affinity.
- Channel alignment. Invest in owned channels like email and SMS to reduce paid reacquisition.
Track returning customers in Klips
- Connect your store data. Pull orders and customer tables from platforms like Shopify or WooCommerce, plus analytics from GA4.
- Model the cohort. Tag first-time buyers and returning buyers by month. Calculate the percentage by period and by channel.
- Visualize. Add a line chart for the overall trend, a stacked bar by channel, and a single-value Klip for this month.
- Set targets. Use colour rules to flag months below goal. Add notes for campaigns that moved the metric.
- Share. Schedule a monthly email to marketing and merchandising leads.
Common pitfalls
- Session vs customer math. Using sessions makes spikes look like loyalty. Always use customers.
- Short time windows. Some products have long reorder cycles. Look at 30, 60, and 90-day views.
- Ignoring cohorts. New-customer heavy months can drag the rate down. Segment by acquisition cohort.
Related metrics
- Repeat purchase rate
- Customer lifetime value (CLV)
- Average order value (AOV)
- Email revenue share
Track this KPI in Klips. Build a live dashboard that updates in real time, shares easily, and keeps your team aligned.
Related Metrics & KPIs