Ticket Analysis Metric
Understand what types of tickets are being submitted to your help desk.
Track all your Help Desk KPIs in one place
Sign up for free and start making decisions for your business with confidence.
Sign up with Google
or
Sign up with your emailFree for 14 days ● No credit card required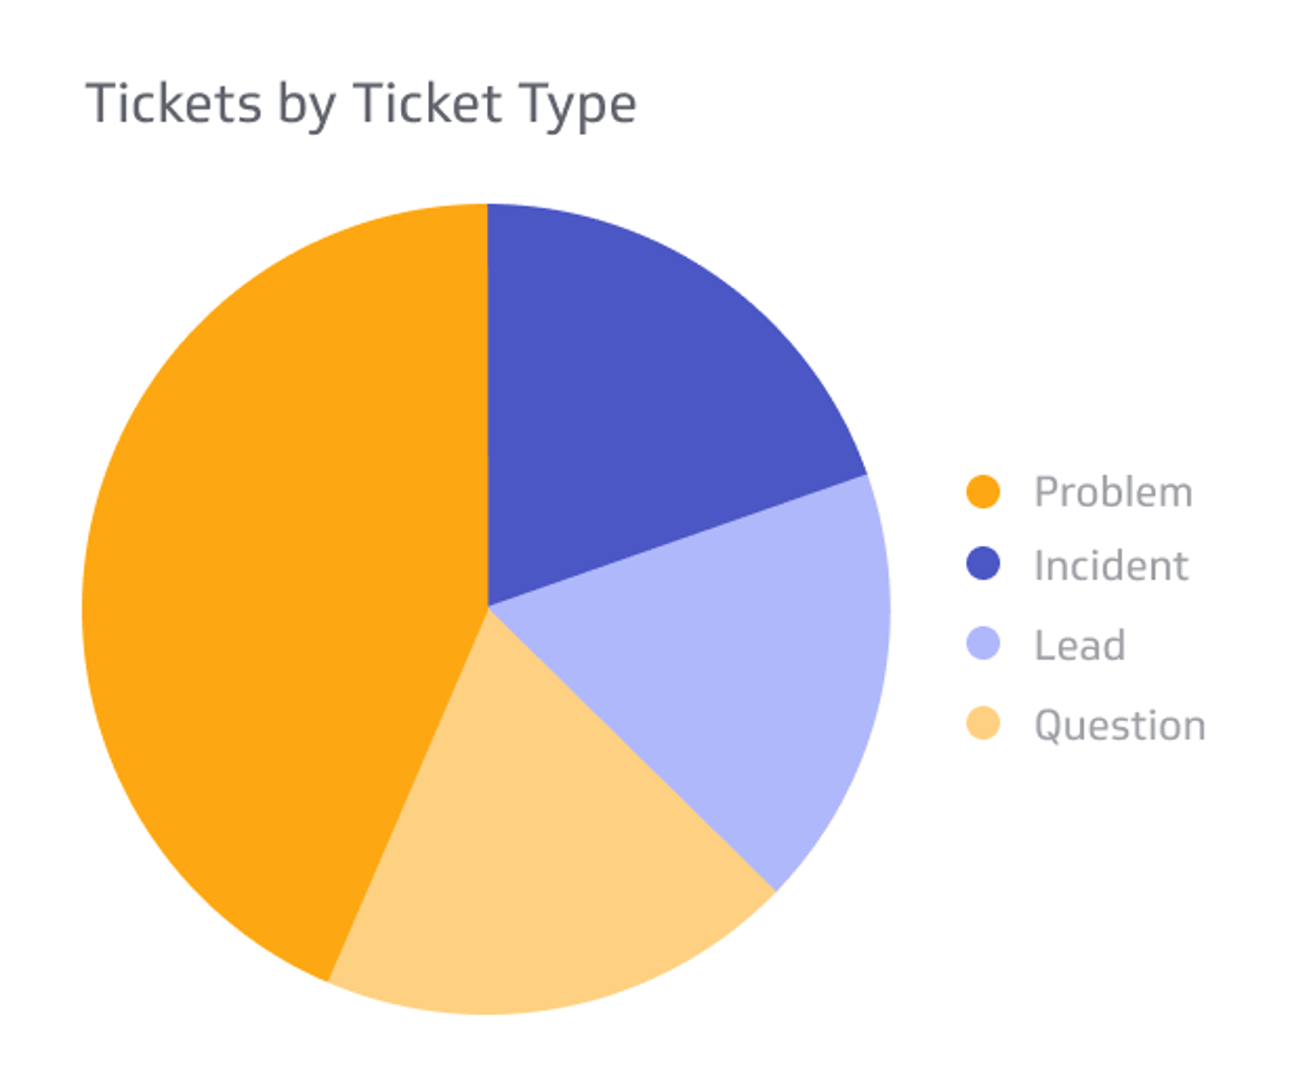
Overview
The Ticket Analysis visualization provides a breakdown of the different types of tickets being submitted to your help desk. Ticket categories may include ticket type, priority level, assigned agent, and ticket source. This analysis is designed to uncover trends behind tickets being submitted. For example, if a high number of tickets submitted are marked "Questions," it may indicate the need to write an FAQ for your customers.
Success indicators
- Reducing the number of tickets that can be answered by other means, such as documentation.
What to look for
- Top categories and topics. Where volume clusters.
- Backlog drivers. Categories with long handle times or many reopens.
- Source patterns. Email vs chat vs phone behaviour.
- Release impact. Spikes after a launch or policy change.
How to improve with insights
- Fill content gaps. Convert common questions into clear docs and in-product help.
- Strengthen routing. Send complex topics to senior queues. Create specialty pods for tricky workflows.
- Fix root causes. Share patterns with product and operations so they can remove friction.
Track ticket analysis in Klips
- Connect tools. Bring in tickets from your help desk platform. Include fields for category, priority, status, assignee, and source.
- Normalize categories. Clean up naming so reports roll up correctly.
- Visualize. A stacked bar by category, a line for total volume, and a table of top articles requested.
- Drill by time. Compare before and after a release or campaign.
- Share. Send a weekly report to product, support, and ops.
Common pitfalls
- Too many categories. Long picklists lead to messy data. Keep the taxonomy simple and train agents.
- Not tagging root cause. Category alone is not enough. Add a field for the reason.
- Ignoring seasonality. Holidays or billing cycles can mask product issues. View year-over-year as well.
Related metrics
- First Contact Resolution (FCR)
- CSAT
- Backlog size
- Ticket deflection
Track this KPI in Klips. Build a live dashboard that updates in real time, shares easily, and keeps your team aligned.
Related Metrics & KPIs