Point of Purchase Metric
Measures where retail transactions are completed and compares each point over a given period to identify trends.
Track all your Retail KPIs in one place
Sign up for free and start making decisions for your business with confidence.
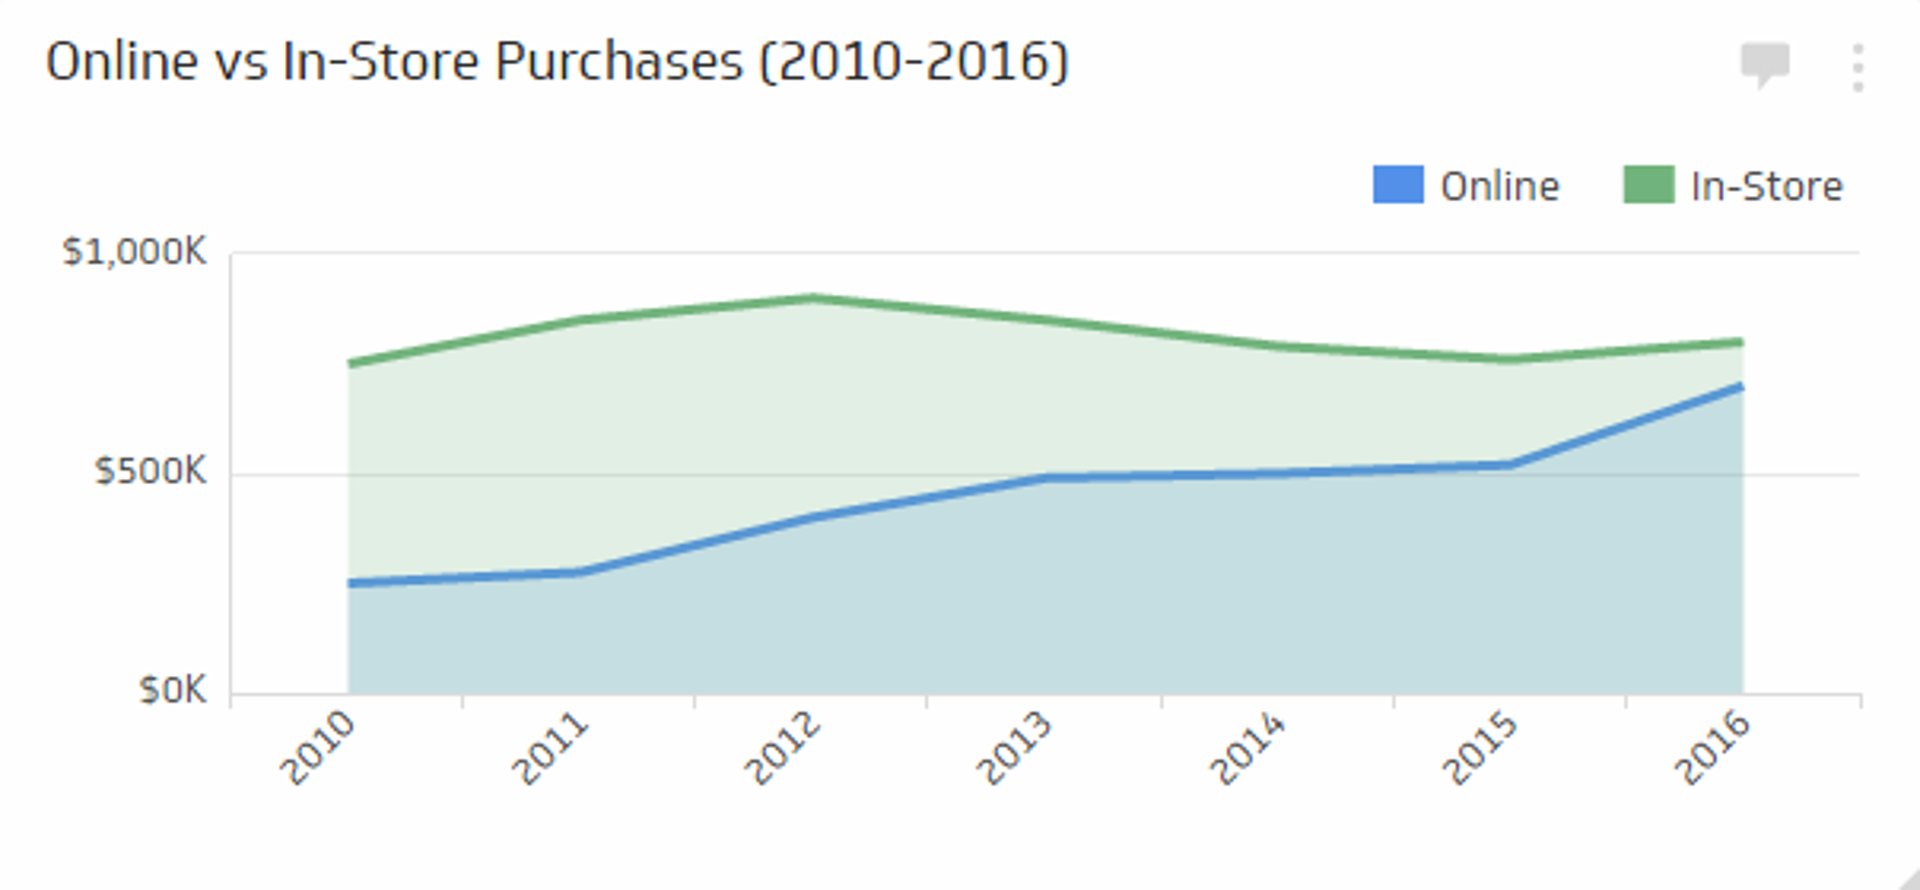
The Point of Purchase or Point of Sale KPI measures where retail transactions are completed and compares each "point" over a given period. Retail organizations can measure this at a "macro" or "micro" level. For instance, comparing online vs in-store purchases is at the "macro" level, while "micro" level transactions may be specific checkout lanes in a store, or a URL for an online retailer. This KPI is about figuring out where customers are making purchases, identifying trends and investing resources where they'll have the most impact.
Why this KPI matters
Knowing where purchases close helps you staff the right channels, place inventory correctly, and design merchandising that converts. It also shows which points drive higher average order value and repeat purchases.
How to calculate it
- Define points. Online store, marketplace, retail stores, kiosks, or lanes.
- Count transactions and revenue. For each point, sum orders, units, revenue, and returns.
- Compute share. Share of transactions by point = Transactions at point / Total transactions.
Data you need
- Order header data with channel, location, or lane
- SKU and category for mix analysis
- Returns and exchanges by point
How to improve results
- Remove friction. Speed up checkout, reduce steps, and surface popular payment options.
- Merchandise by context. Adjust assortments and pricing by channel or location.
- Route customers smartly. Offer BOPIS or ship-from-store to meet demand quickly.
Track point of purchase in Klips
- Connect POS and e-commerce. Pull orders from your POS and web platforms.
- Model metrics. Calculate transactions, revenue, AOV, and share by point.
- Visualize. Use a stacked bar for share by point and a map for store performance.
- Set thresholds. Colour rules flag locations trending down.
- Share. Send a weekly channel mix report to retail and e-commerce leads.
Common pitfalls
- Inconsistent tagging. Clean channel and location fields before reporting.
- Ignoring returns. Net revenue matters, not just gross orders.
- Same targets for all points. Different contexts need different goals.
Related metrics
- Average order value (AOV)
- Conversion rate
- Return rate
Track this KPI in Klips. Build a retail dashboard that updates in real time for store and channel leaders.
Related Metrics & KPIs