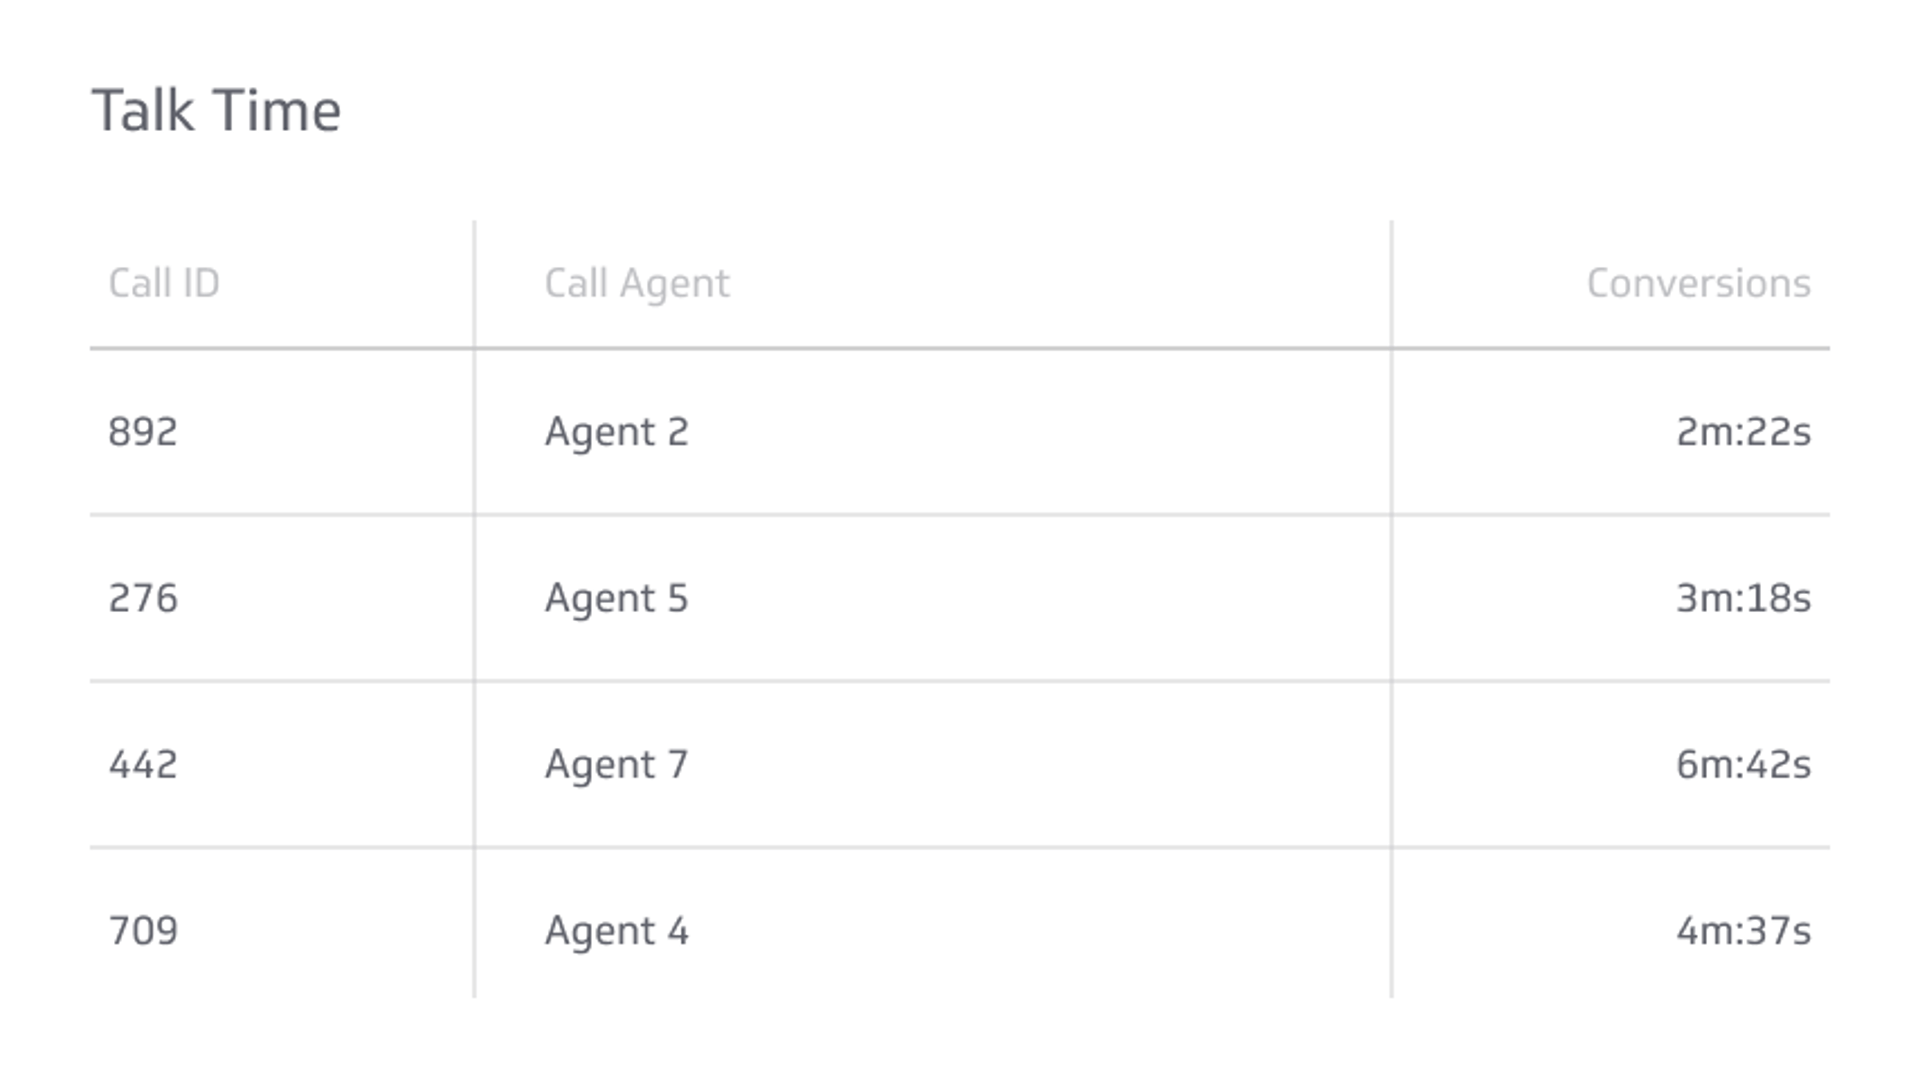
Talk Time Metric
Measure the amount of time your support agents spend talking to a customer.
Track all your Support KPIs in one place
Sign up for free and start making decisions for your business with confidence.
Overview
The Talk Time metric measures the average amount of time a call agent spends speaking with a customer. The metric gives your team insight into how long they should set aside for customer calls and how efficient they are with their calls.
Formula
(Talk time for call A + Call time for call B + Talk time for call C +...+ Talk time for call N)/Total number of calls handled
Reporting frequency
Weekly
Example of KPI target
270 seconds
Audience
Support Team
Variations
Talk time per call
Average call time
Why this KPI matters
Talk time shapes staffing plans and quality outcomes. Very short calls can signal rushed service or high transfers. Very long calls can point to product issues, poor routing, or training gaps. You aim for a range that balances speed with resolution quality.
Talk time vs Average Handle Time (AHT)
Talk time covers speaking time only. AHT includes talk time, hold time, and after-call work. Use both. A drop in talk time with a rise in after-call work shifts effort to agents instead of customers and may not help experience.
How to calculate it correctly
- Collect call-level data. Include start and end timestamps, hold time, queue, and agent.
- Sum talk seconds. Exclude holds and dead air if your system provides it.
- Divide by handled calls. Filter out abandoned calls.
- Segment. Report by queue, topic, and agent seniority for a clear picture.
Ways to improve
- Stronger routing. Skill-based routing sends customers to the right agent faster.
- Better knowledge. Keep a current knowledge base and quick-reply snippets.
- Coaching. Use call reviews to coach clarity, discovery, and next-step language.
- Deflect simple contacts. Use self-serve for password resets and order status so agents handle higher-value calls.
Track talk time in Klips
- Connect your phone system. Bring in call detail records from platforms like Aircall, RingCentral, or Five9.
- Create calculations. Compute average talk time by queue and by agent, plus distribution percentiles.
- Build visuals. A single-value Klip for current average, a histogram for distribution, and a trend by day.
- Set thresholds. Colour rules flag queues outside the target range.
- Share. Send a weekly scorecard to team leads.
Common pitfalls
- Chasing the lowest number. Short calls are not always better. Tie talk time to first-contact resolution and CSAT.
- Missing segmentation. Sales, support, and billing have different patterns. Do not lump them together.
- Ignoring product issues. Sudden spikes often come from bugs, outages, or policy changes.
Related metrics
- Average Handle Time (AHT)
- First Contact Resolution (FCR)
- Queue Abandonment Rate
- Customer Satisfaction (CSAT)
Track this KPI in Klips. Build a live dashboard that updates in real time, shares easily, and keeps your team aligned.
Related Metrics & KPIs