

Summary - So you’re ready to build your first dashboard. Great! Check out these 4 easy steps to design an awesome dashboard that will inspire action.
So you’re ready to build your first dashboard. Great! But how are you going to make it relevant? How are you going to make it actionable? We’ve seen too many examples of well-intentioned data champions who build impressive dashboards, only to complain that nobody looks at them after a few weeks.
In order to build a dashboard that keeps your team engaged, you have to think about some key concepts. That’s why we put together this Dashboard Planner.
Print out the Dashboard Planner worksheet and fill it out with key stakeholders at your company. Completing these four steps will set you up for success and save you time rebuilding dashboards later.
Dashboard Planner
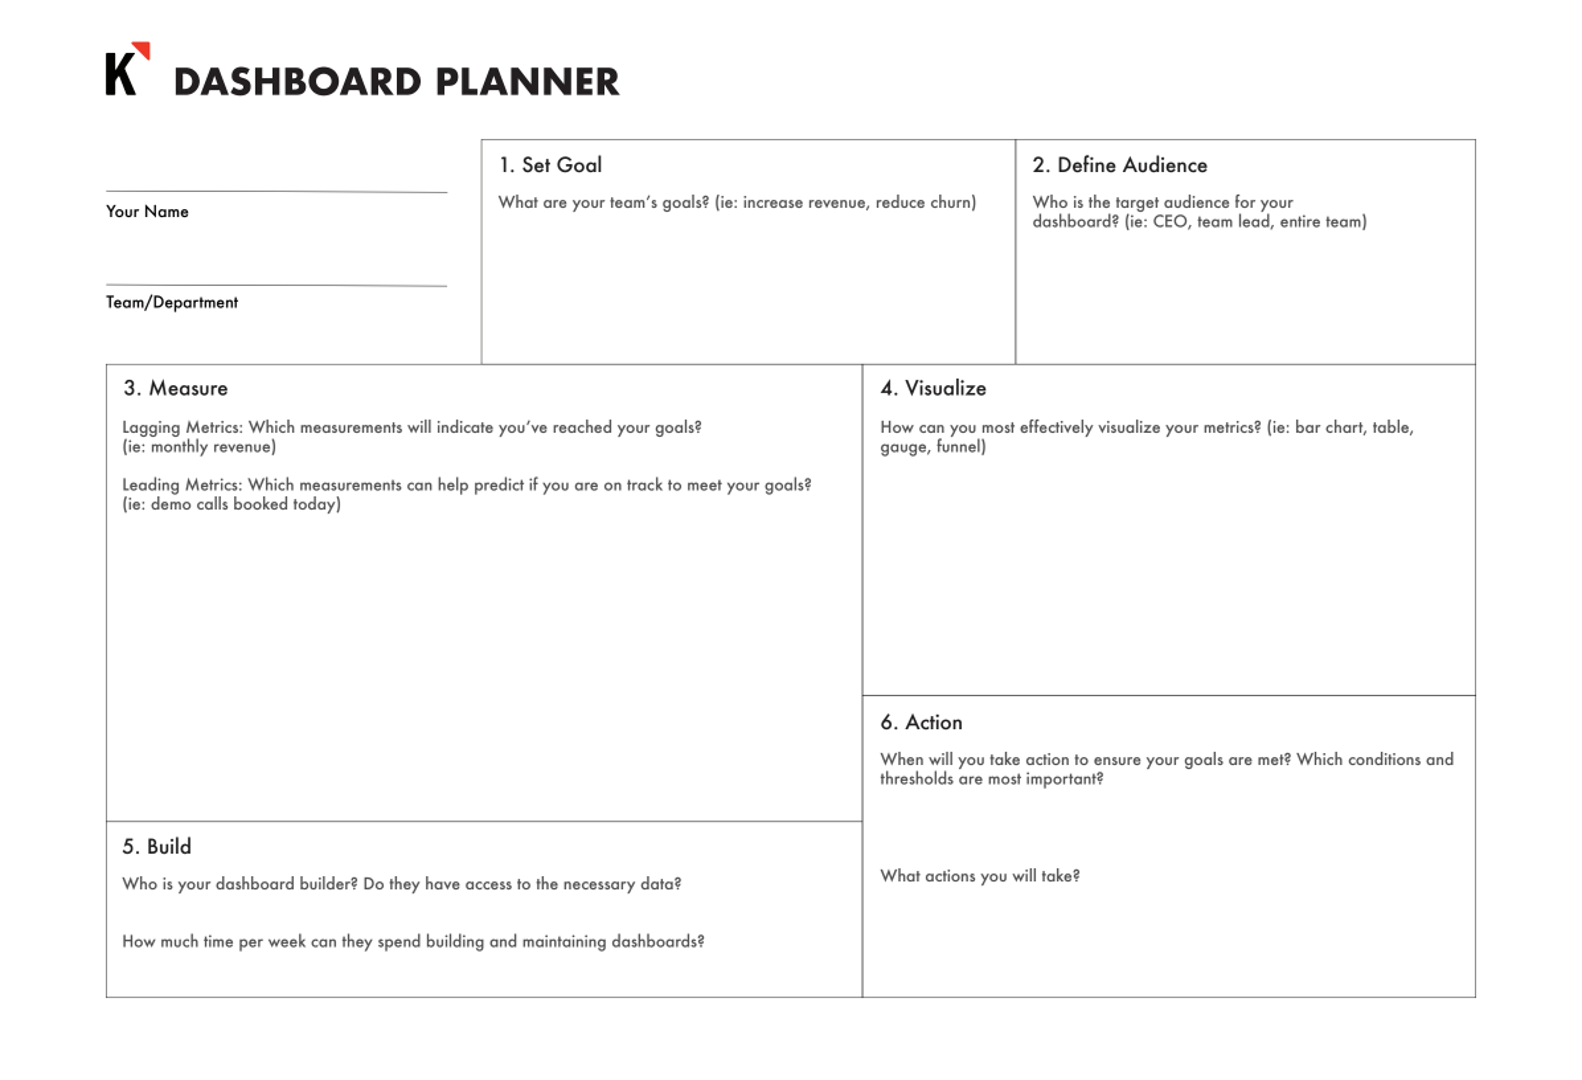
1. Goal
First, let’s start with your goal. Think about yourself or your team: what is the main goal you are trying to achieve? Maybe you are in support and need to hit your target of responding to tickets within 48 hours. Your goal would be “answer tickets on time”. Maybe you��’re on a marketing team and want to increase traffic to your website by five per cent. Whatever it is, write it down...it helps make it official.
2. Audience
Next, define the audience for whom this dashboard is intended. Is it your manager? Your team? You? The CEO? This is one of the most common dashboard design mistakes we see. You can’t just have a “marketing” dashboard, because the CEO will be interested in very different metrics than your content specialist! Select an audience for the first dashboard you want to build that aligns with the goal you specified.
3. Metrics
Now we get to the fun part: thinking about metrics. We find it helpful to think about two categories of metrics: lagging, and leading.
Lagging metrics are typically easy to measure. They reflect outputs, and are often common or familiar metrics (e.g. “revenue”). The tricky thing about lagging metrics is that they are often very difficult to action directly.
Then there are Leading metrics. These are typically harder to measure, and they reflect inputs instead of outputs. Leading metrics are often very specific to businesses, so you’ll need to put some thought into them. The nice thing about leading metrics is that they are highly actionable—perfect for a dashboard.
So now that you know the theory, let’s put it into practice. I find it easiest to start with lagging metrics and work up to my leading metrics.
How would you measure success against the goal you defined earlier? To go back to our examples, perhaps as the support manager, you would say “100 per cent of all tickets had a response time smaller than 48 hours”. As the marketing manager you might say “Traffic increased by five per cent by the end of the month”. These are great lagging metrics. Relatively easy to measure, easy to define, but not very actionable.
4. Action
Now let’s think about what actions we could take to move the needle on either of those lagging metrics. For the support dashboard, we might want to show “number of tickets that have been open for more than 4 hours without a response yet”. Now we’re talking! If your support team looks up at their TV dashboard and notices that this number is too high, they can take action! Maybe they’d ask the sales team to help, or work with DevOps to determine whether there is a system problem that is causing an influx of tickets. The point is, the leading metric here is much more actionable.
Similarly, for the marketing dashboard, we might say that we want to publish three blog posts per week for the entire month in order to boost website traffic through new content. Then we would show “number of blog posts this week” with a target of three. If your content strategist notices they are behind on their target late in the week, they better ask for help churning out some blog posts!
Now that you’ve finished filling out your planner, you should be able to see the impact Klipfolio will have on your day-to-day processes. It’s one thing to build dashboards and monitor the health of your business, it’s a whole other ballgame when you use those visualizations to take proper action on the fly.
Your best next step is to schedule some time with a Klipfolio Expert and review your goals together so they can help you turn this plan into a reality.
Happy dashboarding :)
Related Articles

6 dashboards I use daily to run my SaaS company
By Allan Wille, Co-Founder — April 10th, 2026
Anatomy of a great API
By Danielle Hodgson — January 21st, 2026
Klipfolio Partner How-To #1: Duplicating dashboards across client accounts
By Stef Reid — November 27th, 2025