

How to establish the best social media KPIs
Social media KPIs are measurable values that show whether your social media activity is moving the business forward. This article explains how to find the ones that actually fit your goals using a three-step process: assess your current channels, use data to identify your goals, and then choose the KPIs your team will commit to. It also covers the key follower, publication, and engagement metrics that teams most commonly land on.
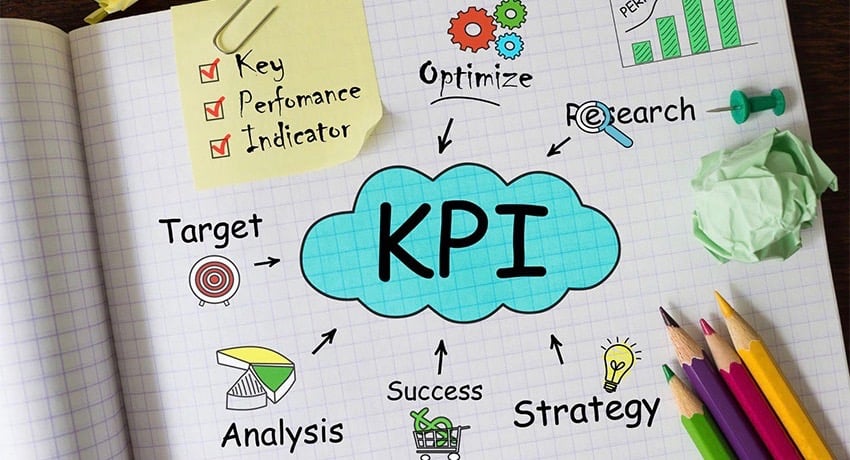
Social media KPIs are measurable values that show whether your social media activity is moving the business forward. Choosing the right ones matters more than measuring everything.
Most articles on this topic explain what social media KPIs are. This one focuses on something more useful: how to find the ones that actually fit your goals, and how to stop wasting time on metrics that look good but don't drive decisions.
First, a primer on KPIs
Key performance indicators (KPIs) are measurable values that show how effectively a company is achieving its key business objectives. The word "key" matters: KPIs aren't every metric you can track. They're the ones that tell you whether you're winning or losing on something that counts. See some KPI examples to get a feel for the range.
In social media, KPIs are typically visualized in charts that pull data across your channels. Here's an example:
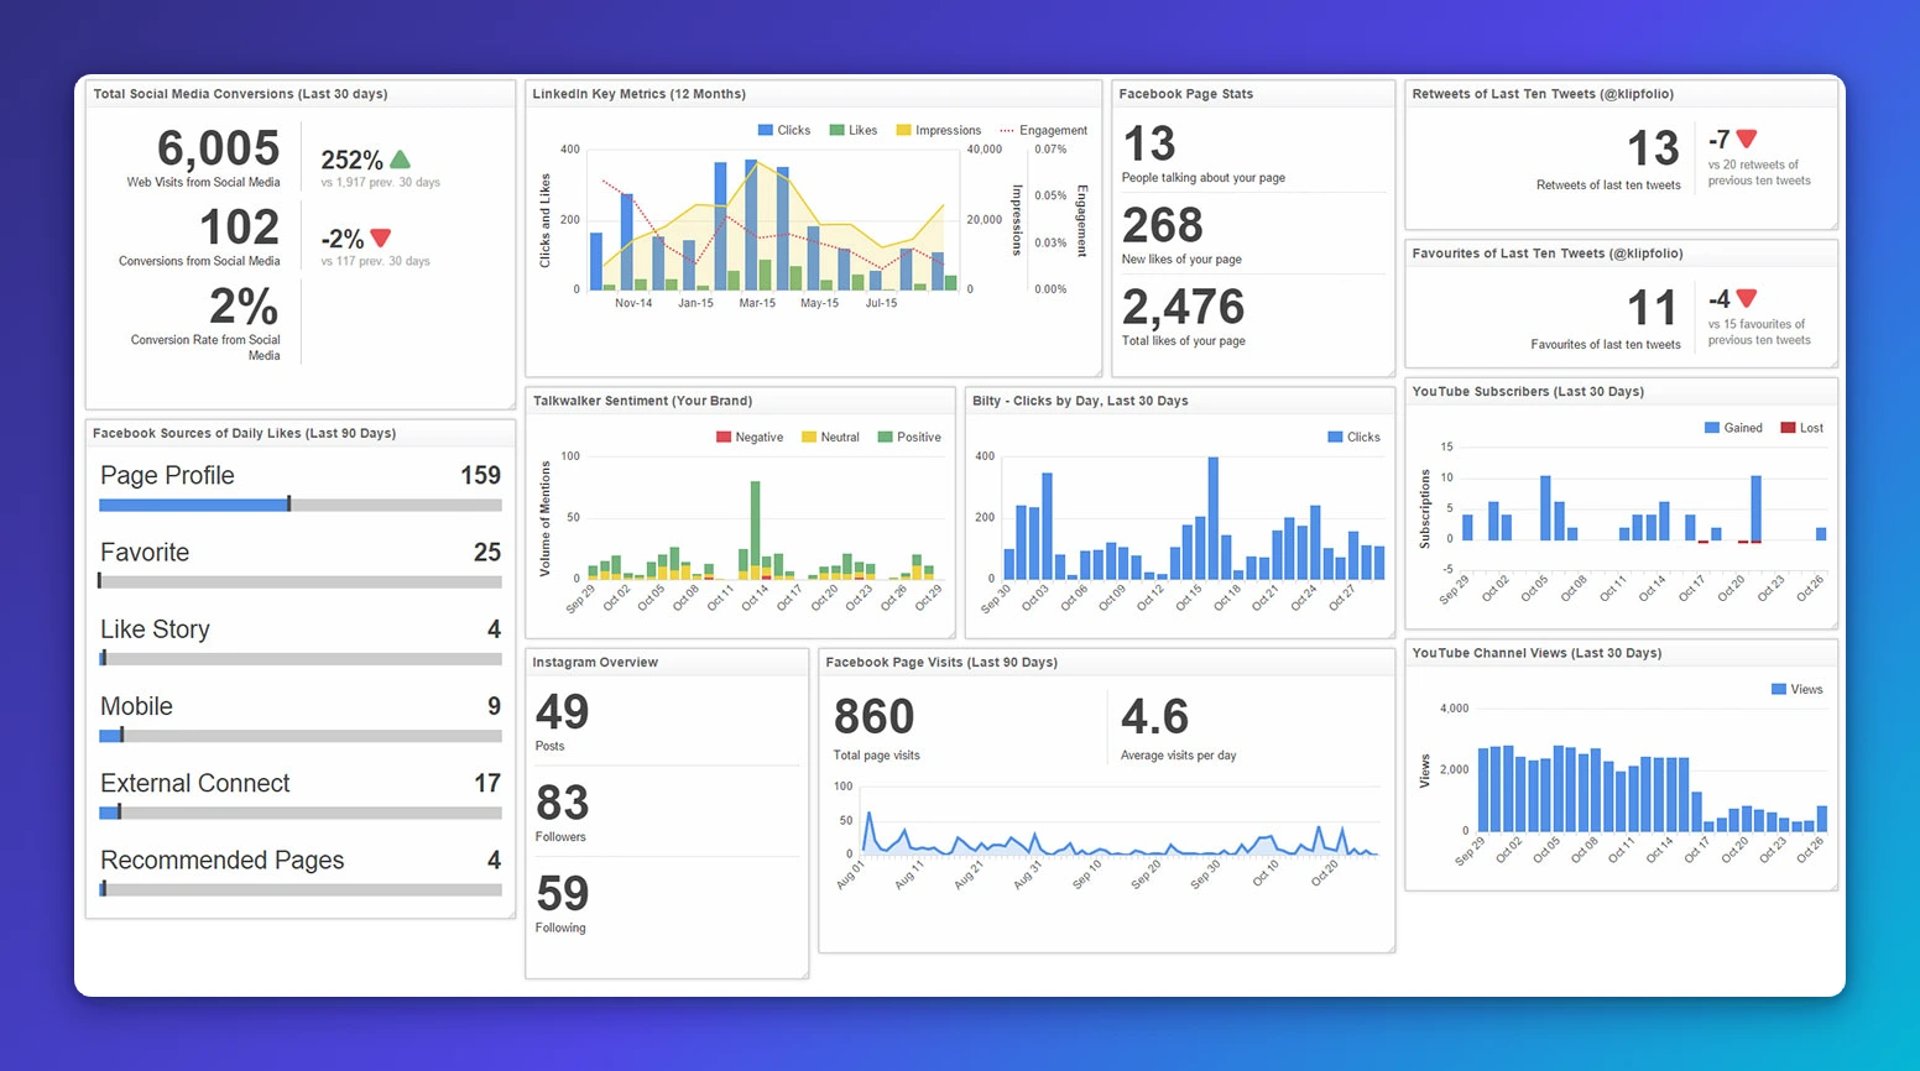
Before you build a dashboard and fill it with metrics, take a step back. The real work is figuring out which numbers actually deserve your attention.
What are the right social media KPIs for your goals?
The best social media managers start here. You can measure almost anything, but finding what matters is typically far more difficult than simply measuring everything. It's worth the effort. Tracking the right KPIs keeps your social media work aligned with company goals and frees you from vanity metrics that look impressive but don't change what you do.
Here are three steps that make it easier to narrow everything you could measure down to everything you should measure.
Step 1: Evaluate the current state of your social media channels
Start by assessing how you currently measure social media performance. If you don't have a clear process yet, these questions will help you build one:
What metrics do you typically track?
Who tracks them, and how often?
Do you report the results to others?
Do you act on what the numbers tell you?
Without this baseline, you can't know where you're starting from. Look at follower counts, rate of follower change, posting frequency, and the interactions your posts receive. Keep it broad at this stage. You're taking stock, not making decisions yet.
Step 2: Use data to identify your social media goals
This is where the data you've gathered grows into the strong core your social media team needs to decide where to focus. You now have enough to answer questions like:
How many followers do you gain each month?
How often do you post each week?
What kind of interactions do your posts typically get?
Use those answers to set a direction. If you post every day on Facebook and your follower count is growing steadily, but engagement on individual posts is flat, the smarter goal is to improve interaction rate, not post more often. If your Instagram engagement is strong but your follower growth is slow, your goal becomes reach, not depth.
One useful data point: research from quintly found that on Instagram, smaller profiles tend to see higher interaction rates than larger ones. That context can shape how you set realistic targets.
Step 3: Establish the right social media KPIs
Now you're ready to choose. Based on what you learned in steps one and two, write down which KPIs your team will focus on, and why. That "why" matters when you review performance at the end of the quarter. It keeps the team honest about whether the chosen KPIs were the right call.
The following metrics are ones teams regularly land on when they work through this process.
Fan and follower metrics
A solid follower base still matters. It determines how many people you can reach organically. These KPIs help you understand whether that base is healthy and growing.
Fan/Follower Change
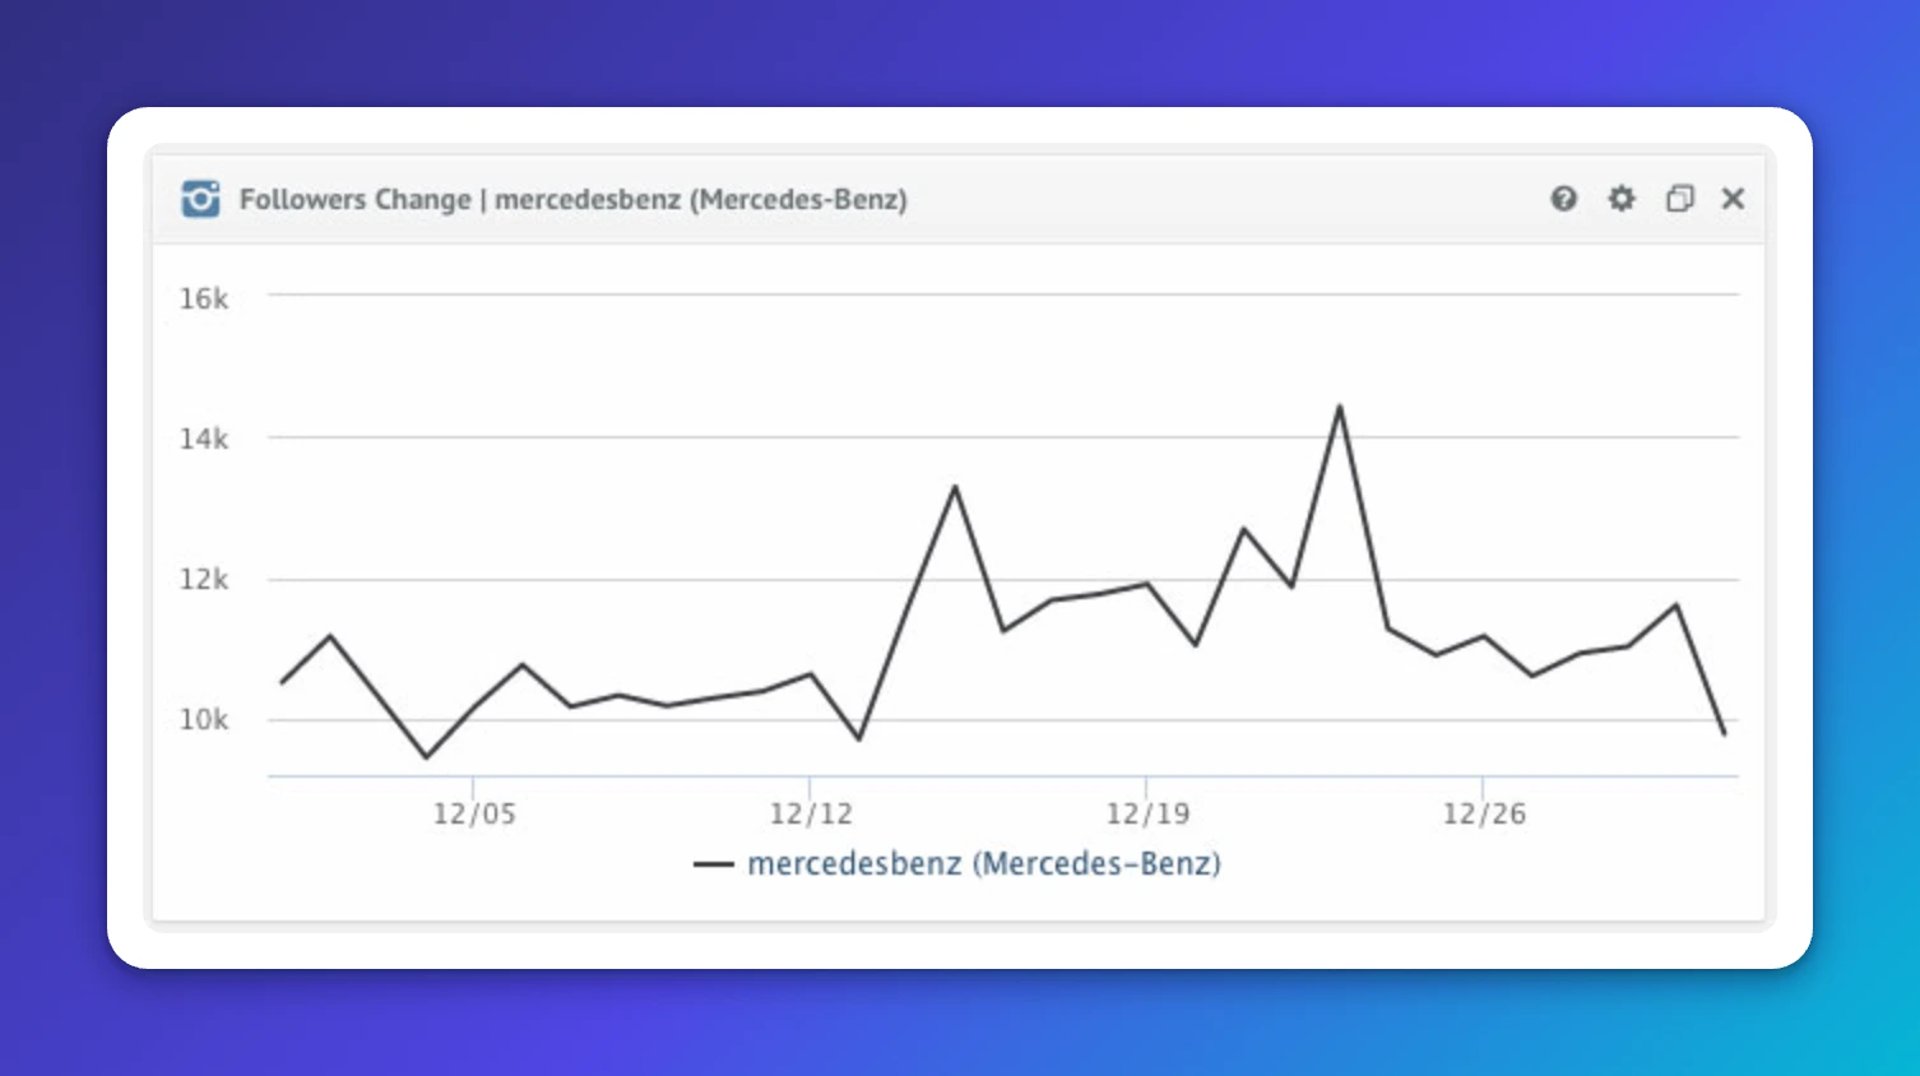
Day-to-day follower counts go up and down. That's normal. What you're watching for are the spikes and dips that signal something meaningful: a campaign that resonated, a post that missed, or an external event that drove attention your way.
In this Instagram example from December 2016, Mercedes-Benz saw follower growth of more than 10,000 on most days.
Fans/Follower Progress
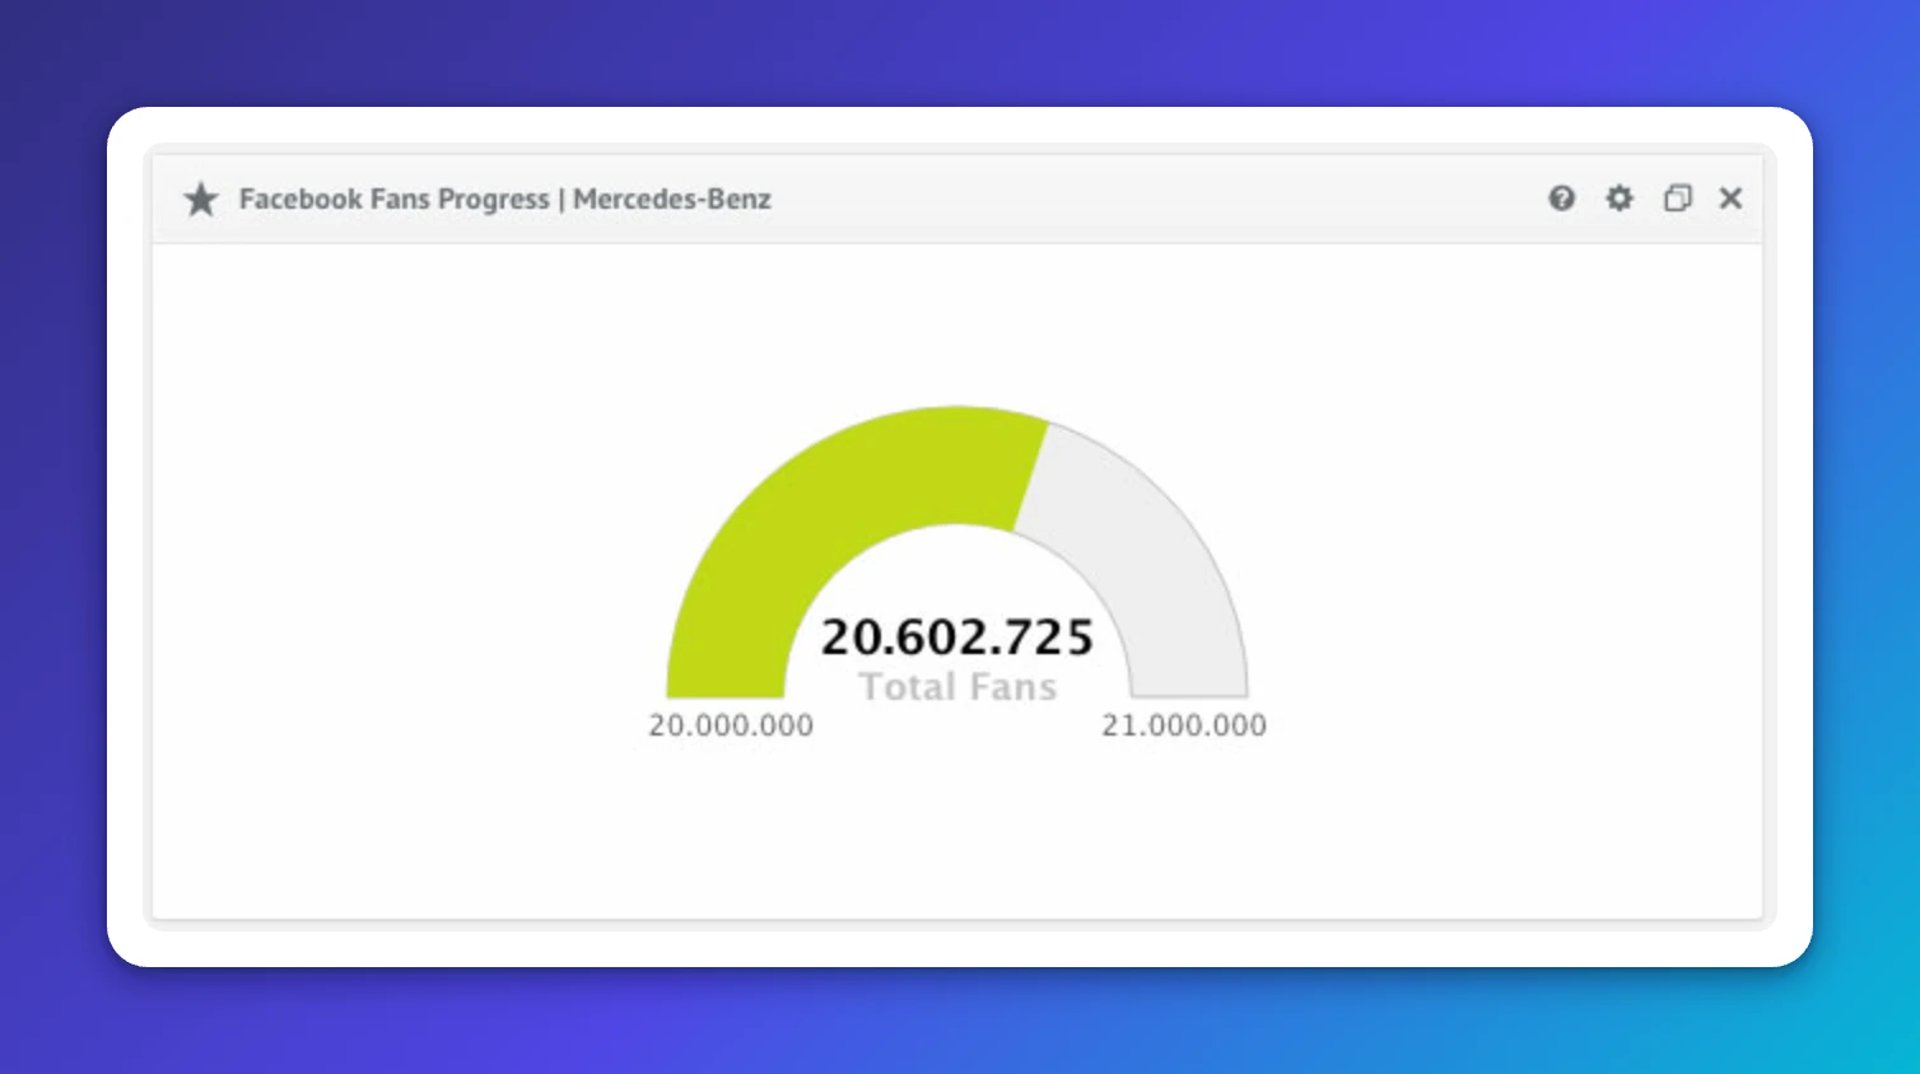
A gauge chart gives you a clear read on where you stand relative to a follower goal. At a glance, you can see whether you're on track, ahead, or need to adjust. At the end of your measurement period, there's no ambiguity: you either hit the target or you didn't.
Create custom dashboards for you and your team.
Get started with KlipsFans/Followers by Country
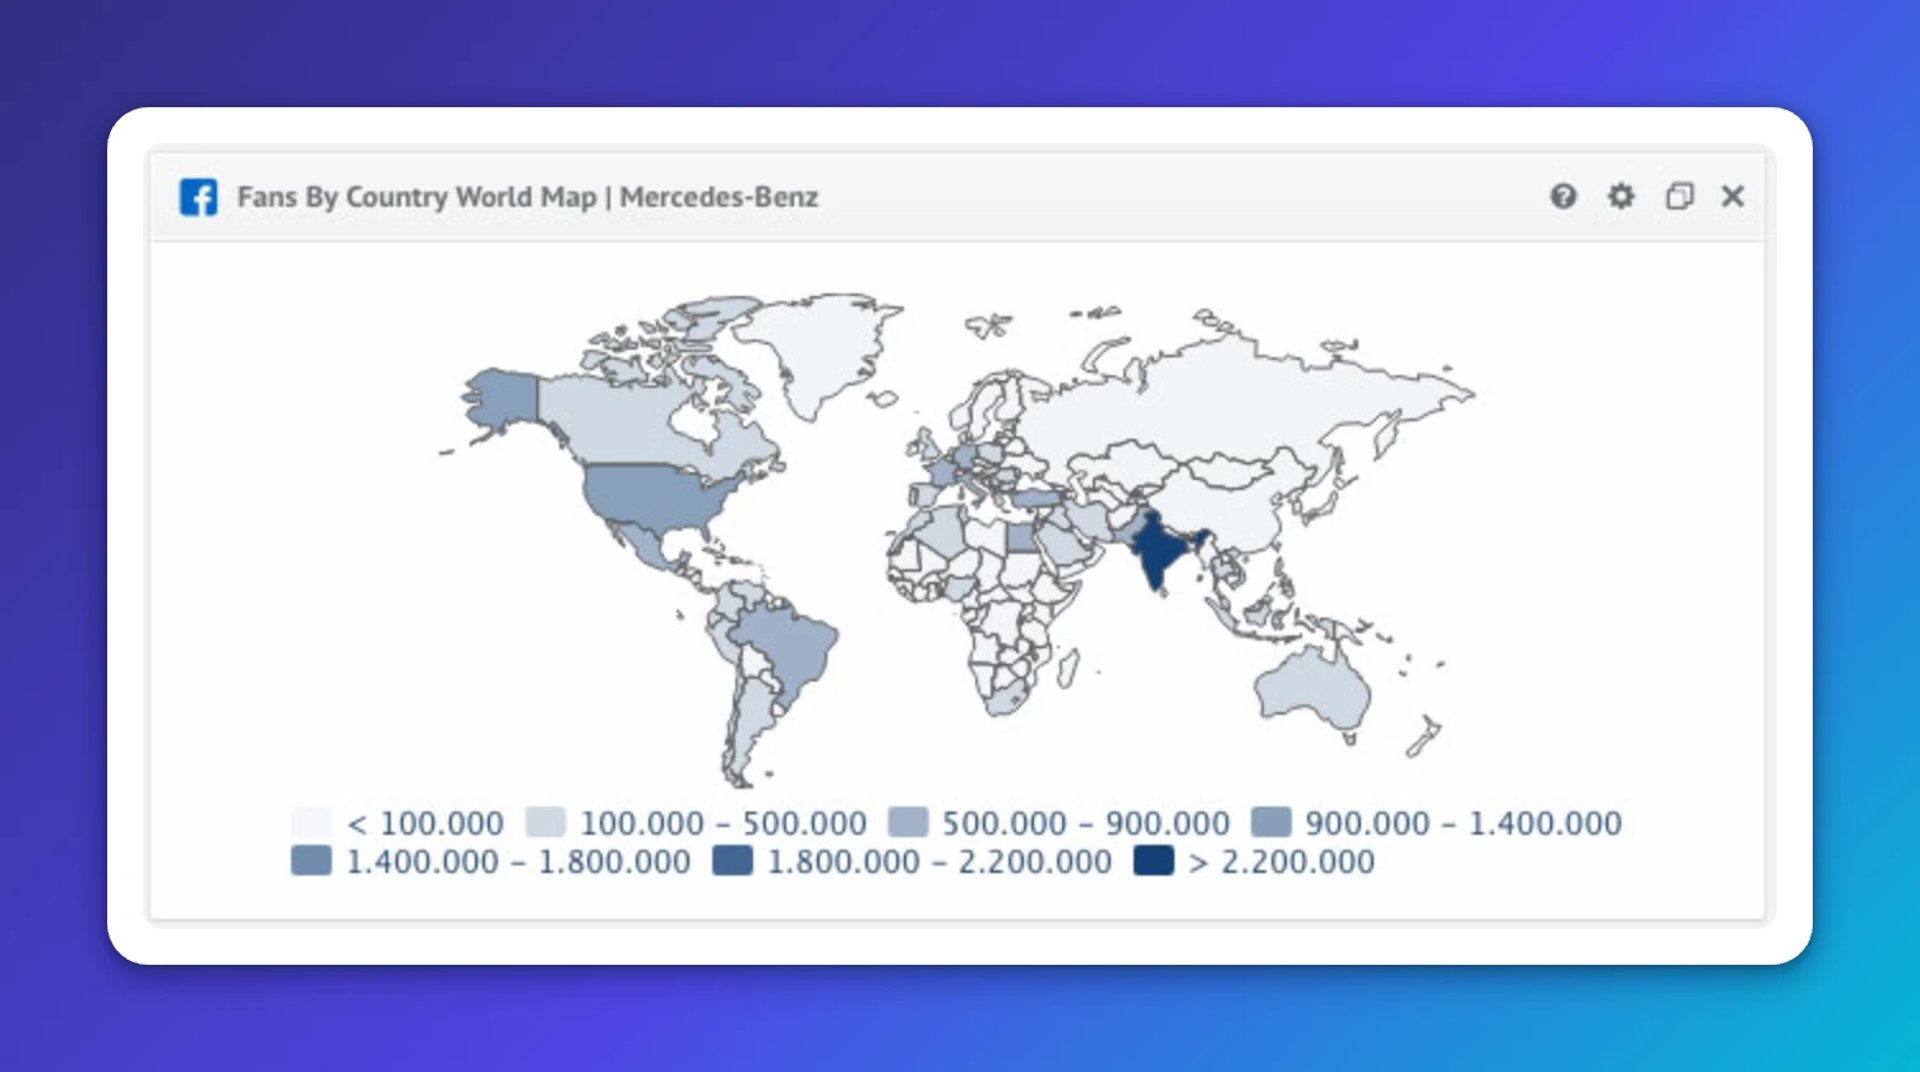
If your brand operates across markets, knowing where your audience lives shapes everything from posting times to content tone. This KPI also surfaces which countries are responding most strongly, so you can invest more in what's already working.
Publication metrics
These metrics reveal your posting behaviour and let you compare it against competitors.
Own Posts/Tweets
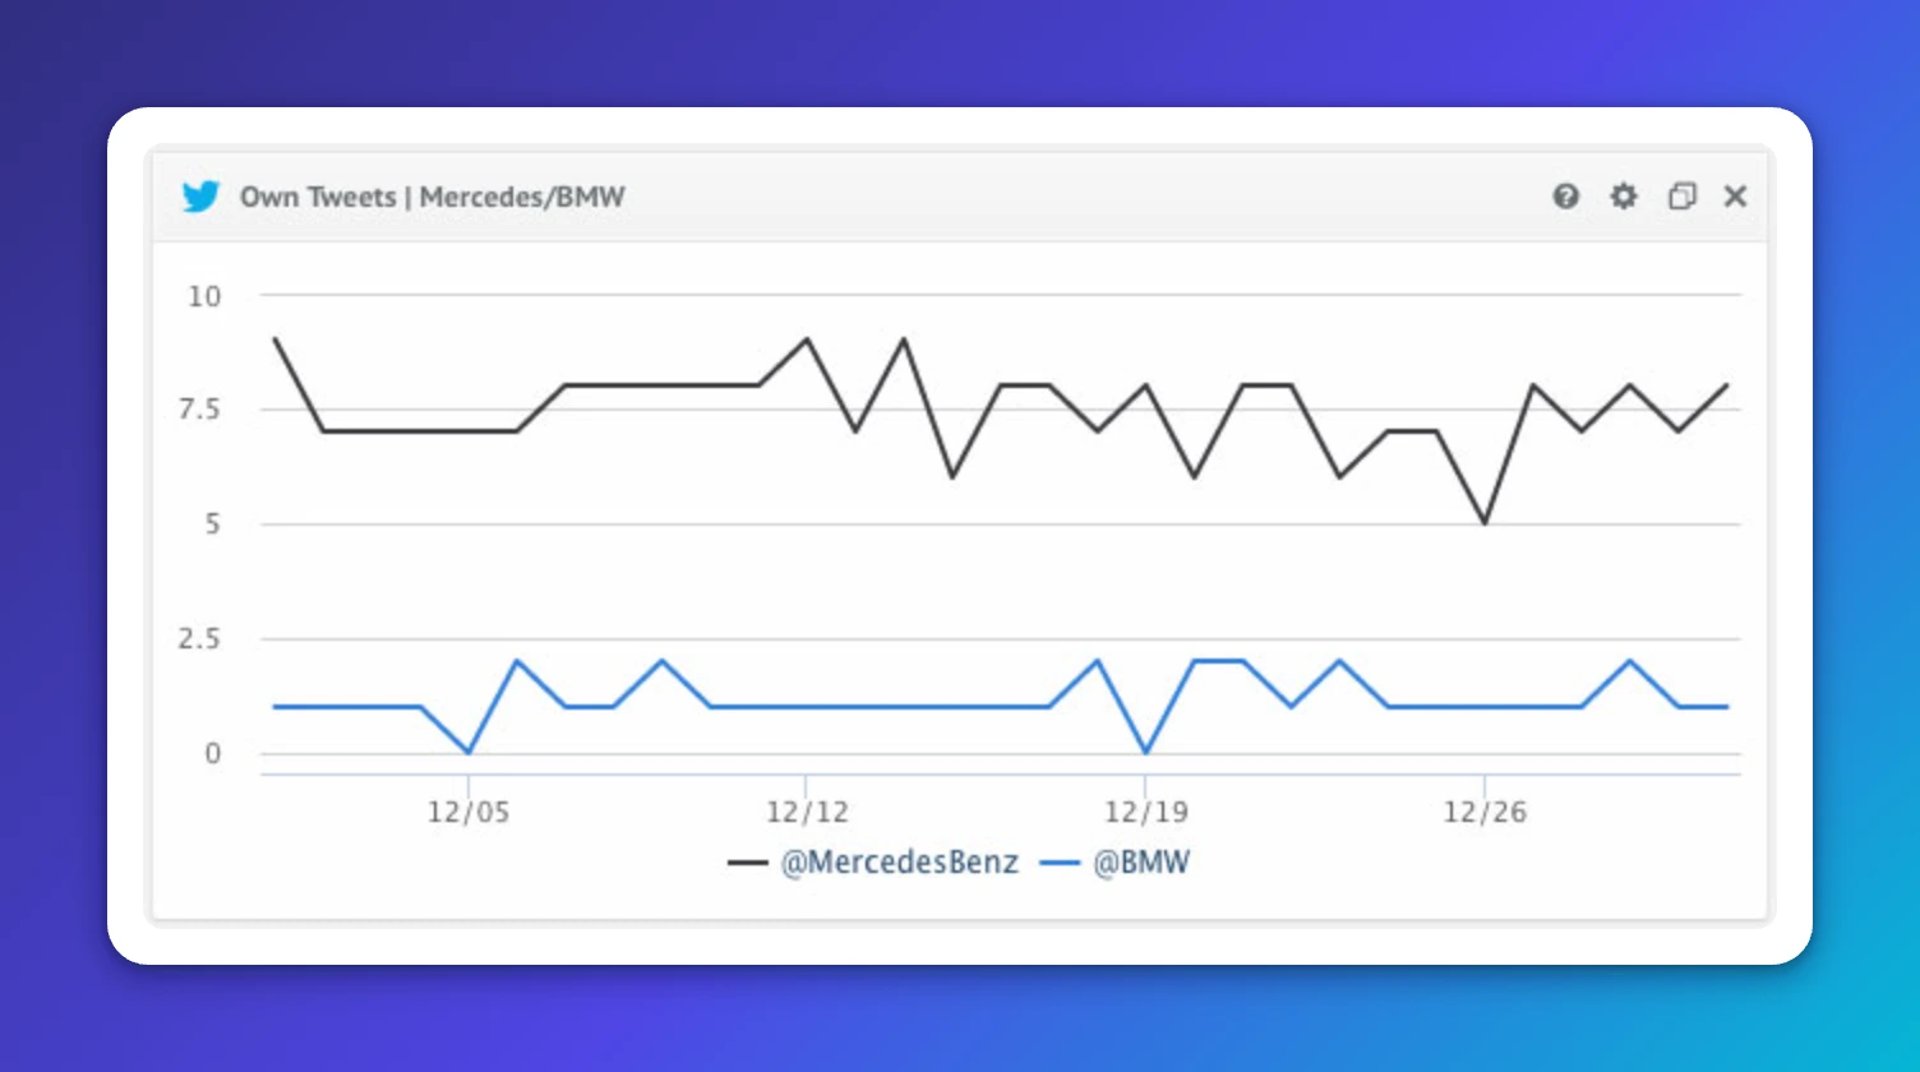
This KPI tracks how many posts you publish over a given period. It tells you whether you're hitting your content targets and how your output compares to competitors. In the example below, Mercedes posted more frequently than BMW over the same period.
Own Posts/Tweets by Time
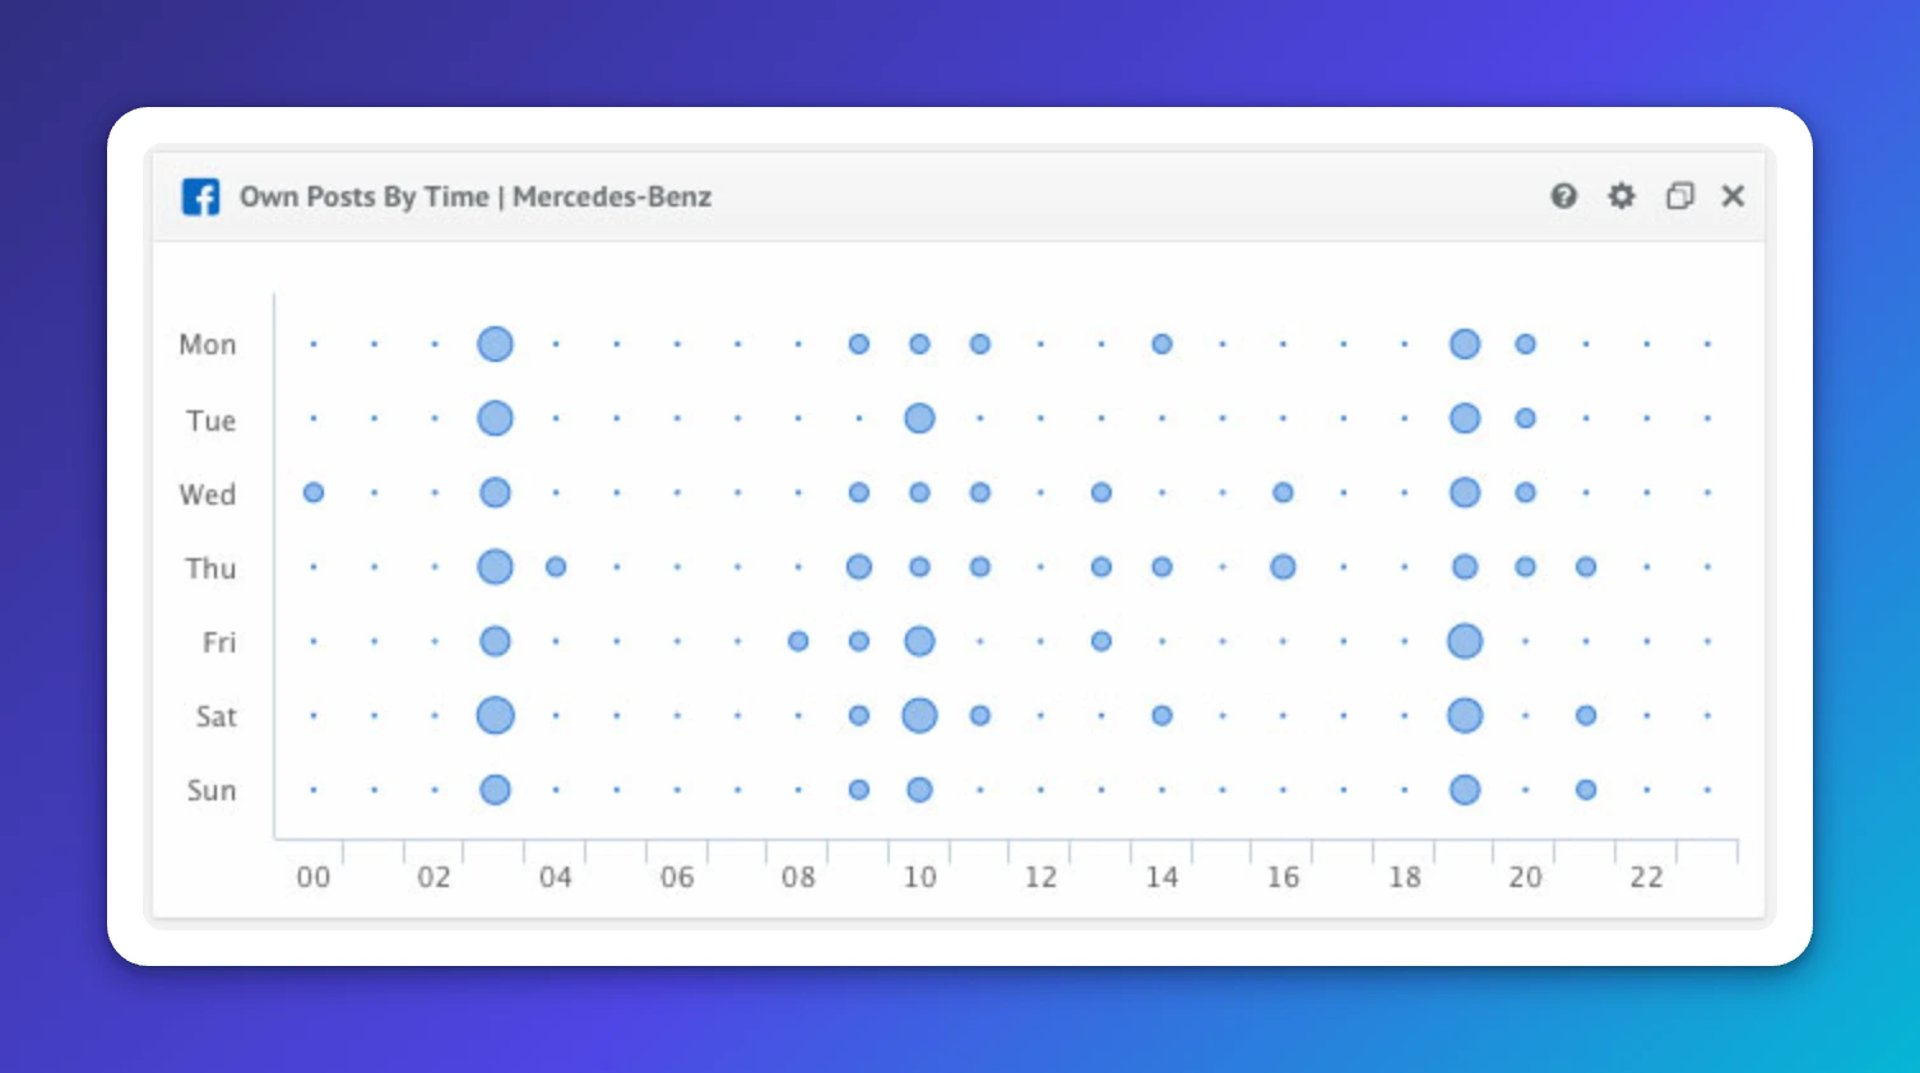
When you post matters, especially if your audience spans time zones. A bubble chart visualization shows not just when you post, but how often you post at any given hour. Mercedes-Benz, for example, consistently posted at 5am, around 10am, and around 7pm (Western European time).
Post Type Distribution
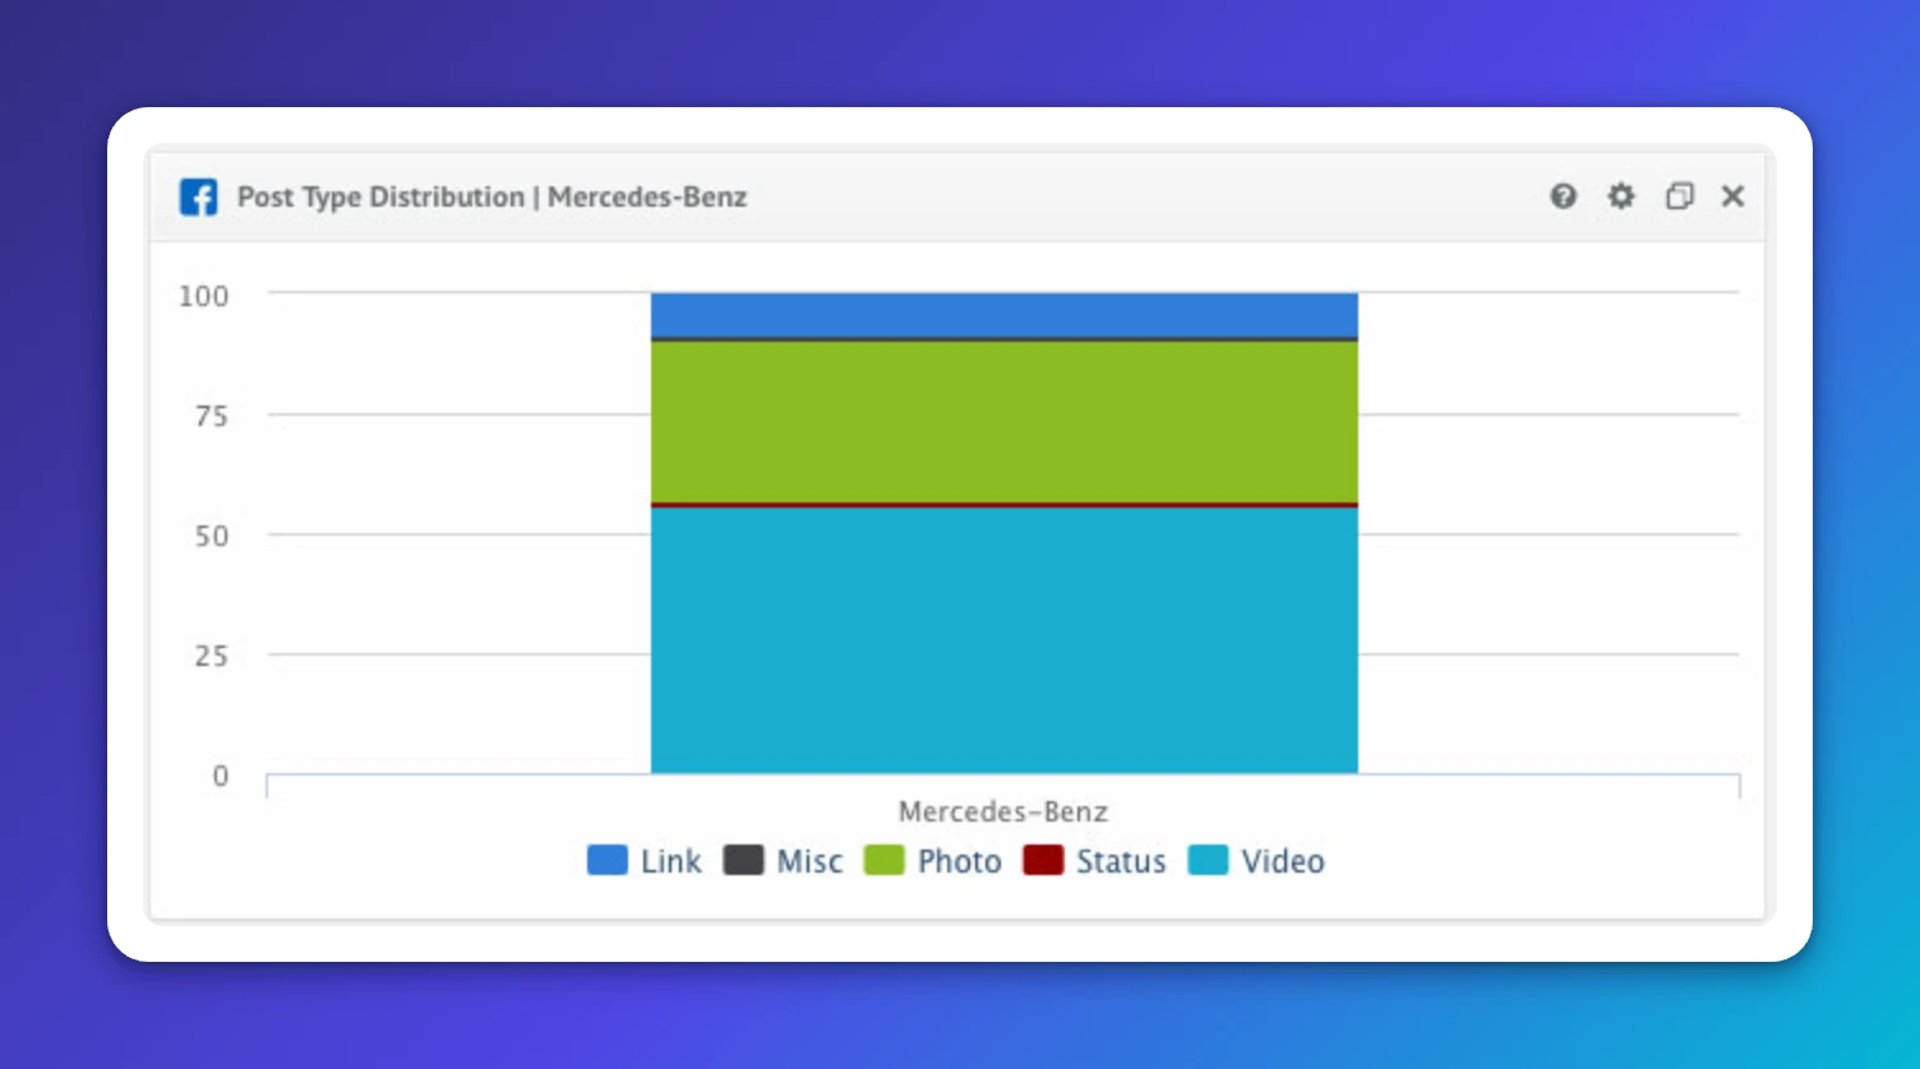
Knowing that you post regularly is one thing. Knowing what you post is another. This KPI breaks down your content by type: photos, videos, links, or text-only updates. Since some formats consistently outperform others, this view tells you whether your content mix reflects what actually works.
In the example below, more than 50% of posts are video. That's a sound strategy: video tends to drive more Facebook engagement than other content types.
Engagement metrics
Engagement metrics move beyond what you're doing and into what kind of impact you're making. These are the numbers that tell you whether your content is landing.
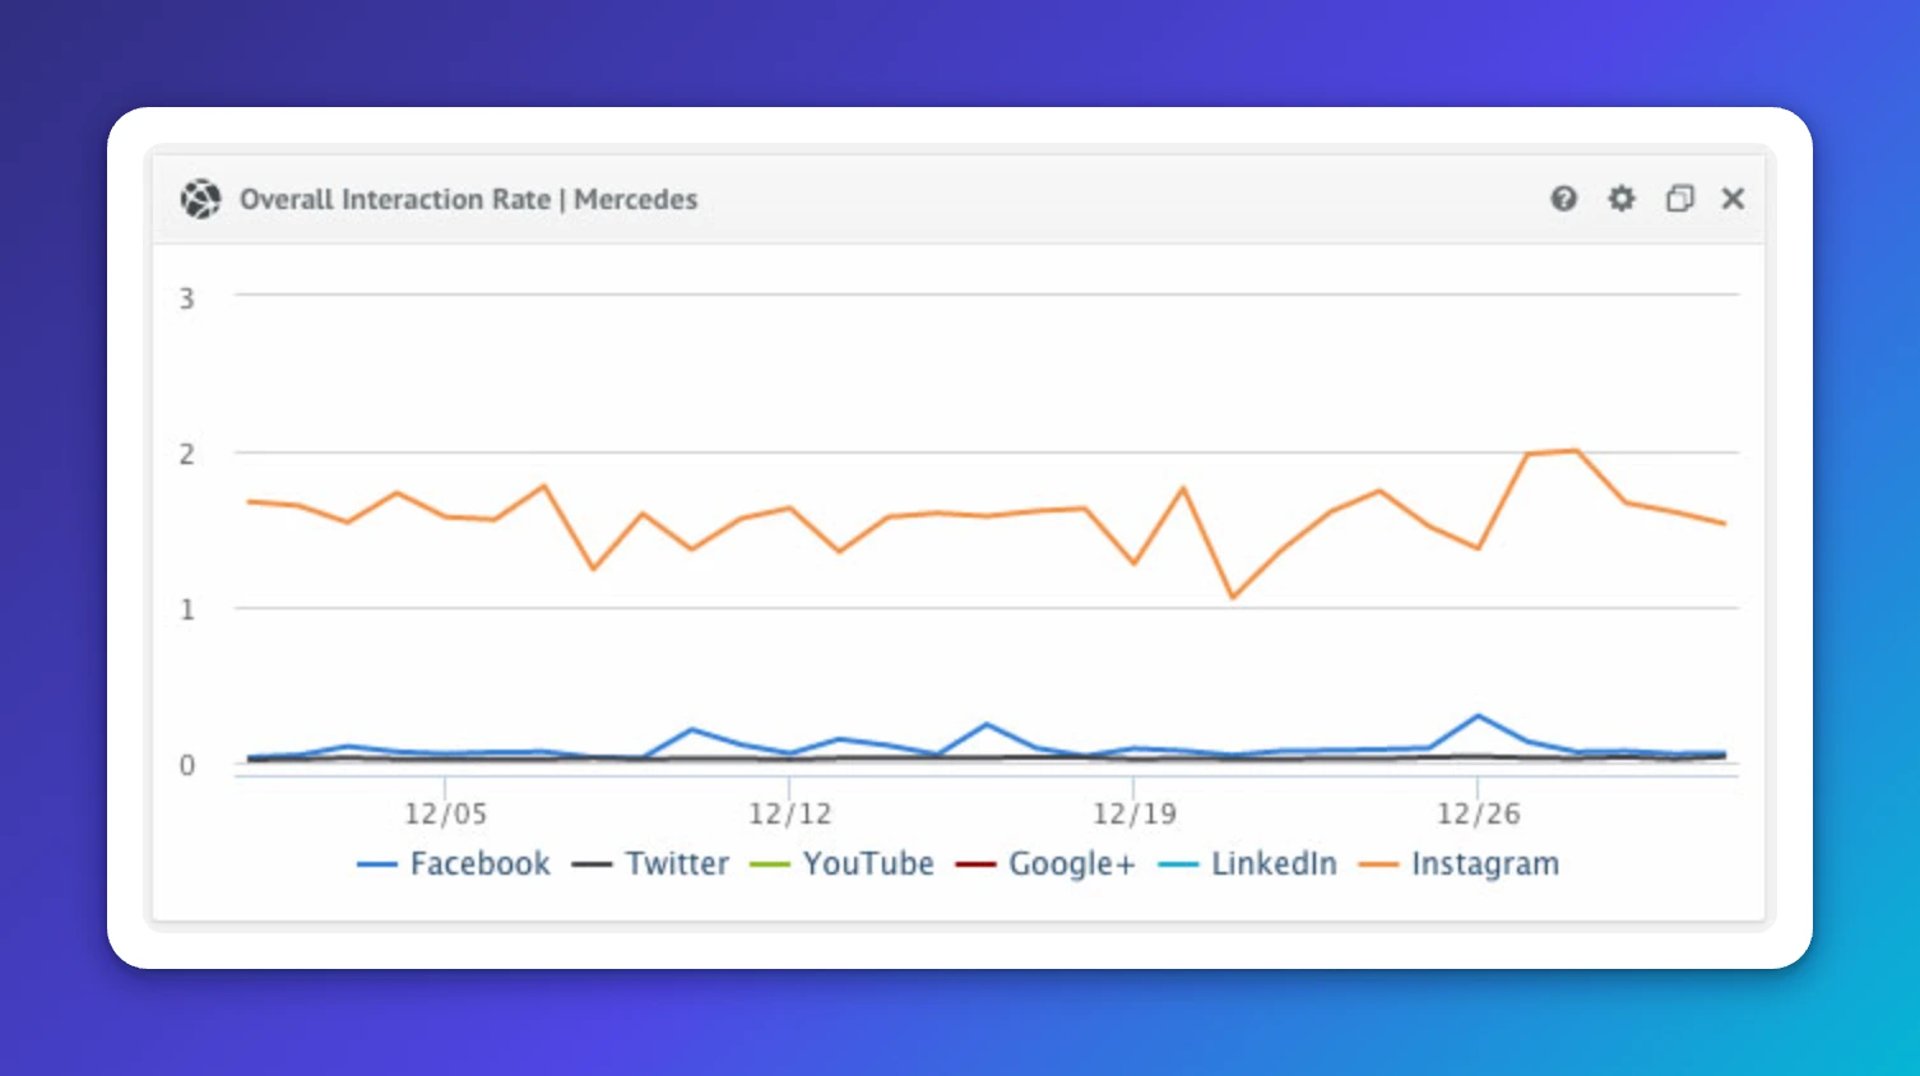
Overall Interaction Rate
This KPI shows total interactions by network, making it easy to see at a glance where your content creates the most response. It works for your own content and for benchmarking against competitors. In the example below, Instagram clearly leads on interactions across all channels tracked.
Interaction by Time
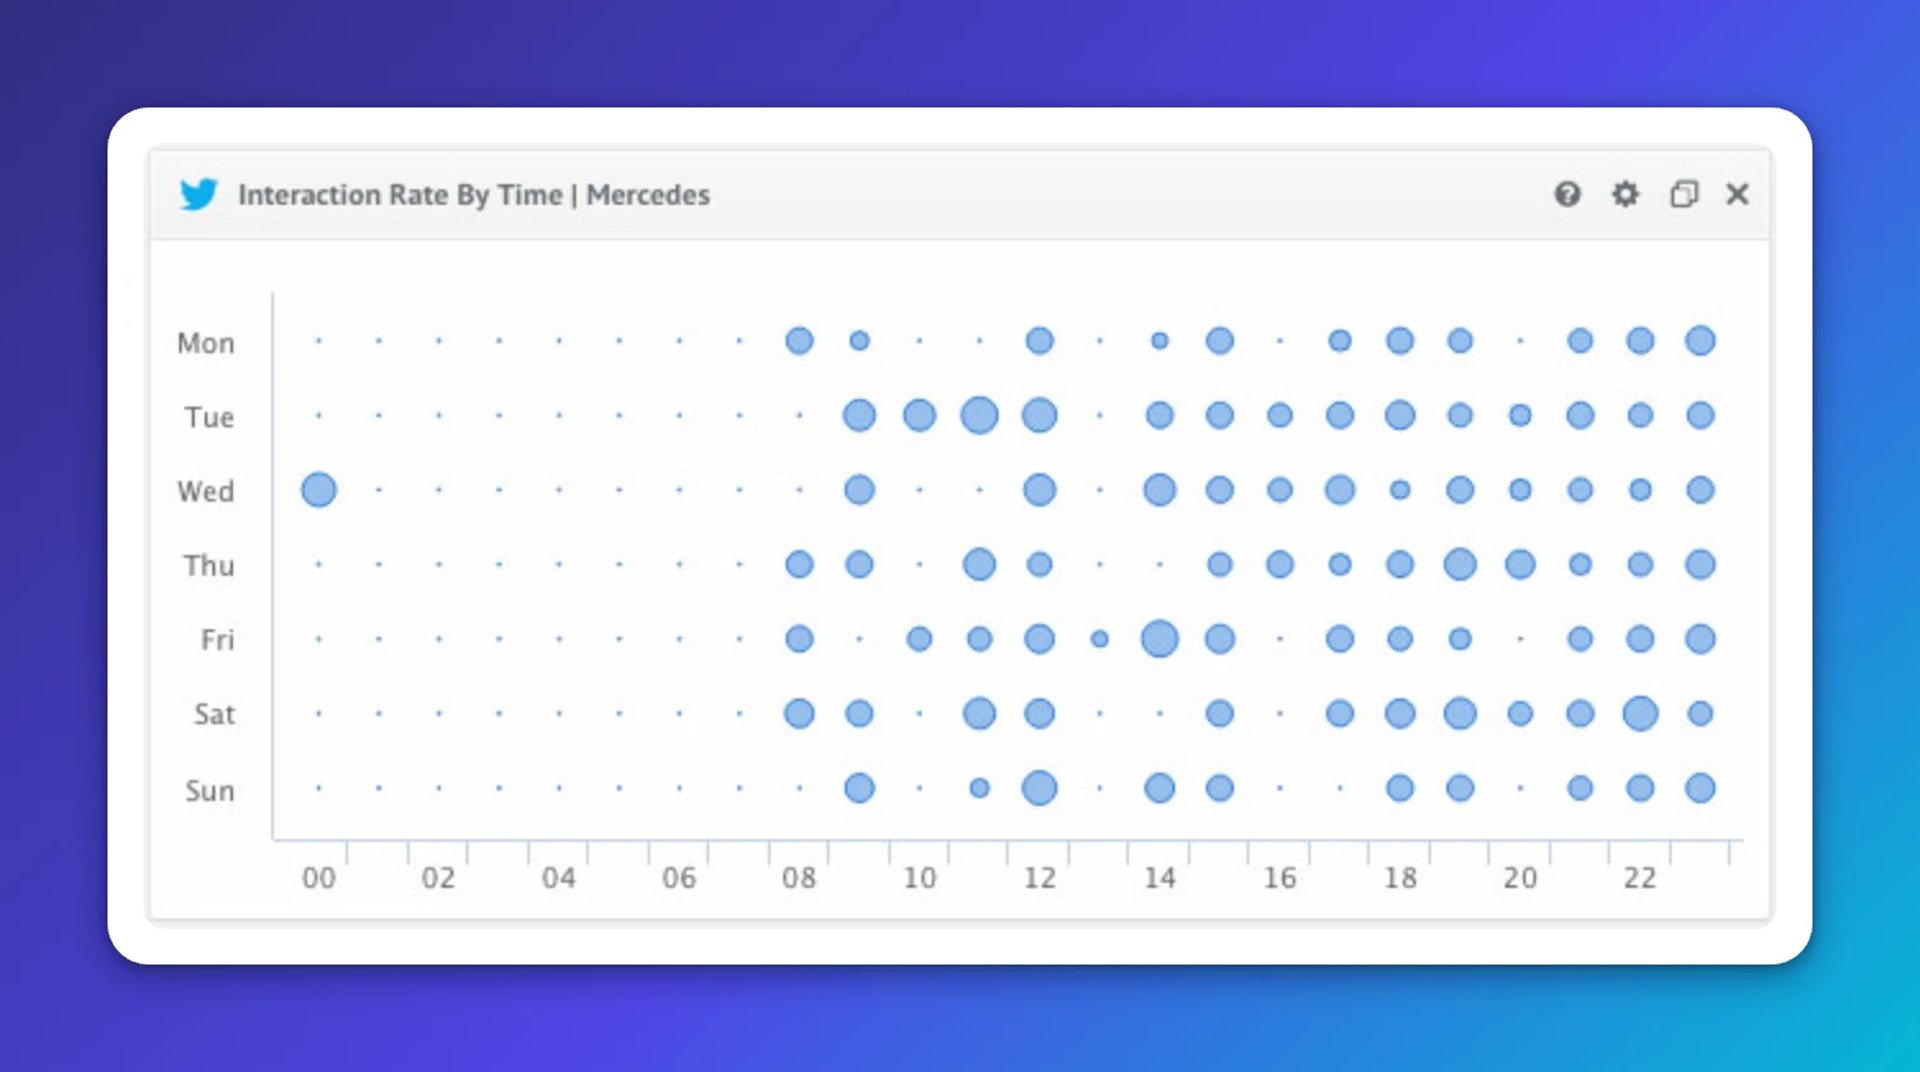
The best time to post depends on your industry, product, and audience. Tracking when your posts generate the most engagement removes the guesswork. For Mercedes, the data shows interactions peak in the evening.
Average Interaction per Post
This KPI goes one level deeper. Instead of looking at overall interaction totals, it shows how individual posts perform on average. That tells you which content is genuinely resonating, and which isn't worth the spend. Mercedes' Instagram posts, for example, consistently average more than 100,000 interactions each.
!Best Social Media KPIs - Interaction by Time
Create custom dashboards for you and your team.
Get started with KlipsChoosing the best social media KPIs for your team
There is no universal answer to which social media KPIs are best. There is only the best social media KPIs for your team's goals.
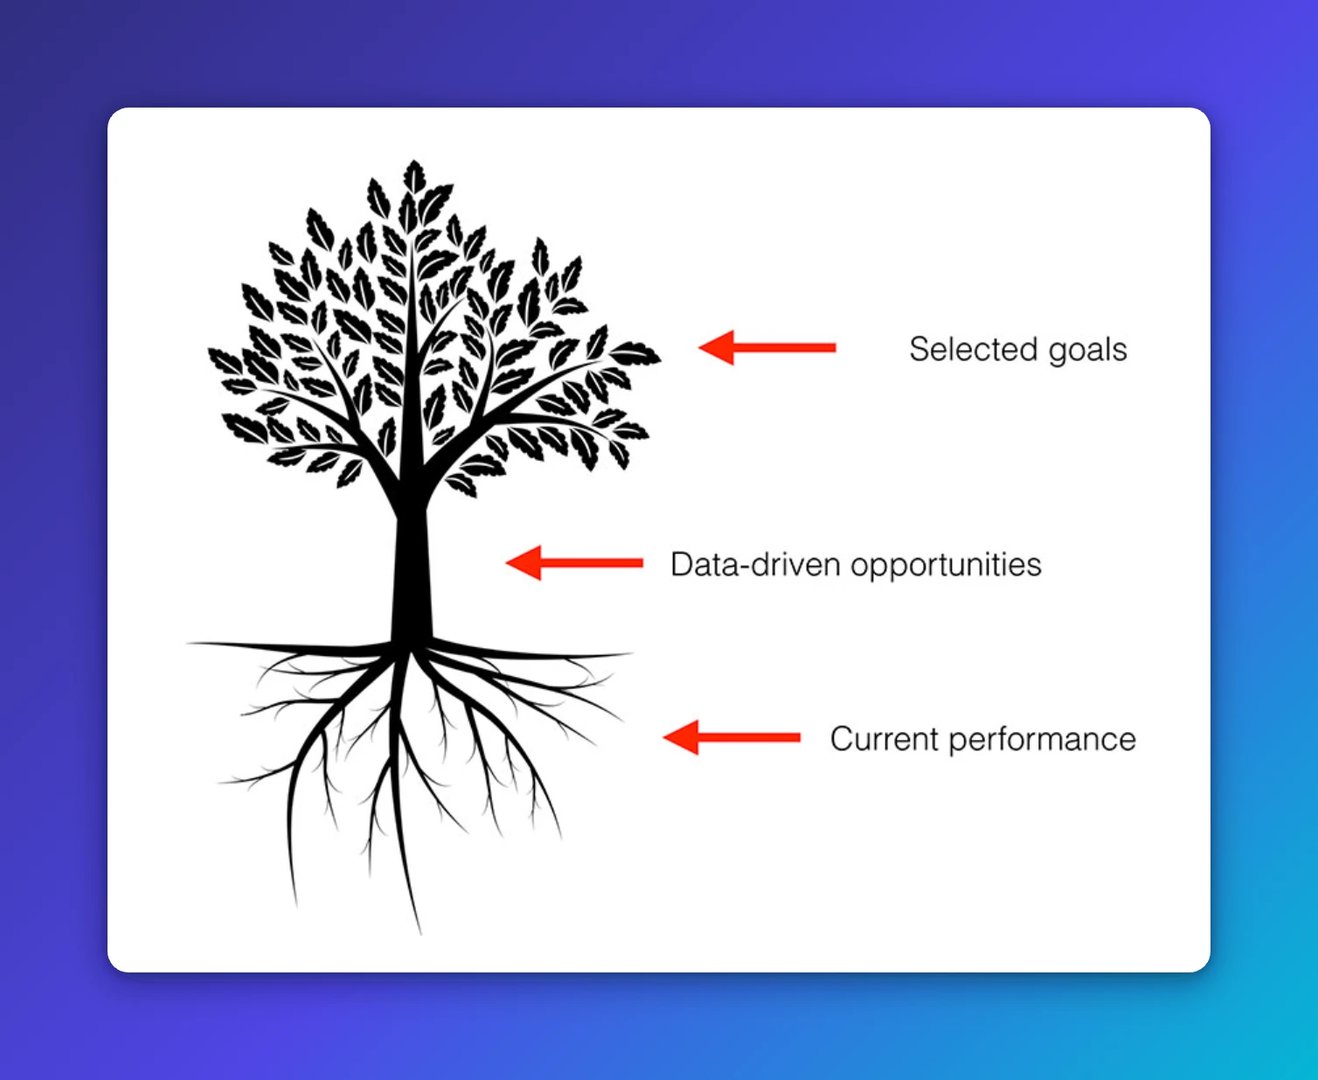
The three-step process works because it forces clarity before commitment. You assess where you are (roots), identify where the real opportunity sits (trunk), and then choose which opportunities to act on (crown). The result isn't a longer list of metrics. It's a shorter one you can actually trust and act on.
That confidence in your numbers matters more than the volume of them. When your team looks at a social media dashboard and knows exactly what each number means and what to do when it moves, that's when measurement stops being a reporting exercise and starts driving real decisions.
Note: Metrics screenshots were taken with quintly.
Updated 2026-09-09





Most recent
- SEP 25What SOC 2 taught a small team about trust
- SEP 15The AI race: progress, humanity, and trust
- SEP 9The good advisor
- AUG 11Beyond simple sign-ups: how True Trials and Activation predict growth
- JUL 7Why business leaders miss important trends in their dashboards
- JUN 19The best chart for the job: Visualizing data for non-technical users