
Summary - Google Analytics 4 (GA4) and its event-based model present a challenge for marketers who’ve always used Universal Analytics for their web analytics reporting. Third party dashboard tools like Klips can help you transition to GA4 without missing a beat – ensuring everyone on the team continues to have access to the data they need. This blog post shows you how to build GA4 web analytics dashboards using Klips.
From minor discrepancies in the data to a steeper-than-expected-learning curve, the transition from Universal Analytics (UA) to Google Analytics 4 (GA4) may present some unique challenges. For digital marketers and marketing agencies, this often means a barrage of inquiries from team members and stakeholders not familiar with GA4.
GA4 introduces an event-based data model, which may be familiar to user experience designers and product managers using tools like Mixpanel or Amplitude. However, for many marketers, this shift from a page-based to an event-based model is creating confusion in their data and dashboards. Have you noticed different metric counts when comparing conversions (GA4) to goal completions (UA)?
GA4 is more accurate because it counts multiple conversion events in a single session. Whereas, UA has a known issue when it comes to accurately tracking multiple goal completions. It’s human nature that when we see something unexpected, we pause and want to investigate. This is where 3rd party dashboard tools like Klips come in. Klips is particularly good at creating custom dashboards that give your team access to precise, curated views of your GA4 data. GA4 isn’t as user-friendly and self-service oriented as UA, so building this layer of reporting is a required step in your GA4 migration process.
Connecting Google Analytics 4 to Klips
To connect your Google Analytics 4 data to Klips, you will need to use the GA4 Query Explorer. We cover this topic in much more detail in this post: How to use the Google Analytics Query Explorer to export data.
Here’s what we’ll cover in this post:
- What is the GA4 Query Explorer and how does it work?
- How to use the GA4 Query Explorer
- Building queries in the GA4 Query Explorer
- Creating data sources in Klips
- Examples of Klips using GA4
What is the GA4 Query Explorer and how does it work?
The GA4 Query Explorer is a tool that allows you to query raw data from your GA4 properties. You can use it to create custom queries to extract specific data. Then, use those queries to set up automated data connections. After the query is executed in the GA4 Query Explorer, the results can be exported as a JSON file, which can then be used by a developer or a third party tool, such as Klips.
Here’s what the Query Explorer looks like with a basic setup:
How to use the GA4 Query Explorer
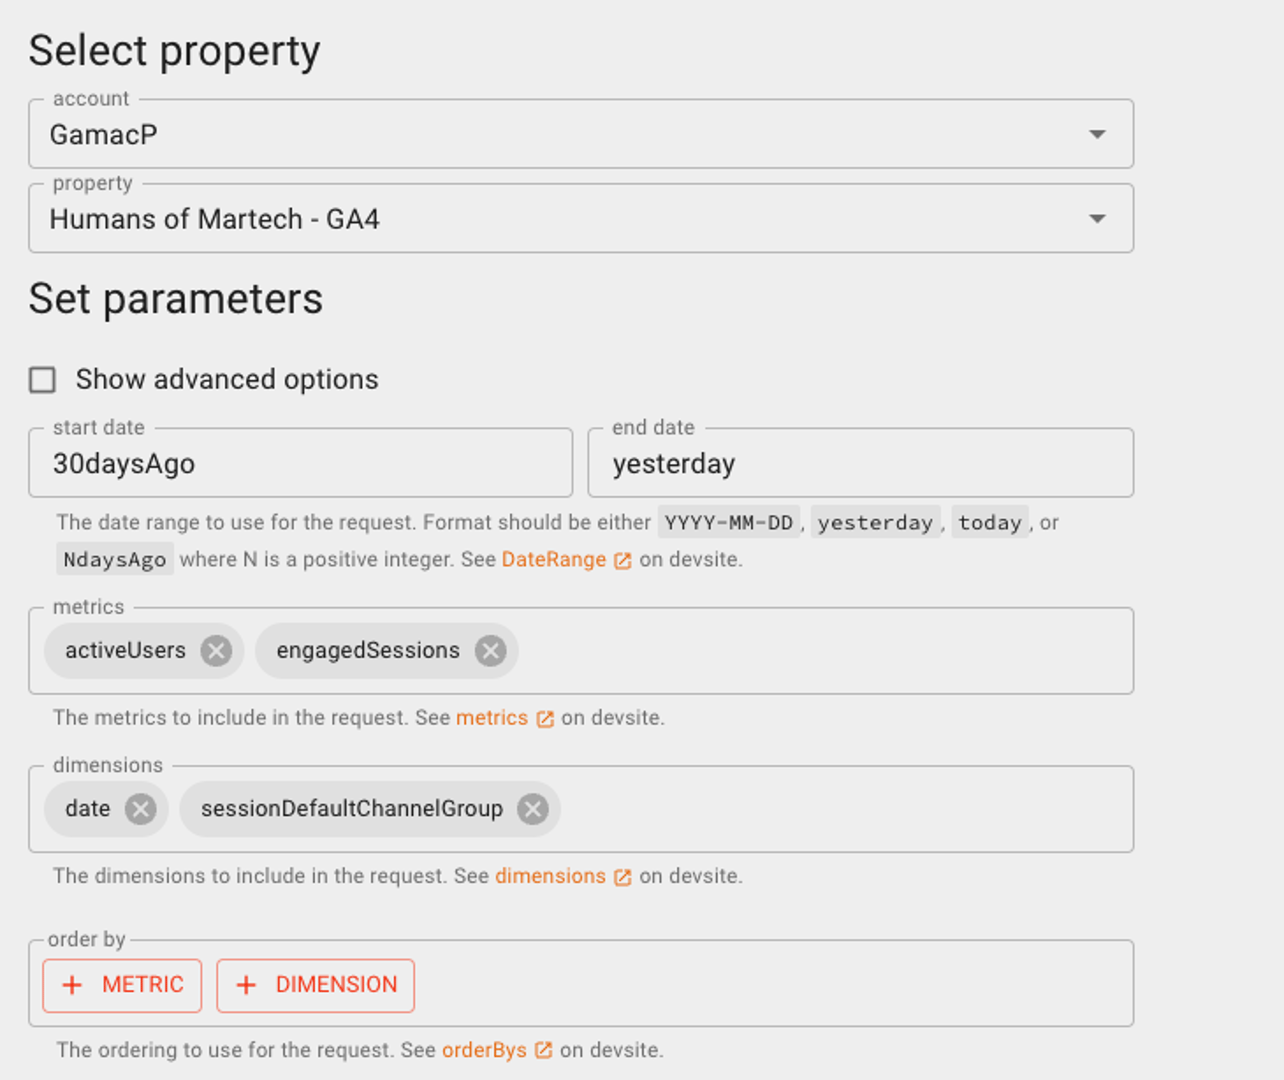
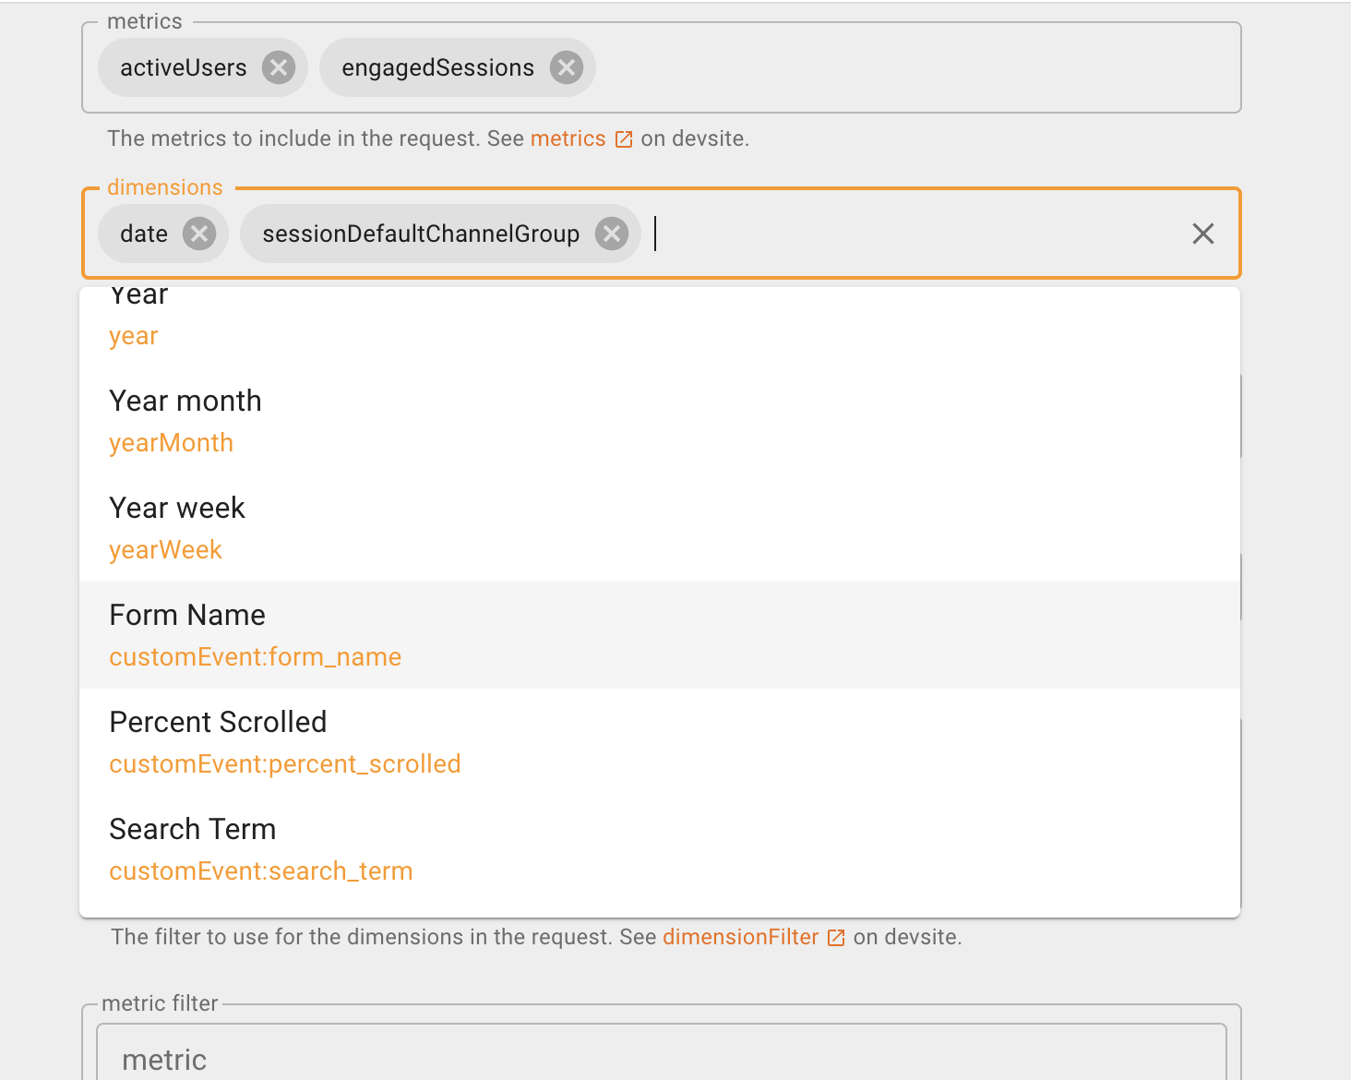
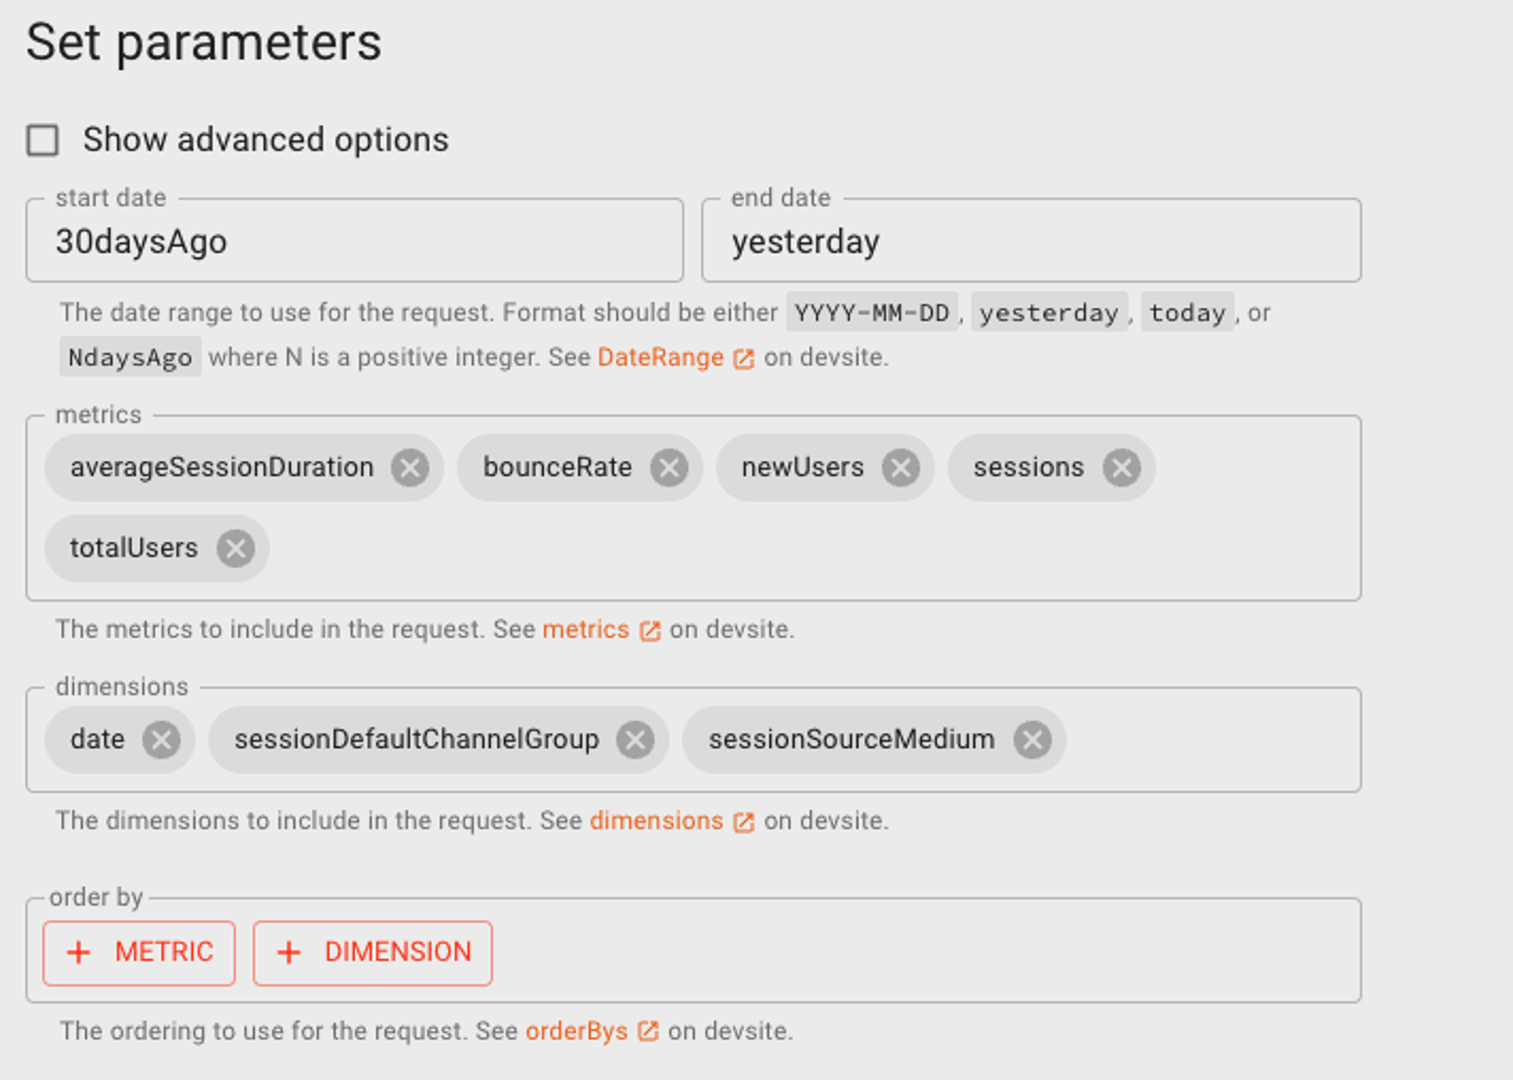
Using the GA4 Query Explorer is a straightforward process. The tool offers a simple user interface for crafting data queries specific to your reporting needs, allowing you to select metrics and dimensions from the menus. For instance, you can choose which custom and default dimensions to include in your query:
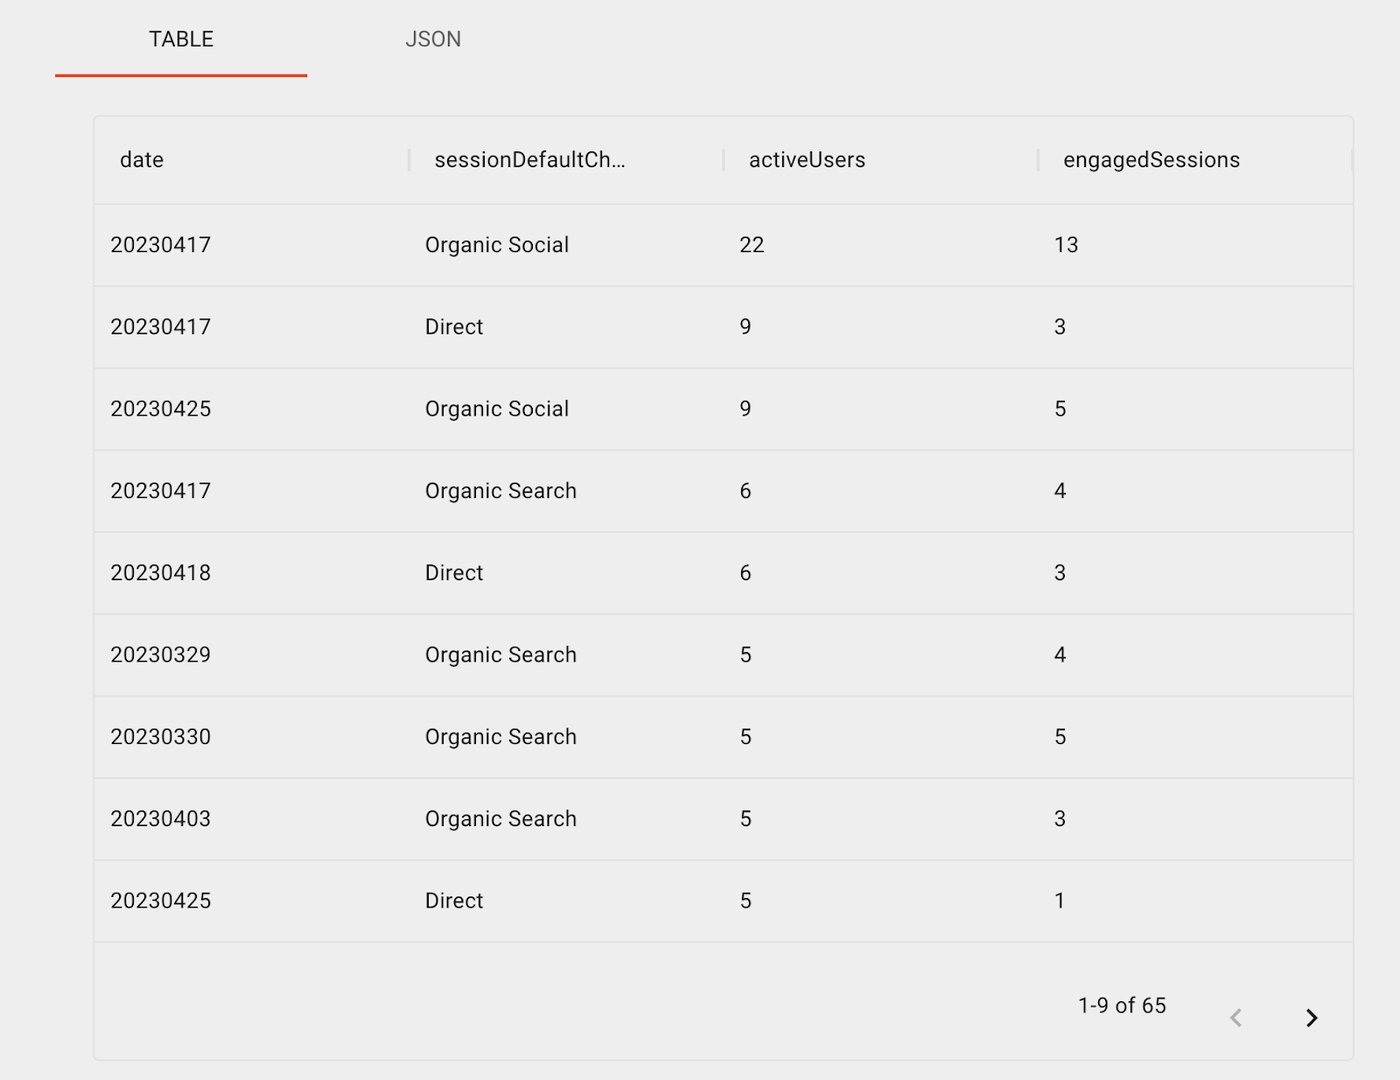
As you make selections from the menus, the Query Explorer generates the query in the background. You can test your query at any time to see the data output in a format that aligns with your data model. Whenever you modify the menu options, the query updates accordingly, and you can test it again.
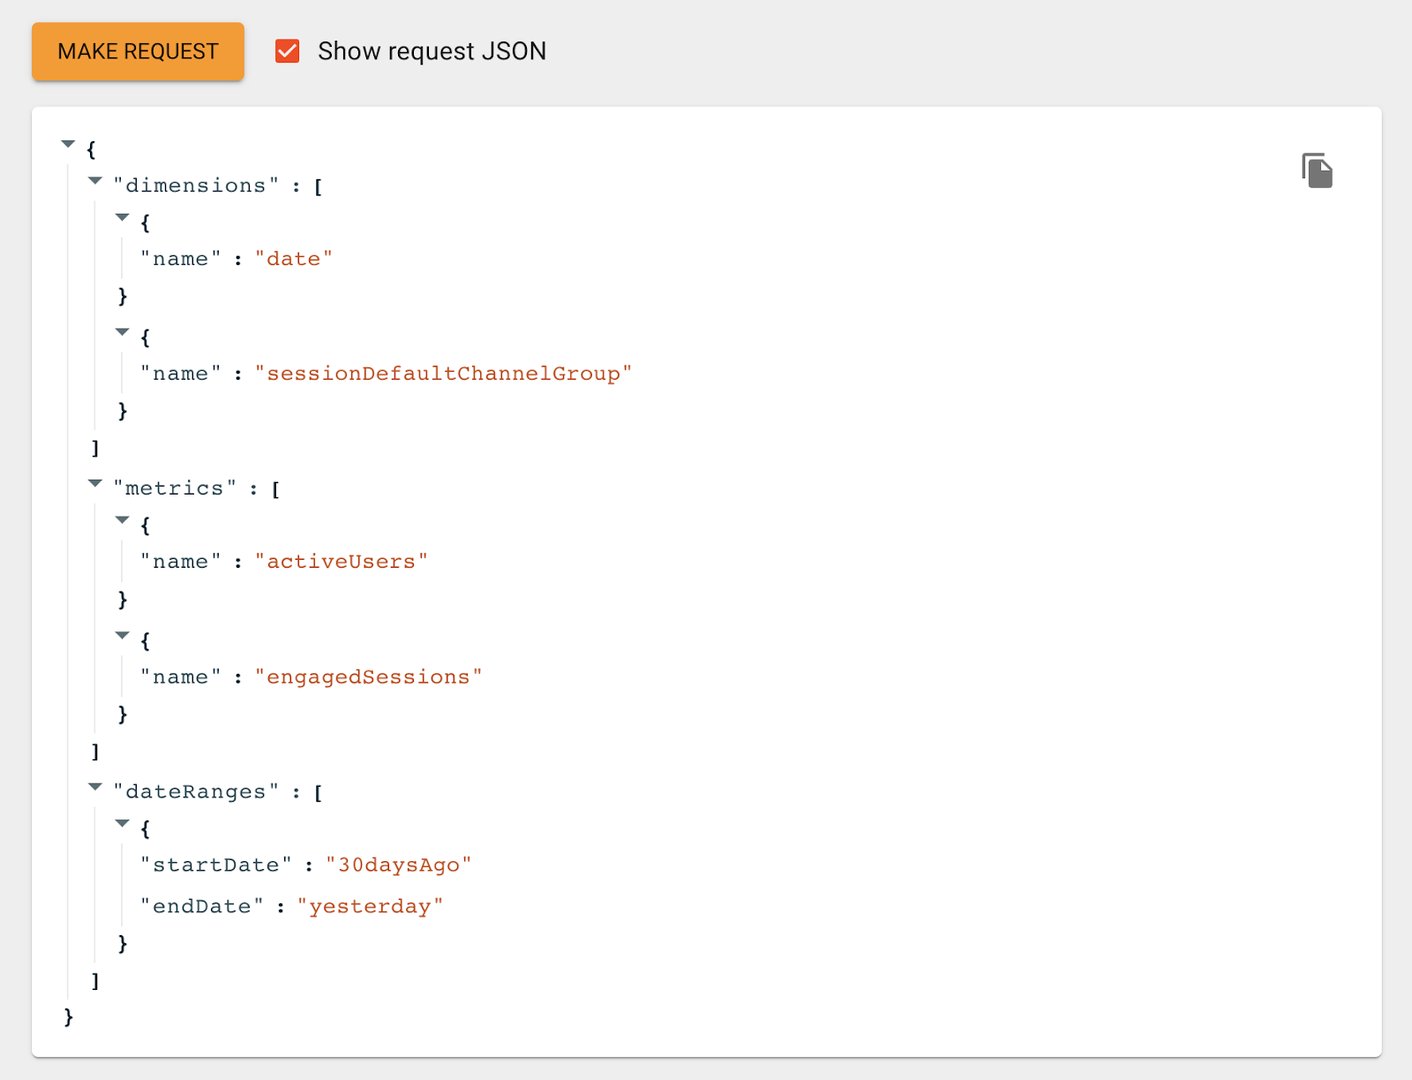
Here’s what a sample output might look like:
To see the underlying code that the Query Explorer generated based on your input, select the “Show request JSON” option. This code can be copied and pasted for your developers or used to create a Google Analytics 4 data source in Klips.
Building queries in the GA4 Query Explorer
One of the benefits of the Query Explorer is the ability to construct tailored data queries without any coding expertise. Features like metric filters and dimension filters give you the ability to refine your datasets to build custom reports and dashboards. Here’s an overview of the query building features currently available.
Input | Description |
Date Range | Specifies the time period for which the data is to be extracted. The user can select the start and end date using the recommended format (DateRange Documentation). |
Metrics | Quantitative measurements such as active number of users or engaged sessions. |
Dimensions | Qualitative values such as date, session default grouping, or country. |
Order by | Allows users to sort the data based on the selected metric in either ascending or descending order. |
Metric Aggregations | Allows users to aggregate metric data by specifying a mathematical function such as SUM or AVG. |
Dimension Filter | Enables filtering the data based on the selected dimension(s) with match type rules including RegEx. |
Metric Filter | Enables filtering the data based on the selected metric(s) with match type rules including RegEx. |
Limit | Sets a limit on the number of rows returned by the query, useful when working with large datasets. |
JSON Request | Displays the query JSON request string. |
Response | Displays the query results in Table or JSON format. |
Creating data sources in Klips
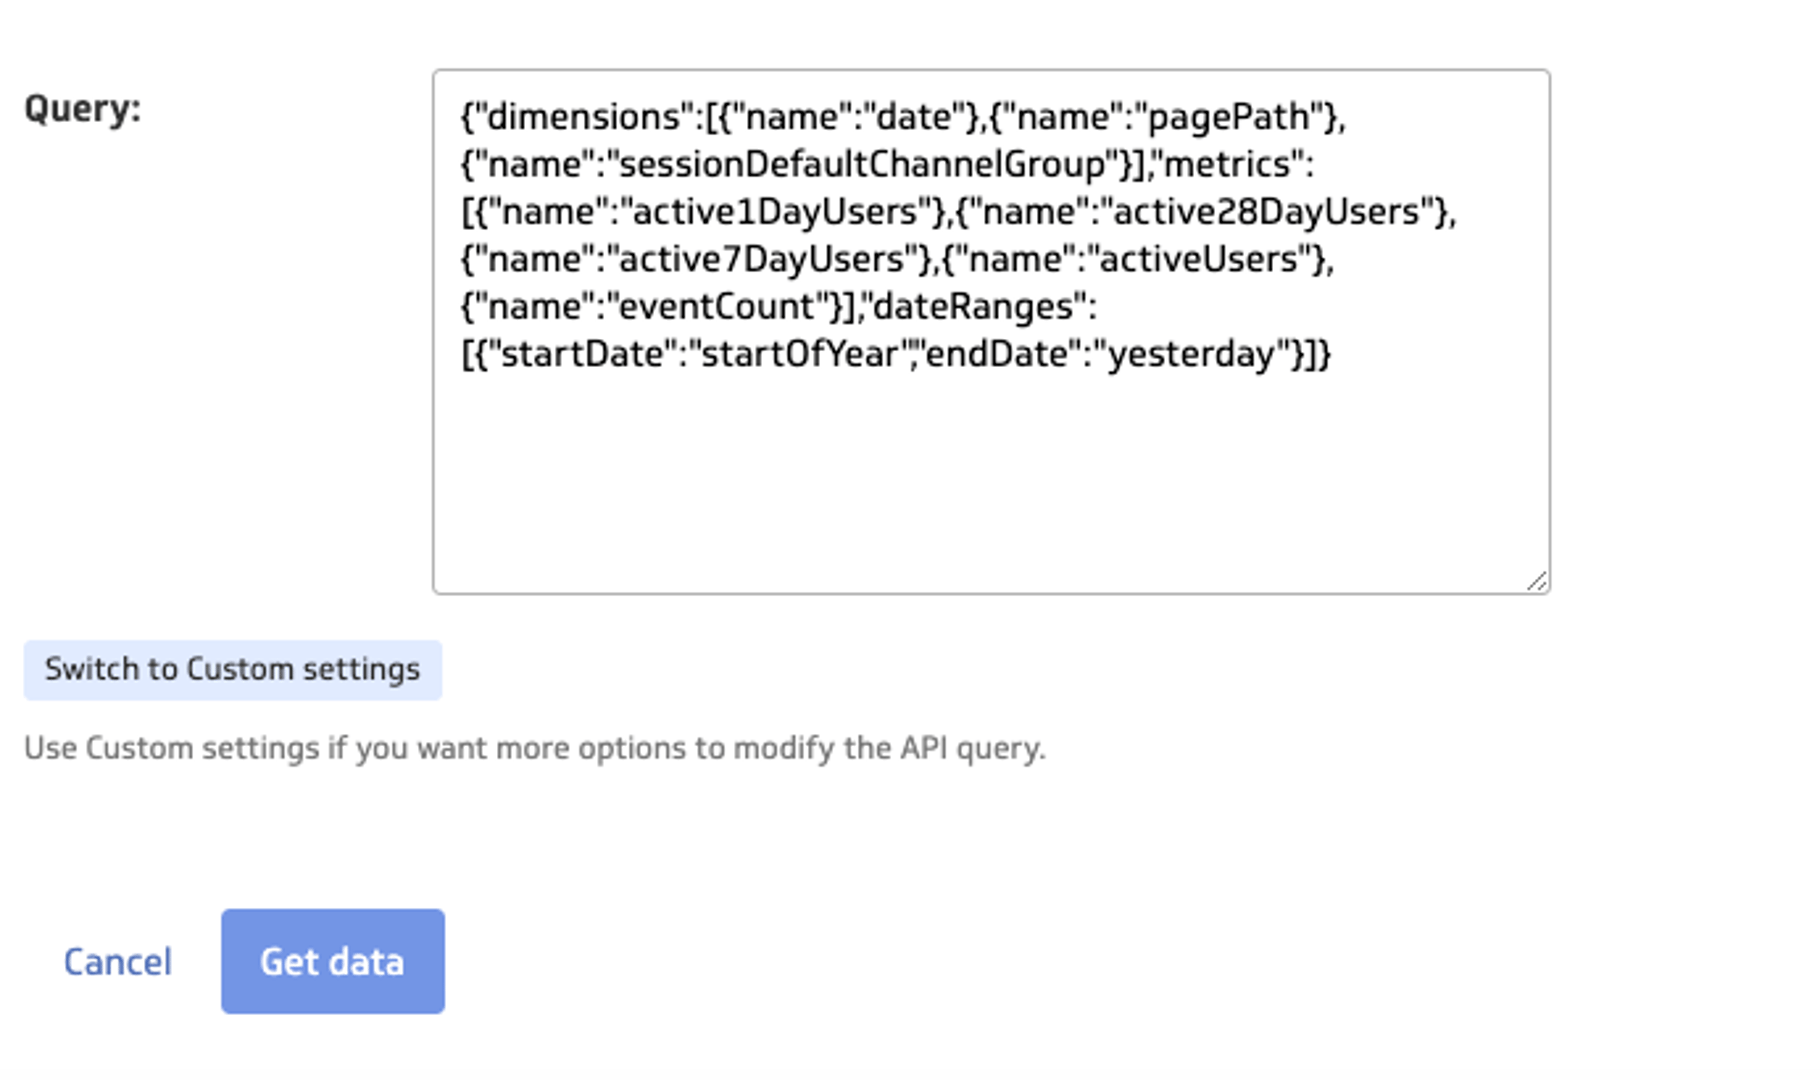
Creating a GA4 data source in Klips uses the query you built in the Query Explorer tool. Clicking the "Make Request" button in the Query Explorer executes your query. A sample output then displays under the snippet.
To create a GA4 data source in Klips, copy this code snippet and paste it into the "Query" field, as shown below. Here’s an in-depth article on this process.
Once your data source is created, it can be transformed or refined by generating a data model. From here, you’ve got the groundwork to start building custom GA4 dashboards.
GA4 Klips templates examples
Transitioning from Universal Analytics to Google Analytics can be a bit of a process. Our GA4 Klip templates are a quick path to getting started. You can add any of these Klips to your account by clicking the {Add this Klip Button} from the Klip Gallery in your account.
We’ve also given information about how the query was constructed so you can use it to craft your own custom GA4 queries.
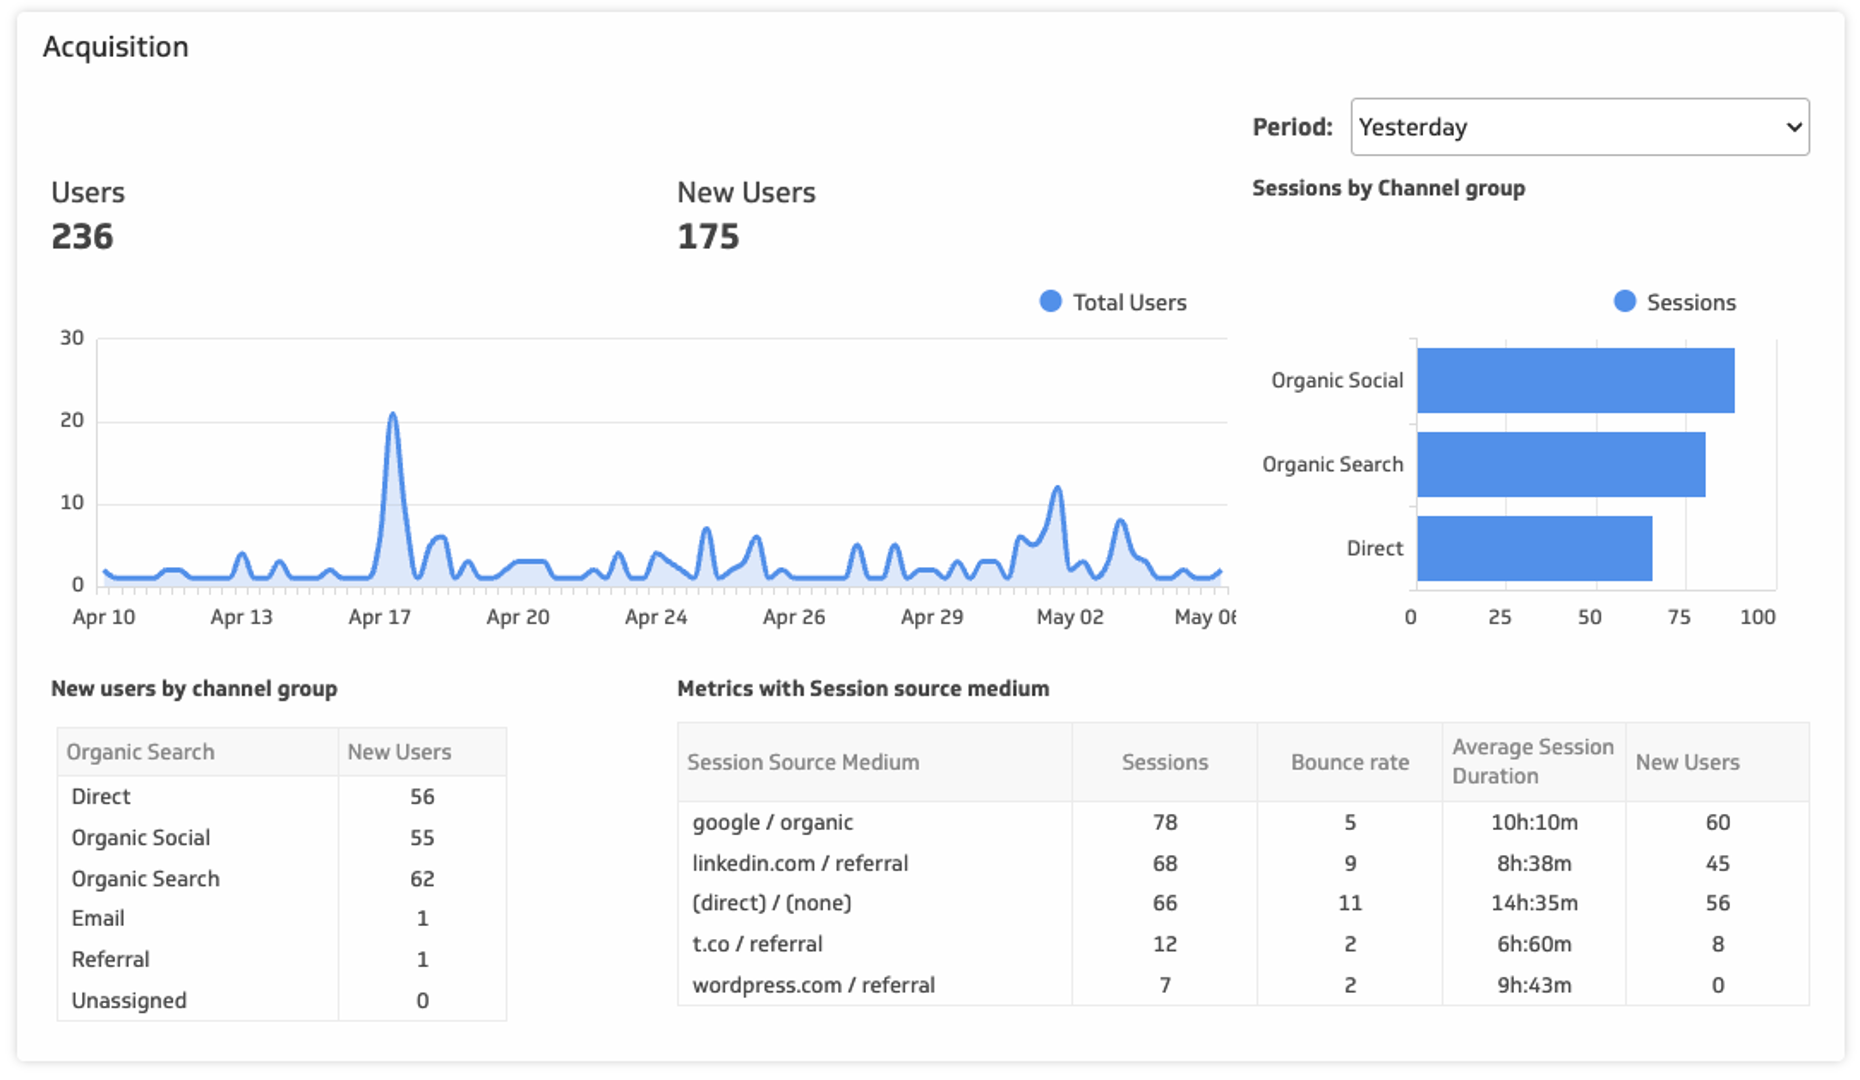
Acquisition by Channel
The first step for marketing attribution is understanding where your web users come from. This query breaks down traffic acquisition by channel and session/medium, and provides metrics to help evaluate each channel's performance.
GA4 Query Explorer Tip | Details |
Query Description | Get insights into your web performance by acquisition channel. |
Metrics | Users, New Users, Sessions, Bounce Rate, Session Duration, Revenue |
Dimensions | Channel Grouping, Date, Source Medium |
Code Snippet | {"dimensions":[{"name":"date"},{"name":"sessionDefaultChannelGroup"},{"name":"sessionSourceMedium"}],"metrics":[{"name":"users"},{"name":"newUsers"},{"name":"sessions"},{"name":"bounceRate"},{"name":"sessionDuration"},{"name":"revenue"}],"dateRanges":[{"startDate":"30daysAgo","endDate":"yesterday"}]} |
Here’s an example of what you can build with this data. Use this Acquisitions GA4 Klip Template:
Conversion Metrics
Conversion tracking is as important in GA4 as it was in Universal Analytics. Conversion setup is based exclusively on event tracking – so you’ll want to include data about the types of events generating conversions. This basic query is really the tip of the iceberg when it comes to conversion tracking in GA4, especially if you’re using custom dimensions.
GA4 Query Explorer Tip | Details |
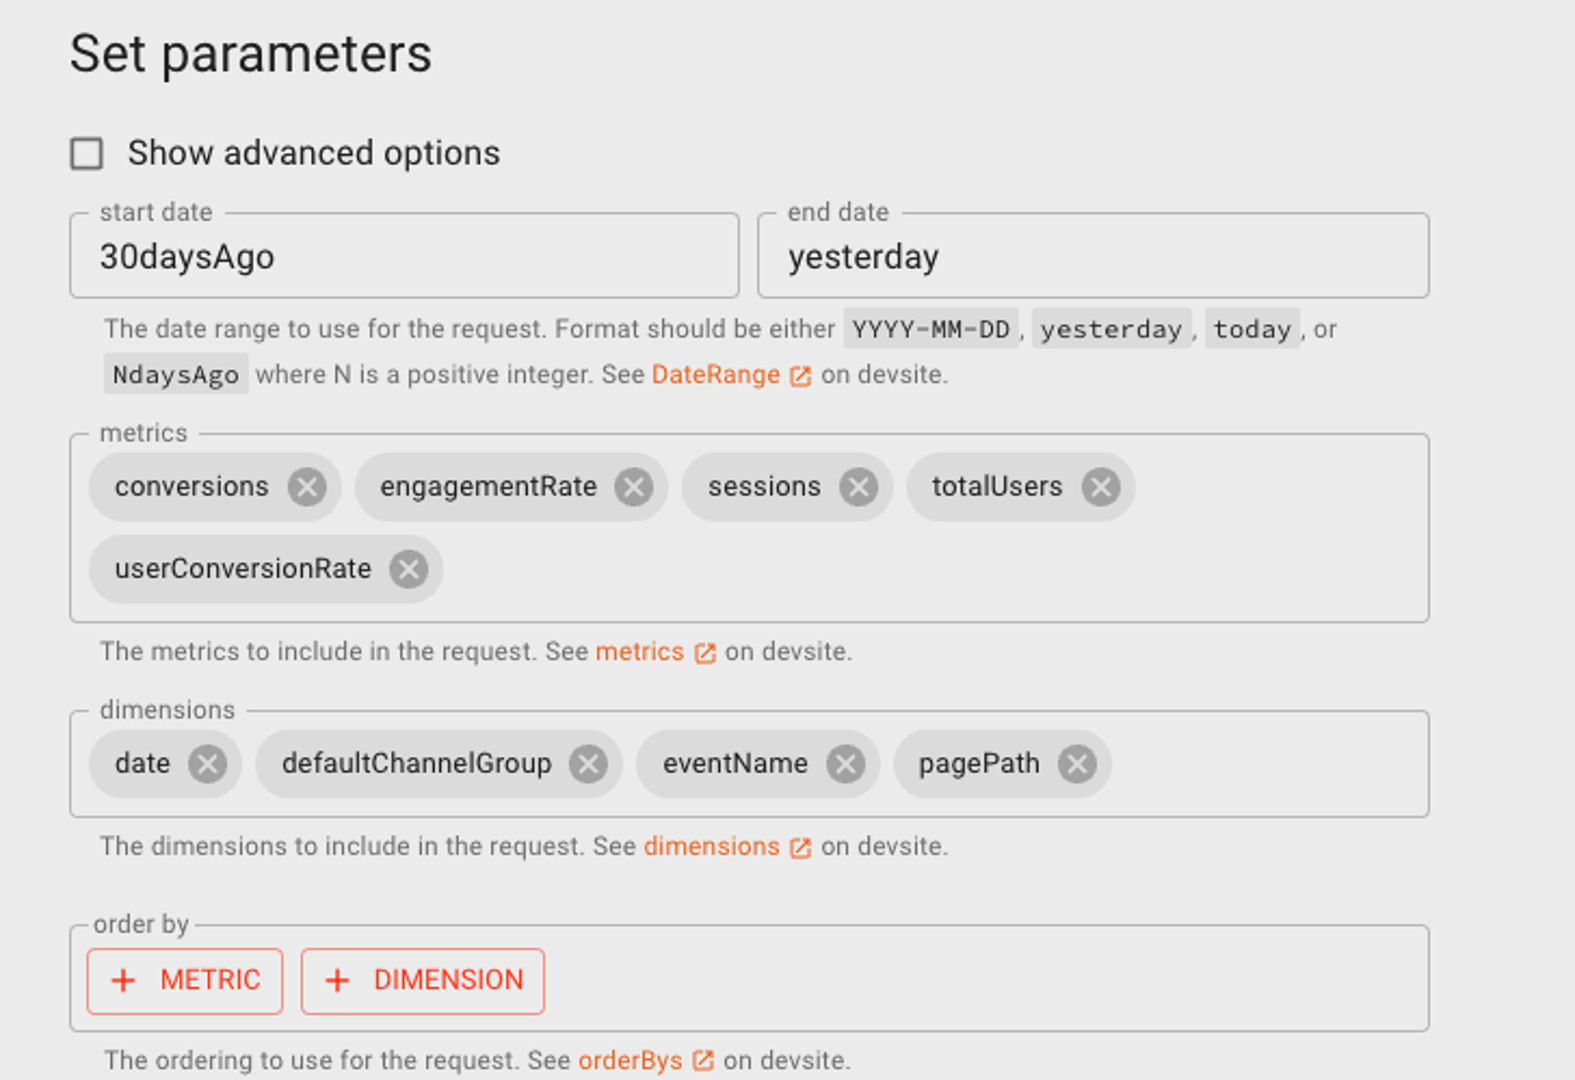
Query Description | Track conversions and split them out by web channel, event name, and page location. |
Metrics | Conversions, Engagement Rate, Sessions, Total Users, User Conversion Rate |
Dimensions | Date, Default Channel Group, Event Name, Page Path |
Code Snippet | {"dimensions":[{"name":"date"},{"name":"defaultChannelGroup"},{"name":"eventName"},{"name":"pagePath"}],"metrics":[{"name":"conversions"},{"name":"engagementRate"},{"name":"sessions"},{"name":"totalUsers"},{"name":"userConversionRate"}],"dateRanges":[{"startDate":"30daysAgo","endDate":"yesterday"}]} |
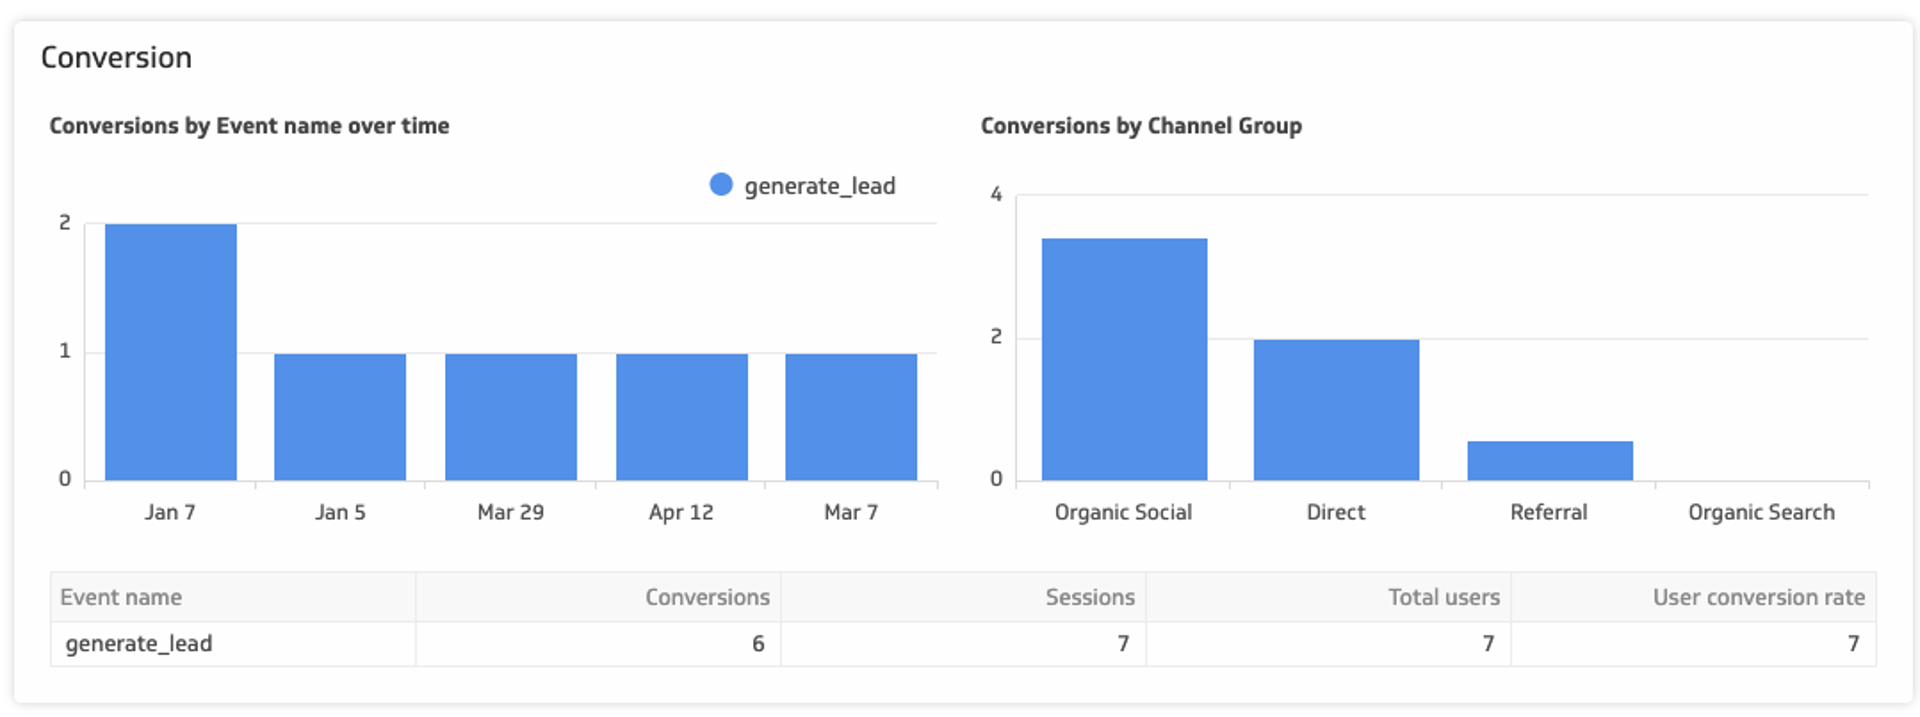
Here’s an example of what you can build with this data. Use this Conversion GA4 Klip Template:
Landing Page Views
Google Analytics 4 improves tracking for single-page applications (SPAs) which have gained popularity in the web development world with the rise of frameworks like React and Vue. These improvements, however, come with a learning curve with revised metrics like engagement rate or screen page views. This query aims to provide a basic report on your landing page views.
GA4 Query Explorer Tip | Details |
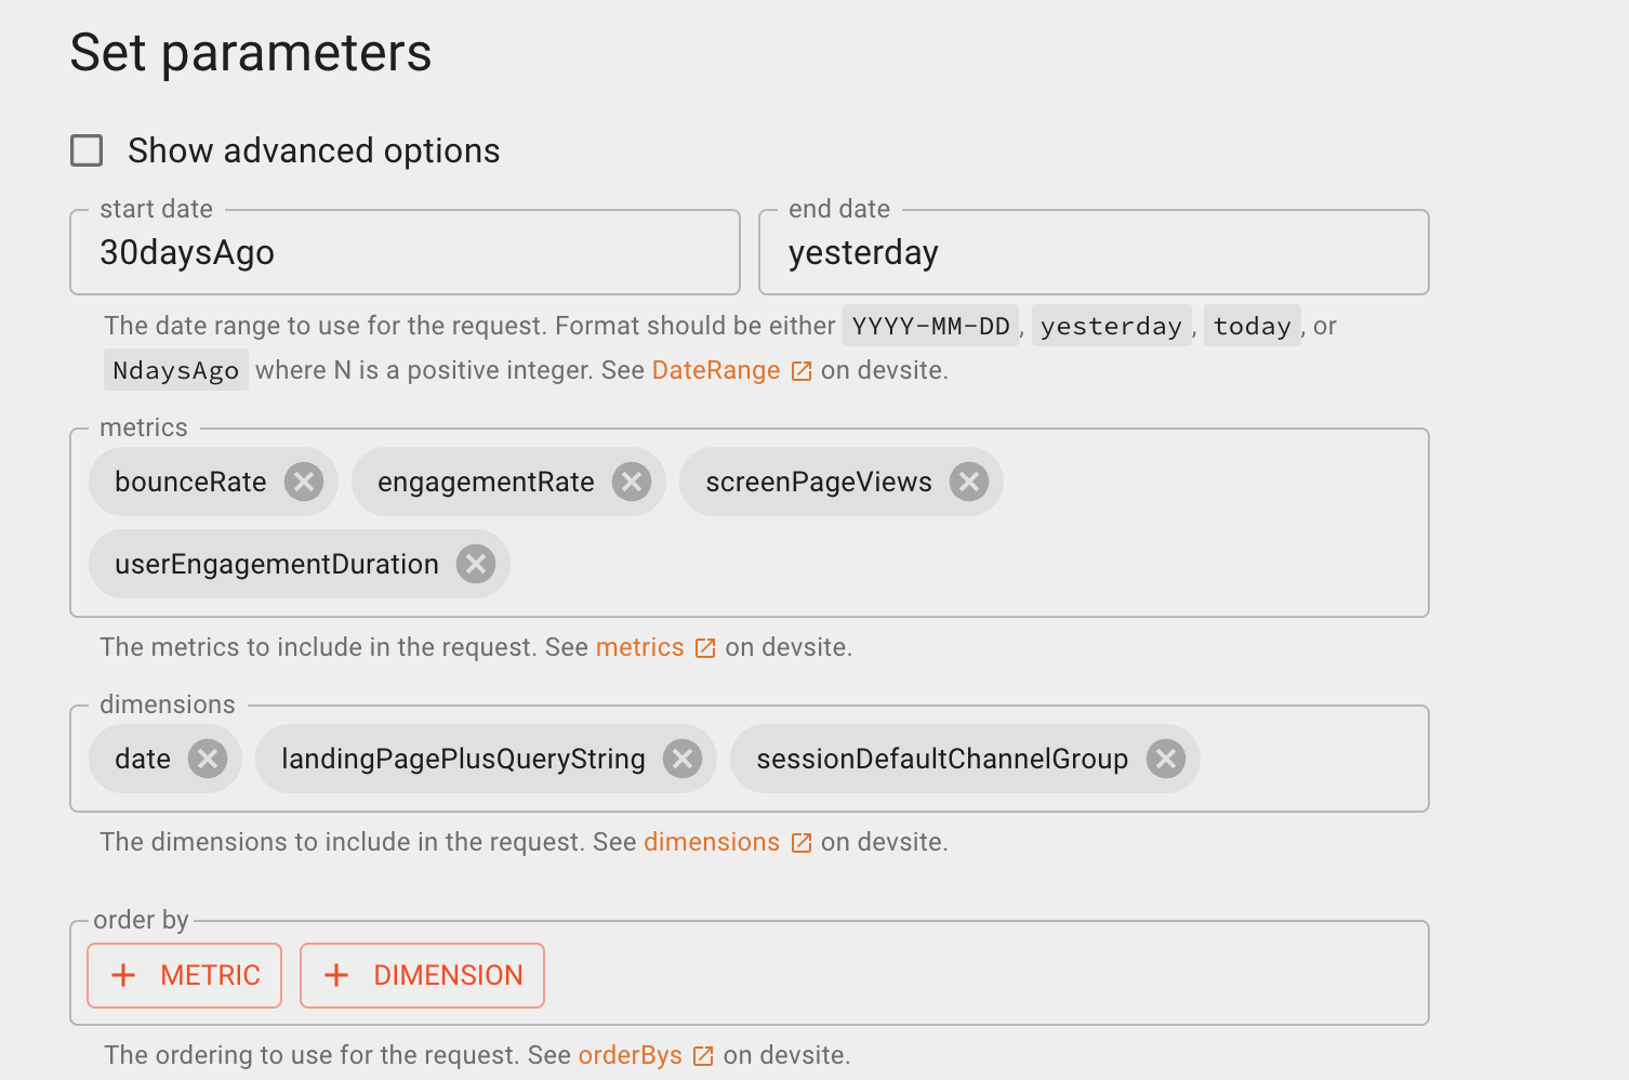
Query Description | Get metrics on landing page performance and user engagement. |
Metrics | Bounce Rate, Engagement Rate, Screen Page Views, User Engagement Duration |
Dimensions | Date, Landing Page Plus Query String, Session Default Channel Group |
Code Snippet | {"dimensions":[{"name":"date"},{"name":"landingPagePlusQueryString"},{"name":"sessionDefaultChannelGroup"}],"metrics":[{"name":"bounceRate"},{"name":"engagementRate"},{"name":"screenPageViews"},{"name":"userEngagementDuration"}],"dateRanges":[{"startDate":"30daysAgo","endDate":"yesterday"}]} |
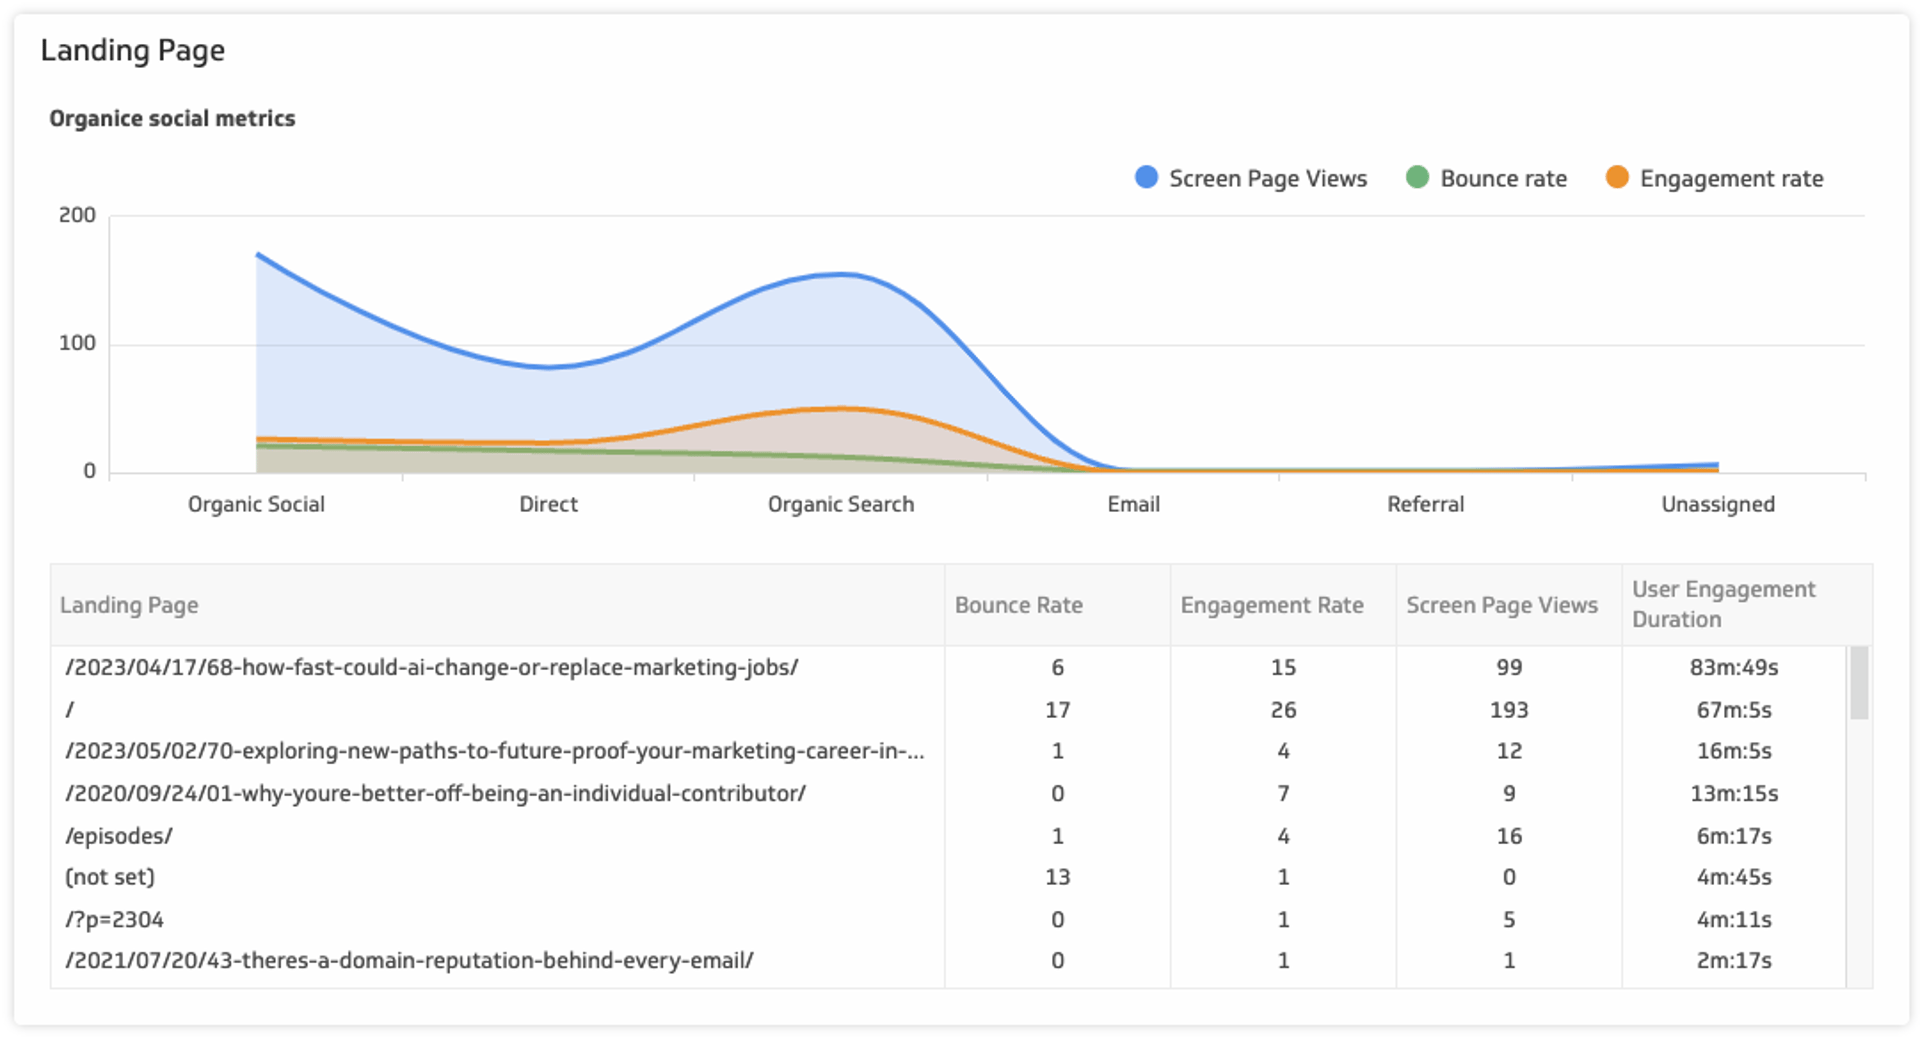
Here’s an example of what you can build with this data. Use this Landing Pages GA4 Klip Template:
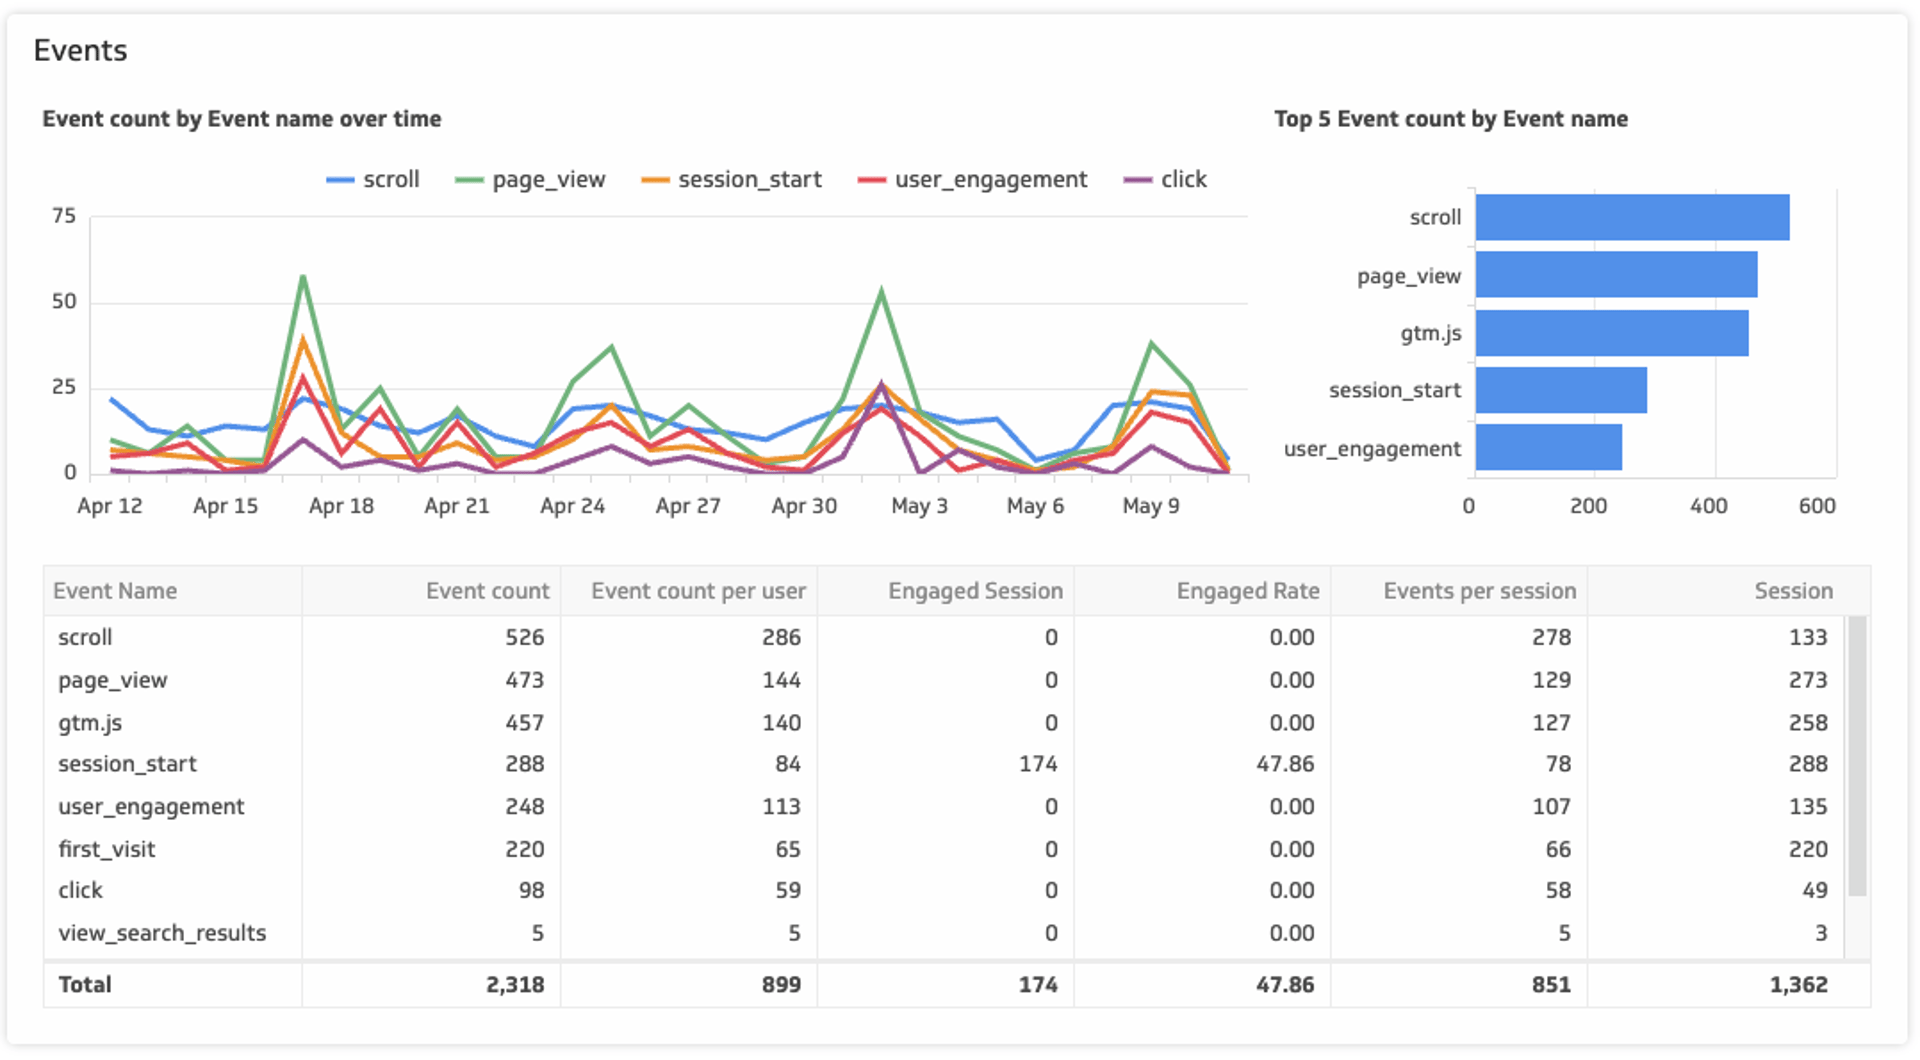
Event Metrics
The event-driven data model for GA4 allows for more robust event analysis than was ever possible in Universal Analytics. With those robust features comes customizations, such as configuring custom events or sending event parameters to GA4. This query is meant to give you a good starting point for GA4 event analysis – remember, you will want to register custom dimensions in order to use them in your reports.
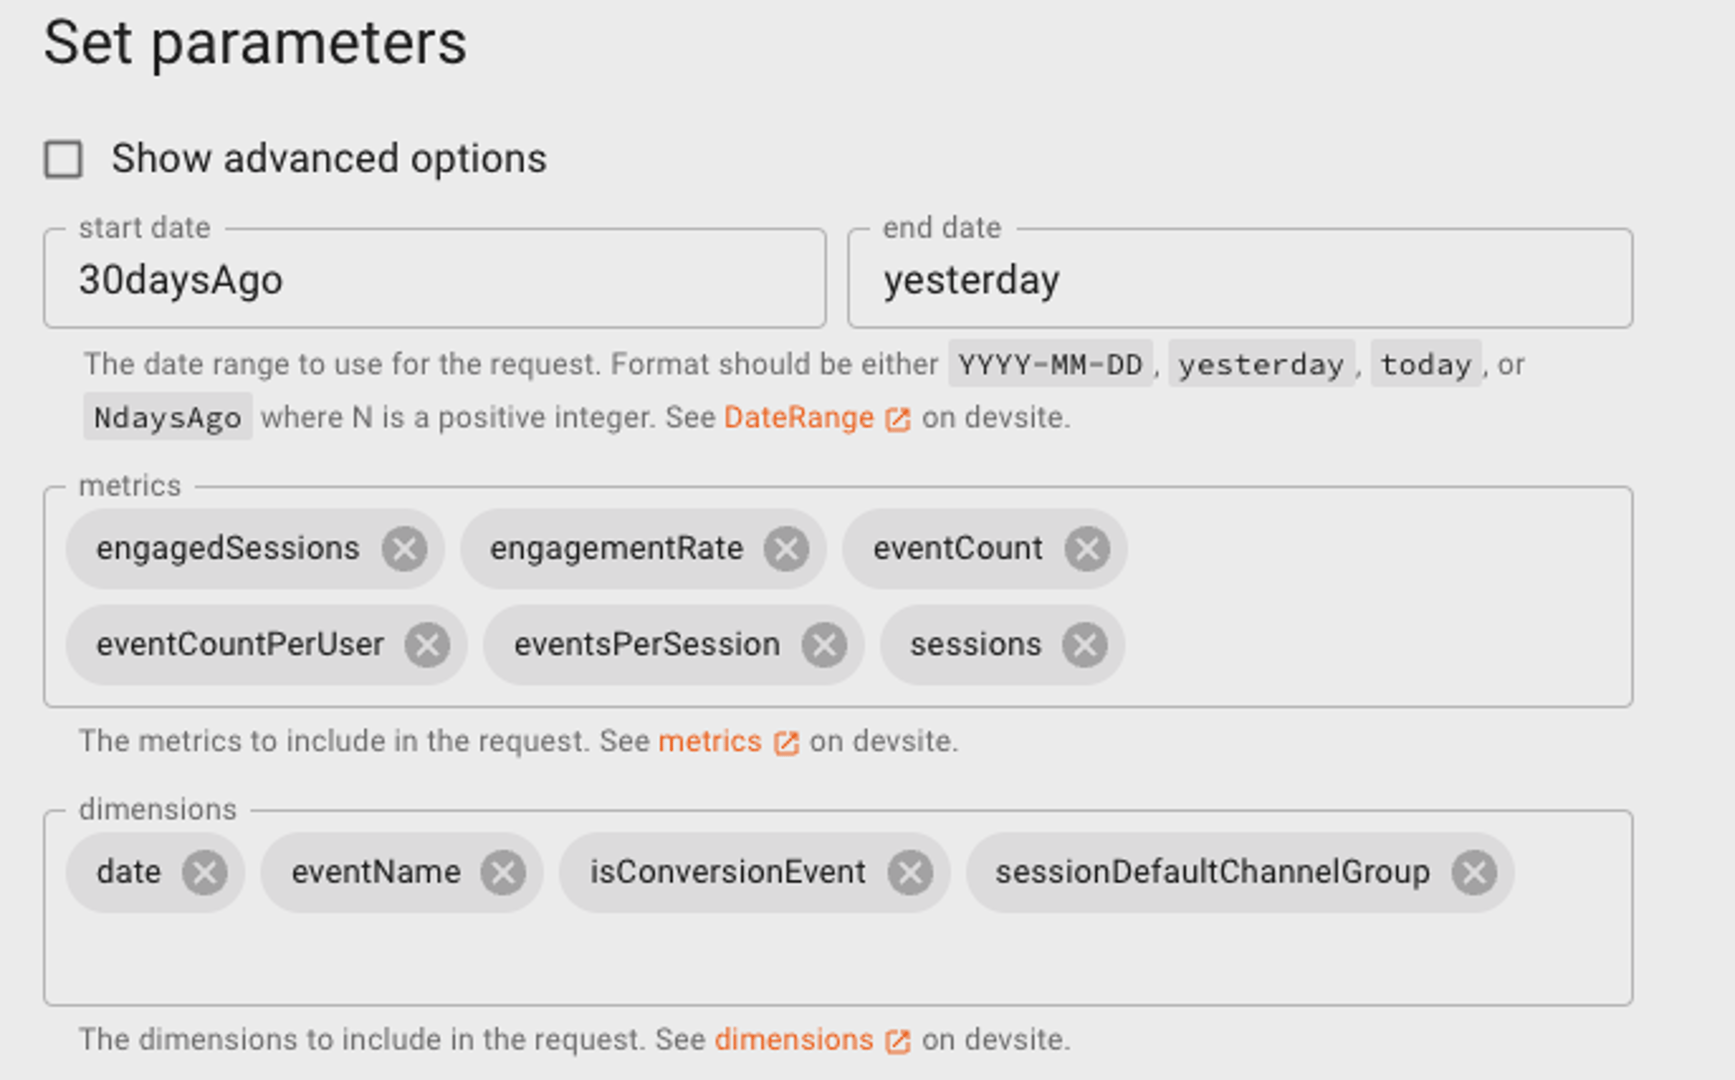
GA4 Query Explorer Tip | Details |
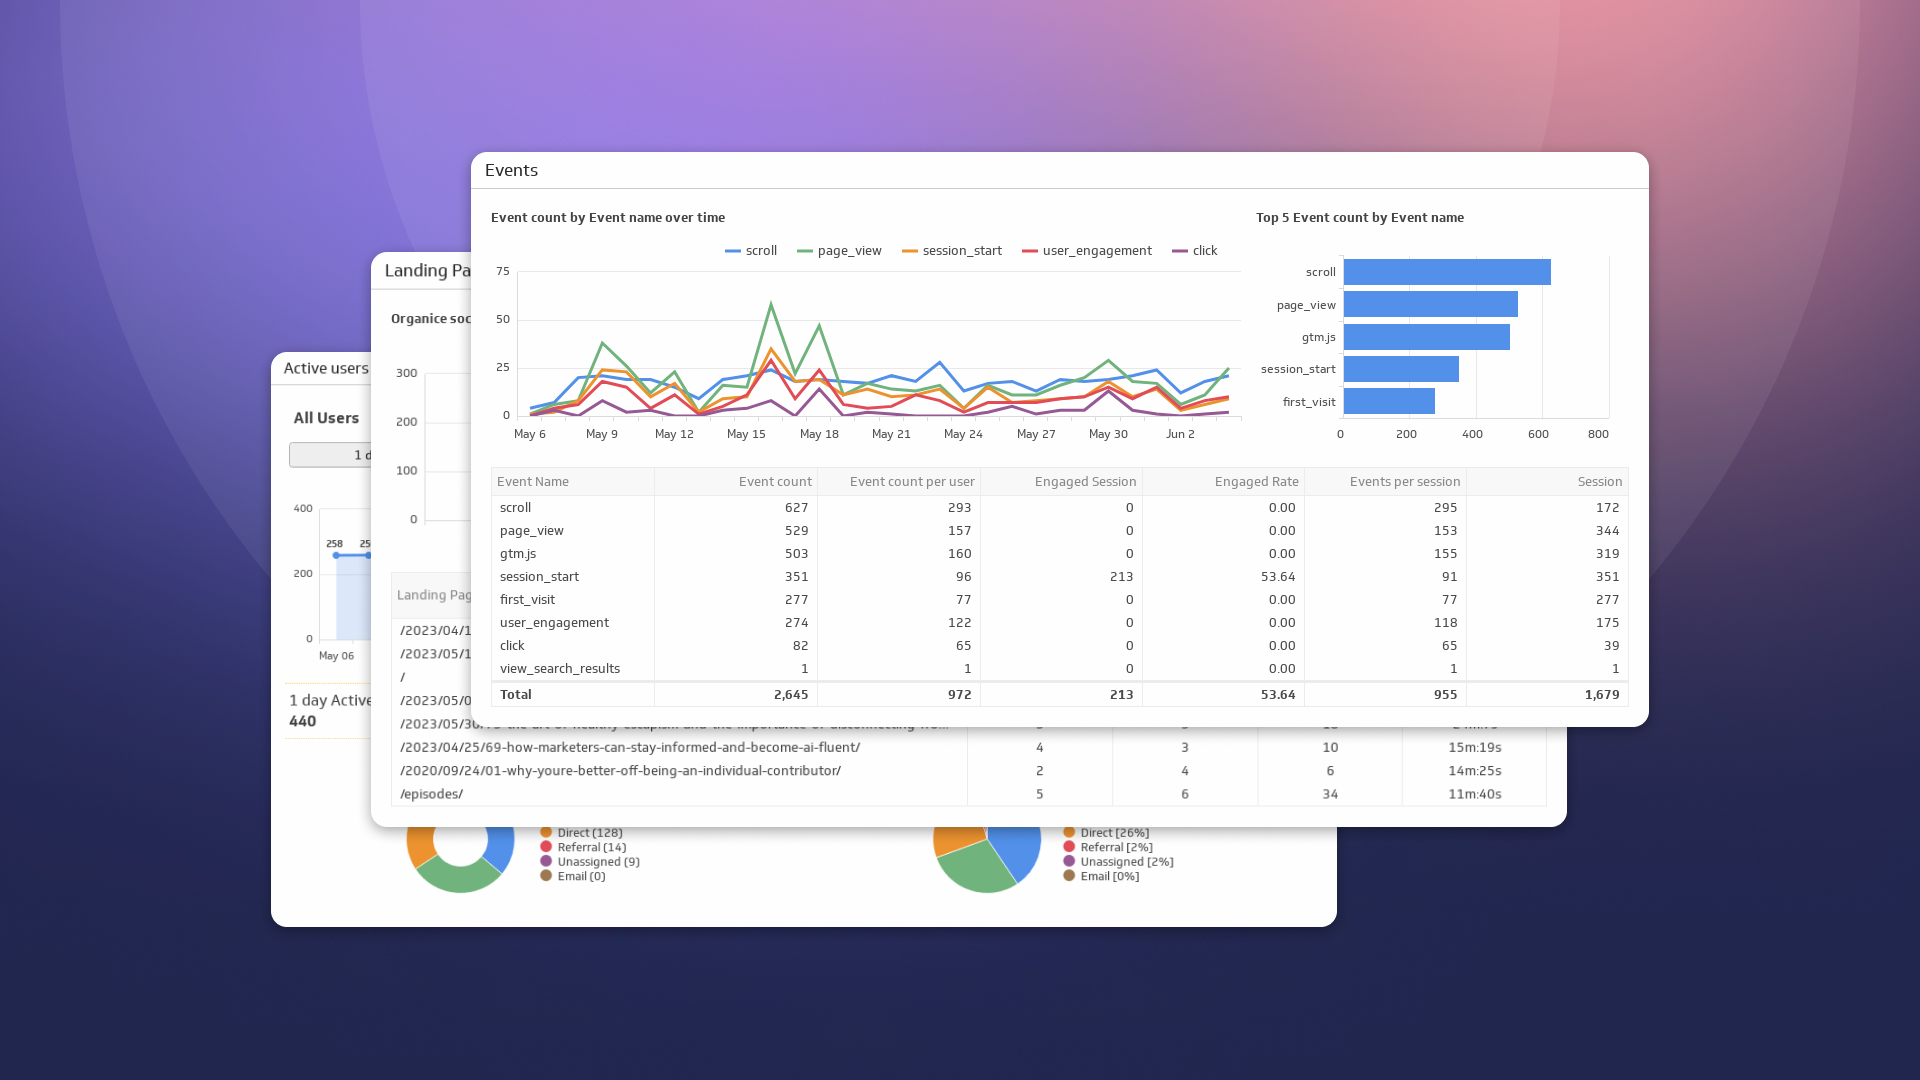
Query Description | Track your events and see how users interact with your website. |
Metrics | Engaged Sessions, Engagement Rate, Event Count, Event Count per User, Events per Session, Sessions |
Dimensions | Date, Event Name, Is Conversion Event, Session Default Channel Grouping |
Code Snippet | {"dimensions":[{"name":"date"},{"name":"eventName"},{"name":"isConversionEvent"},{"name":"sessionDefaultChannelGroup"}],"metrics":[{"name":"engagedSessions"},{"name":"engagementRate"},{"name":"eventCount"},{"name":"eventCountPerUser"},{"name":"eventsPerSession"},{"name":"sessions"}],"dateRanges":[{"startDate":"30daysAgo","endDate":"yesterday"}]} |
Here’s an example of what you can build with this data. Use this Events GA4 Klip Template:
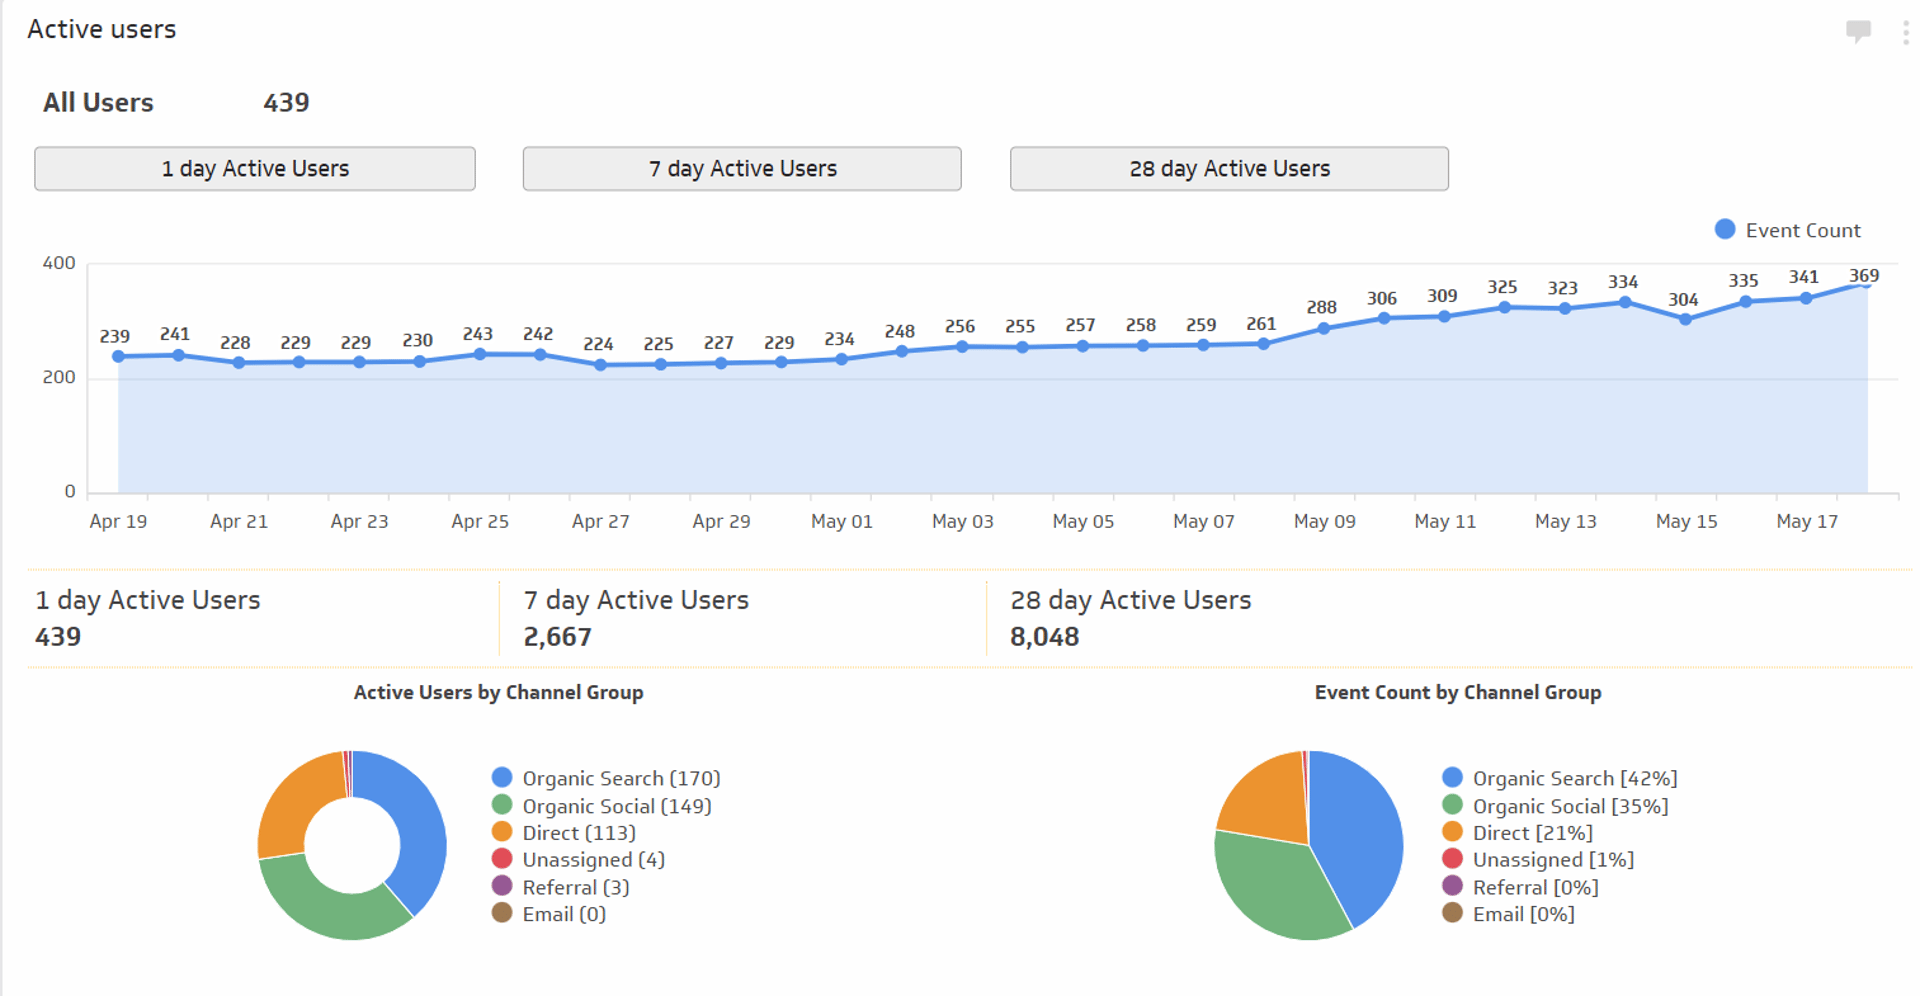
Active Users
GA4 has a lot in common with product analytics tools like MixPanel and Amplitude. You can do some basic cohort analysis out-of-the-box using metrics like Active Users, Active 1-Day Users, Active 7-Day Users, and Active 28-Day Users. Couple these cohorts with some event analysis, and you have the start of some cohort analysis dashboards.
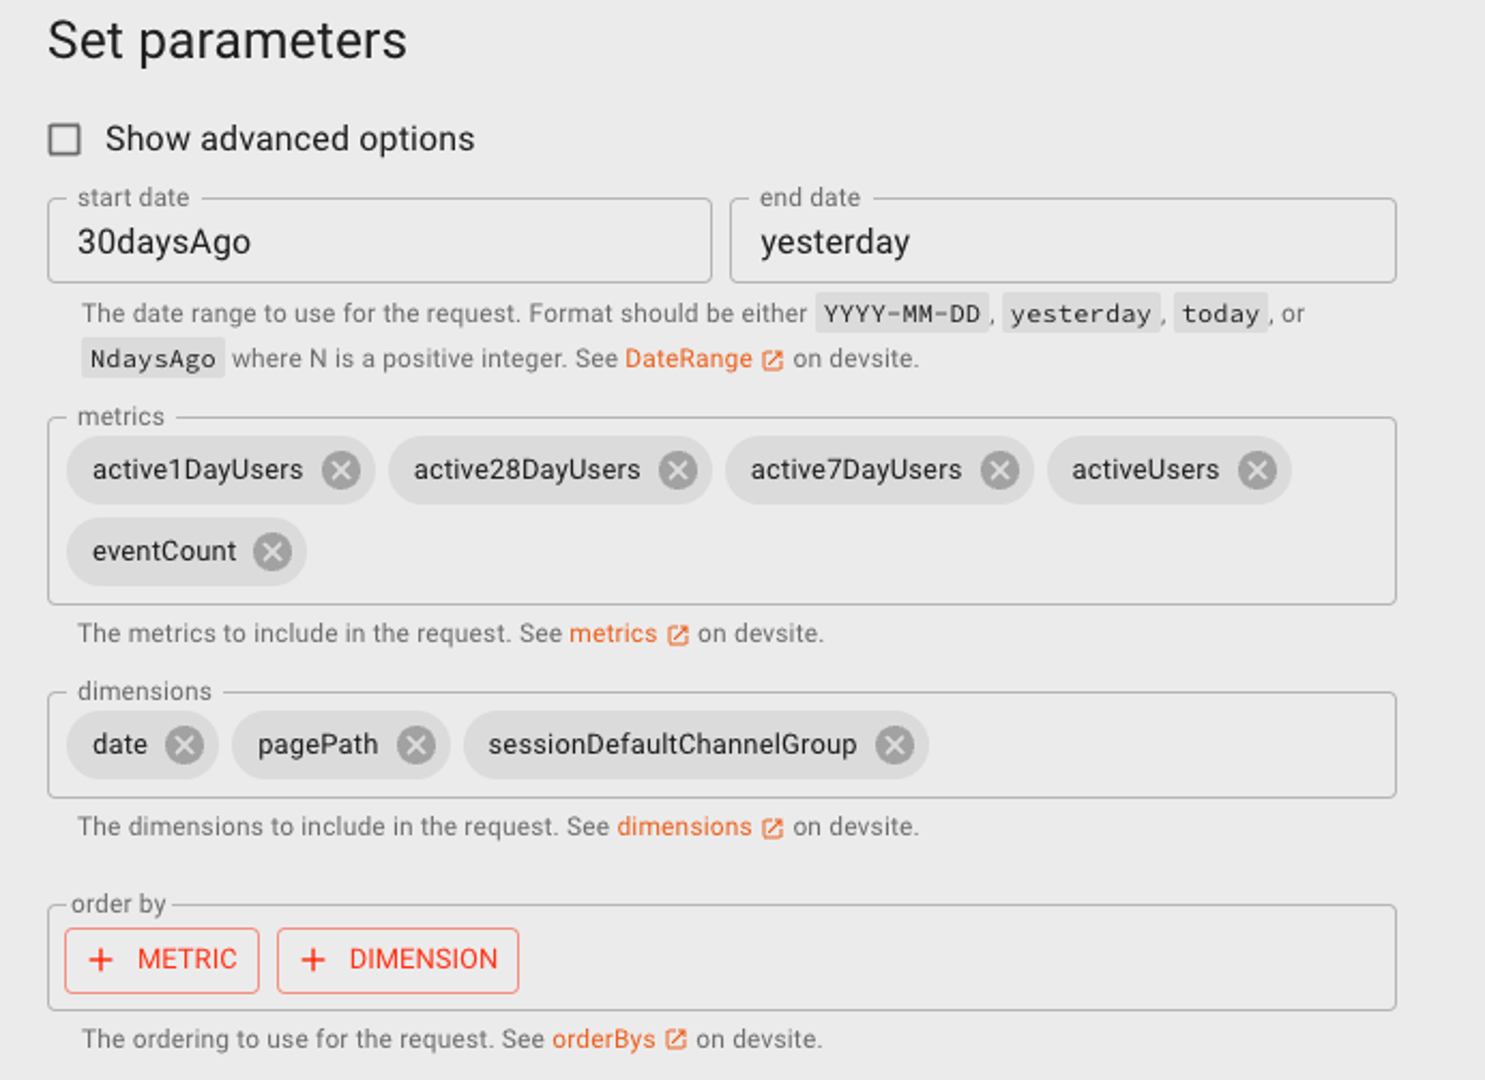
GA4 Query Explorer Tip | Details |
Query Description | Active users is a key metric in GA4, and it’s possible to analyze cohorts like 1-day users, 7-day users,28-day users. |
Metrics | Active 1-Day Users, Active 7-Day Users, Active 28-Day Users, Active Users, Event Count |
Dimensions | Date, Page Path, Session Default Channel Group |
Code Snippet | {"dimensions":[{"name":"date"},{"name":"pagePath"},{"name":"sessionDefaultChannelGroup"}],"metrics":[{"name":"active1DayUsers"},{"name":"active7DayUsers"},{"name":"active28DayUsers"},{"name":"activeUsers"},{"name":"eventCount"}],"dateRanges":[{"startDate":"30daysAgo","endDate":"yesterday"}]} |
Here’s an example of what you can build with this data. Use this Active users GA4 Klip Template:
Migrating to GA4 with Klips
Many of us are deeply familiar with and committed to reporting using UA. This shouldn’t come as a surprise: Universal Analytics was launched in 2012, and was a staple of marketing analytics for what feels like a generation. However, the day has come where marketers need to learn a new tool – and GA4 feels like a different tool at times – and they also have to do this without the comfort of a familiar user interface. After a generation of relying on trusty UA, we have no choice but to change (despite how uncomfortable it may be).
Marketers need a strategy for delivering reports and dashboards to stakeholders, especially those who aren’t familiar with GA4. Their strategy needs to bypass the learning curve and keep their team focussed on the value a tool like GA4 brings to their business analytics. Using a 3rd party reporting tool, like Klips, is the answer.
Make sure to check out this content to learn more about how Klipfolio is helping customers transition to Google Analytics 4.
Related Articles
6 Facebook ads reports every agency needs to attract and retain high-ticket clients
By Tanya Brody — April 10th, 2026
The 5 most important SEO KPIs for digital marketing success
By Sanket Patel — February 24th, 2026
What are the best inbound marketing KPIs?
By Jonathan Taylor — December 17th, 2025
