

Providing a meaningful financial dashboard outside of Excel
Sharing financial data with stakeholders is easy. Making it meaningful is harder. This post walks through how a Klipfolio Controller moved from emailing Excel budget vs actual reports to distributing a financial dashboard via a secure published link, and what changed when managers could actually engage with the numbers.
Sharing key financial metrics with stakeholders is a core part of running finance well. The challenge isn't access to the numbers; it's making those numbers meaningful to people who didn't build the spreadsheet.
As a Controller at Klipfolio, I spent most of my days in Excel. That made it easy to assume everyone else wanted to see data the same way I did. They didn't.
Why Excel budget reports weren't landing
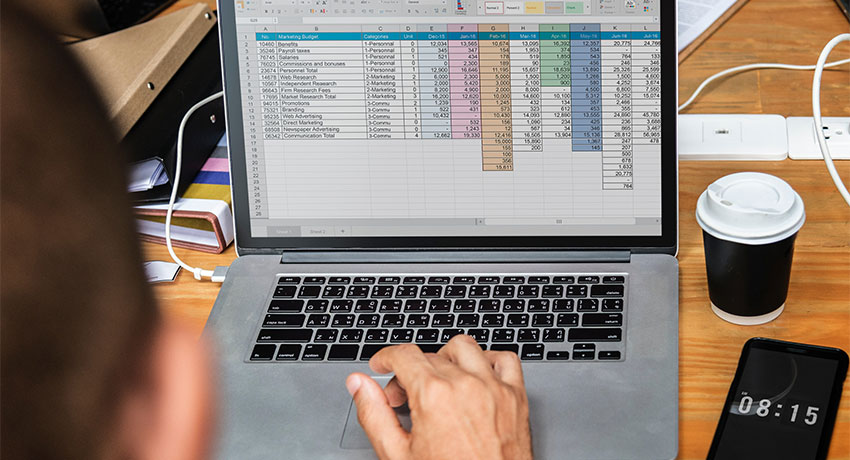
With Klipfolio's growth came a real need for departmental budget reporting. Every month I sent department managers Excel budget vs actual reports. Months in, the feedback was consistent: managers felt they didn't have the data, or they didn't want to engage with it in that format.
The problem wasn't the data. It was the delivery.
Excel is a powerful tool, and most finance teams rely on it heavily. But handing a spreadsheet to a department head who wants a fast answer is like handing someone a filing cabinet when they asked for a summary. They'll stop asking.
Generic AI tools have made this worse in a way. Managers can now paste numbers into a chatbot and get a rough answer, but they're starting from scratch every time, with no shared context, no consistency, and no way to know if the numbers are current. That's not a reporting system. That's a workaround.
Moving to a financial dashboard
To close the gap, we turned to Klipfolio. Instead of emailing Excel files, I started distributing monthly budget reports through a financial dashboard shared via a secure published link.
The result: managers stopped saying they didn't have the data. They started engaging with it.
The process was straightforward. Here's what I did.
How to build a financial dashboard outside of Excel
1. Identify the key financial metrics you want to report on
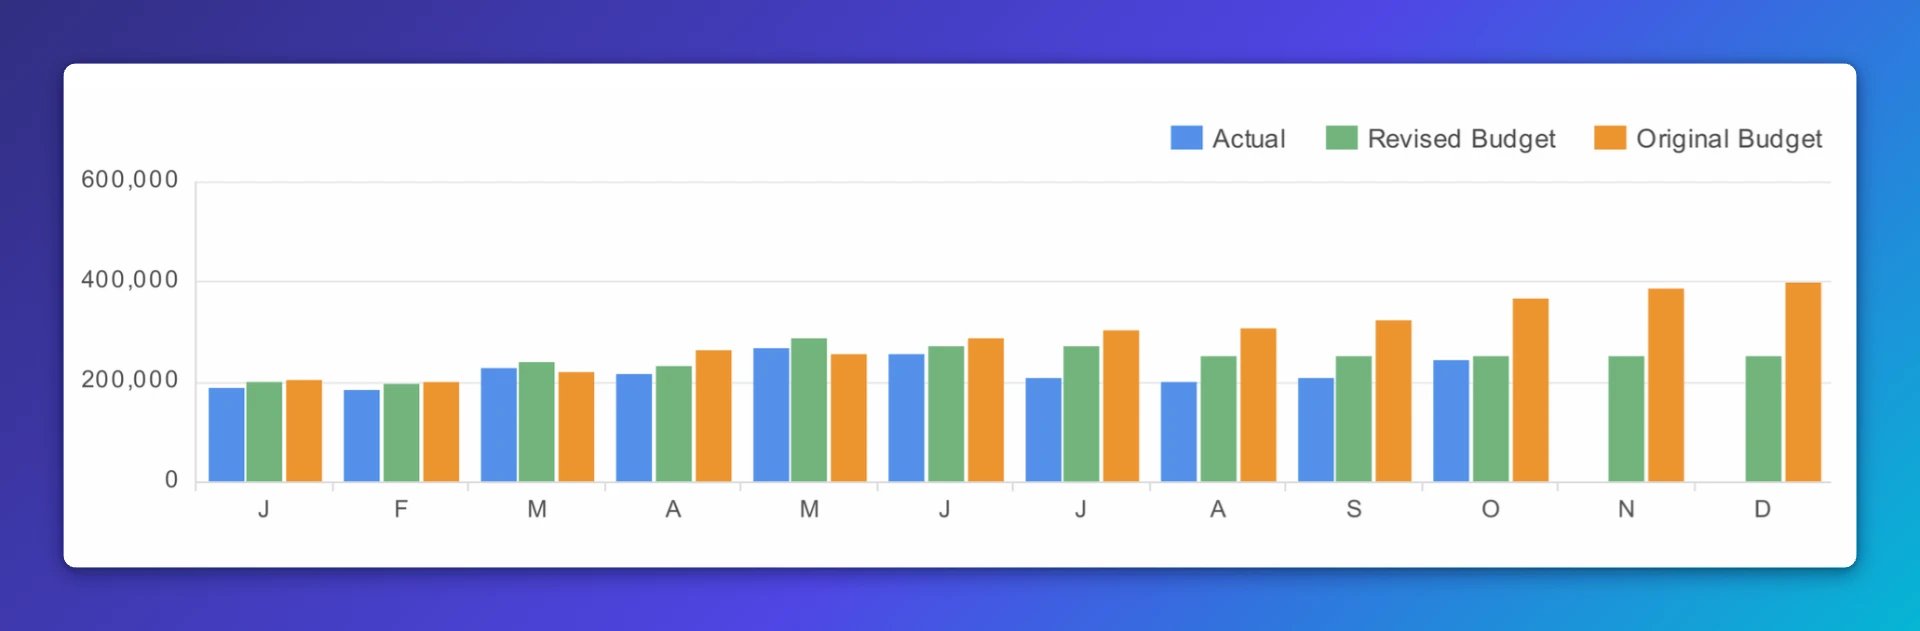
For this project, I focused on budget vs actual results for the month, the quarter, and the year to date. Start there if you're unsure, then expand.
Talk to your team. Ask what numbers they actually need to do their jobs. The metrics that matter most are usually the ones people are already asking about in meetings.
2. Connect your data sources to Klipfolio
One of the most practical things about Klipfolio is that a single Klip can pull from multiple sources. Your budget might live in an Excel dashboard file. Your actuals might come from Xero or QuickBooks. That's fine.
Set up each source in Klipfolio once. After that, your Klips update automatically, without you having to touch them.
3. Build your Klips
Klipfolio offers 30+ visualization types. For budget vs actual reporting, simple bar charts work well: clear, comparable, and fast to read.
Each Klip took me only minutes to build once I had chosen my visualization and connected my data. The result is a dashboard your stakeholders can read at a glance, without needing to interpret a spreadsheet.
4. Share via published link
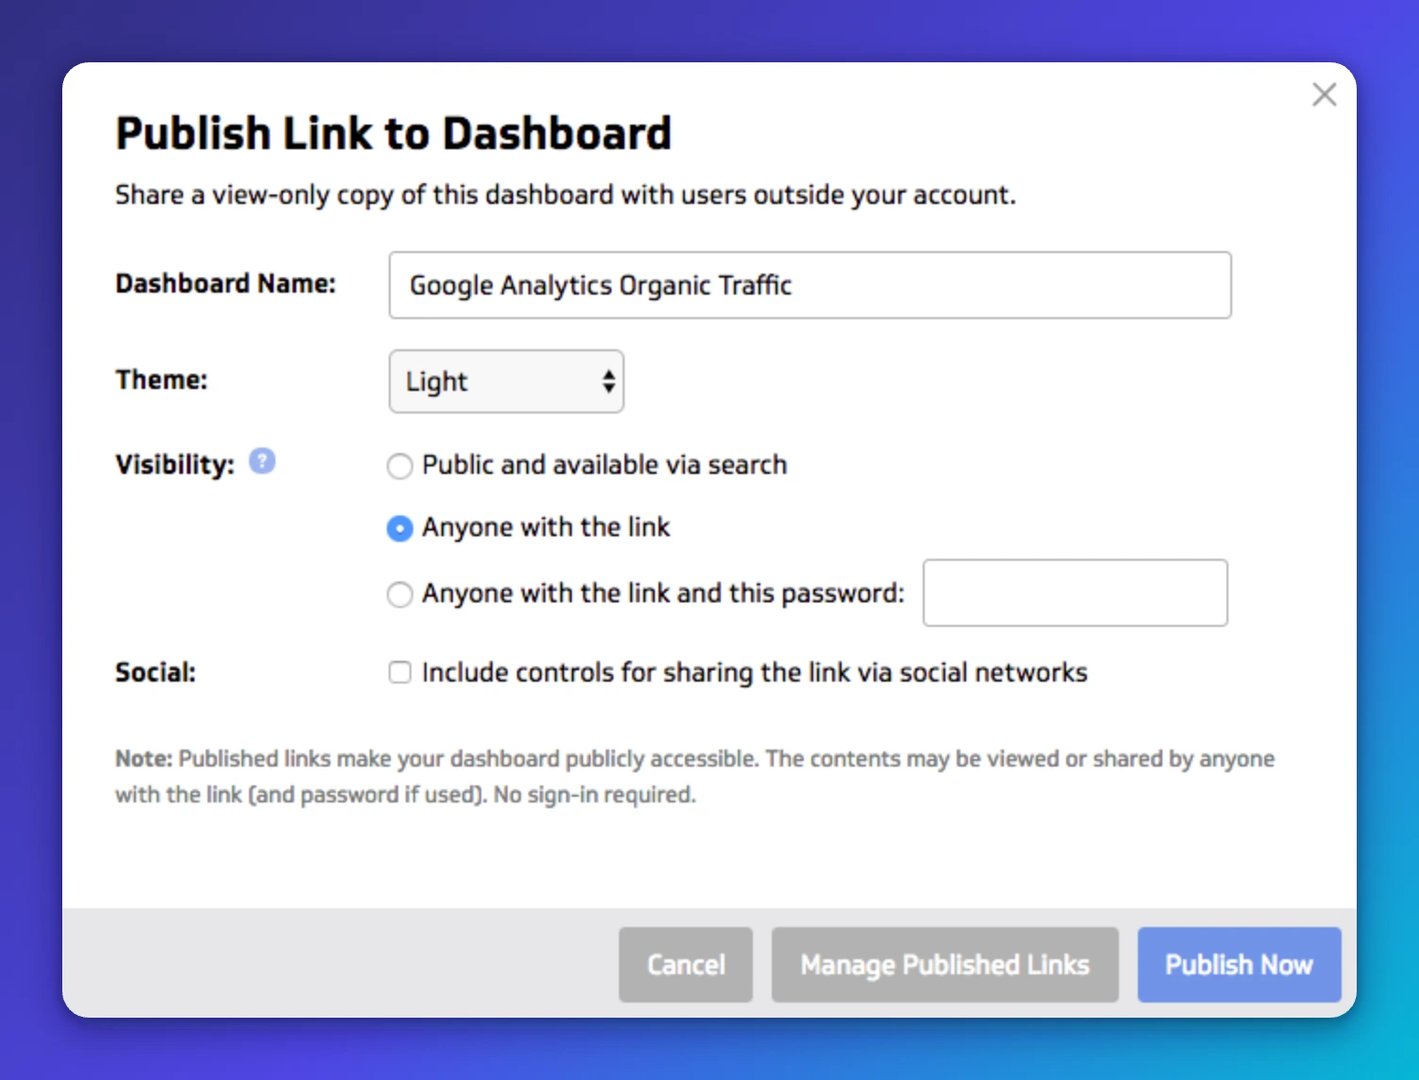
Once your Klips are ready, use the published link with password option to share access. Email the link to the stakeholders who need it. They see current numbers every time they open it, with no file attachments, no version confusion, and no waiting for someone to pull a report.
Create custom dashboards for you and your team.
Get started with KlipsWhat changes when the dashboard works
Department managers stopped telling me they didn't have the data. They started coming to meetings with questions about the numbers instead of questions about where to find them.
That's the real shift. A financial dashboard your stakeholders actually trust gives everyone a shared starting point. Decisions get faster. Follow-up gets easier. And your team stops operating on different versions of the truth.
Excel stays in the workflow where it belongs. Klipfolio handles the distribution. Your stakeholders get clarity without the spreadsheet.
Try it with one department's budget report and see how the conversation changes.
Updated 2026-08-28
More in Accounting & Finance

How to build an accounts receivable dashboard that improves business performance

Best budgeting and accounting software list
Best Excel alternatives and how to choose the right one for your business

How Sarah's OKR dashboard made her impossible to overlook: A client success story

Real-time dashboards for reporting: Why live beats static
10 cloud BI dashboard tools for growing firms in 2026
Most recent
- SEP 25What SOC 2 taught a small team about trust
- SEP 15The AI race: progress, humanity, and trust
- SEP 9The good advisor
- AUG 11Beyond simple sign-ups: how True Trials and Activation predict growth
- JUL 7Why business leaders miss important trends in their dashboards
- JUN 19The best chart for the job: Visualizing data for non-technical users