
Summary - Are you tracking the right metrics for success? This article breaks down the crucial difference between leading indicators (the actions you control) and lagging indicators (the results you get). Using simple examples, you'll learn how to identify the right KPIs for your business and use dashboards to monitor your progress, predict future outcomes, and keep your entire team aligned on your goals.
Tracking your company's success isn't a one-size-fits-all process. With countless metrics to monitor, a simple way to gain clarity is by categorizing them as leading or lagging indicators as part of your KPI management strategy. You've likely heard these terms, but what do they really mean for your business?
Let's break it down. A lagging indicator is an output—it’s easy to measure but difficult to change on the spot. Think of it as the result. A leading indicator is an input—it’s something you can directly control, but it can be harder to measure. These are the actions you take to achieve a specific outcome.
To make this concrete, let's consider a common goal: weight loss. Your lagging indicator is easy to measure: you just step on a scale. That number—the output—is a result of past actions and can't be changed in that instant. Your leading indicators, which you have more control over, are the inputs like your daily calorie intake or how often you exercise. While you can track these, they can sometimes be tricky to measure precisely, like when you’re eating at a restaurant.
What are lagging indicators?
Lagging indicators are metrics that are easy to measure but only change after a trend has already started. They confirm a pattern but can't predict it. Think of them as a review of your past performance; they show the results of your efforts and tell you if you're on track to hit your long-term goals. For example, if your company has a revenue target for the end of Q1, January’s total revenue is a lagging indicator. It tells you how you've done, helping you make better decisions moving forward.
Some other examples could include:
- Monthly Recurring Revenue (MRR)
- Net Promoter Score (NPS)
- Customer Churn
- Total Expenses
What are leading indicators?
Leading indicators give you a sense of where you're headed. Business leaders use them to proactively adjust strategy and guide their teams. Identifying and tracking the right leading indicators is key to achieving your goals because they provide a realistic forecast of your future results. The key is to choose leading indicators that directly influence the results you want. You need to drill down and identify the specific activities that will drive your team's success.
Some examples of specific leading indicators could include:
- Daily number of trials
- Number of pageviews
- Number of blog subscribers
- Number of new accounts
By monitoring these metrics in real-time, you can spot potential issues before they become major problems. This allows you to implement a plan of action immediately, preventing a negative impact on your lagging indicators and keeping your goals within reach.
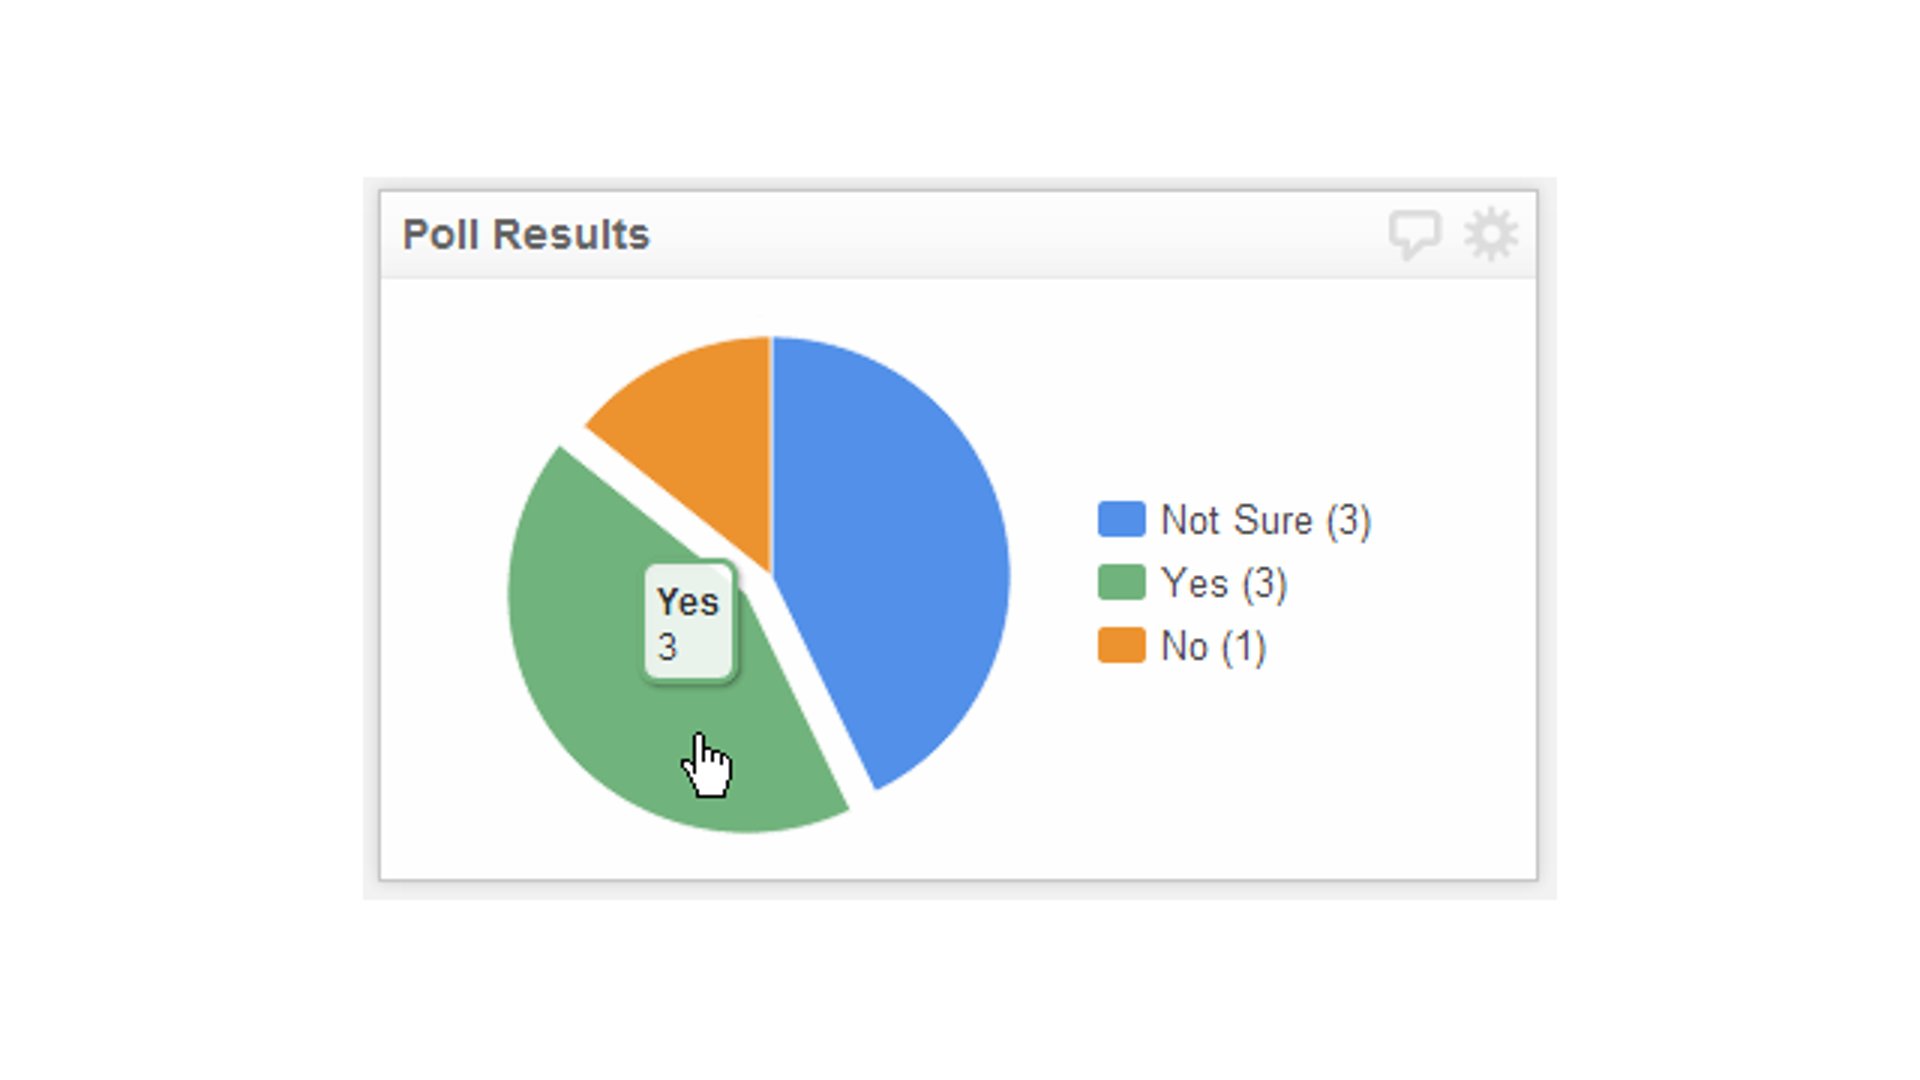
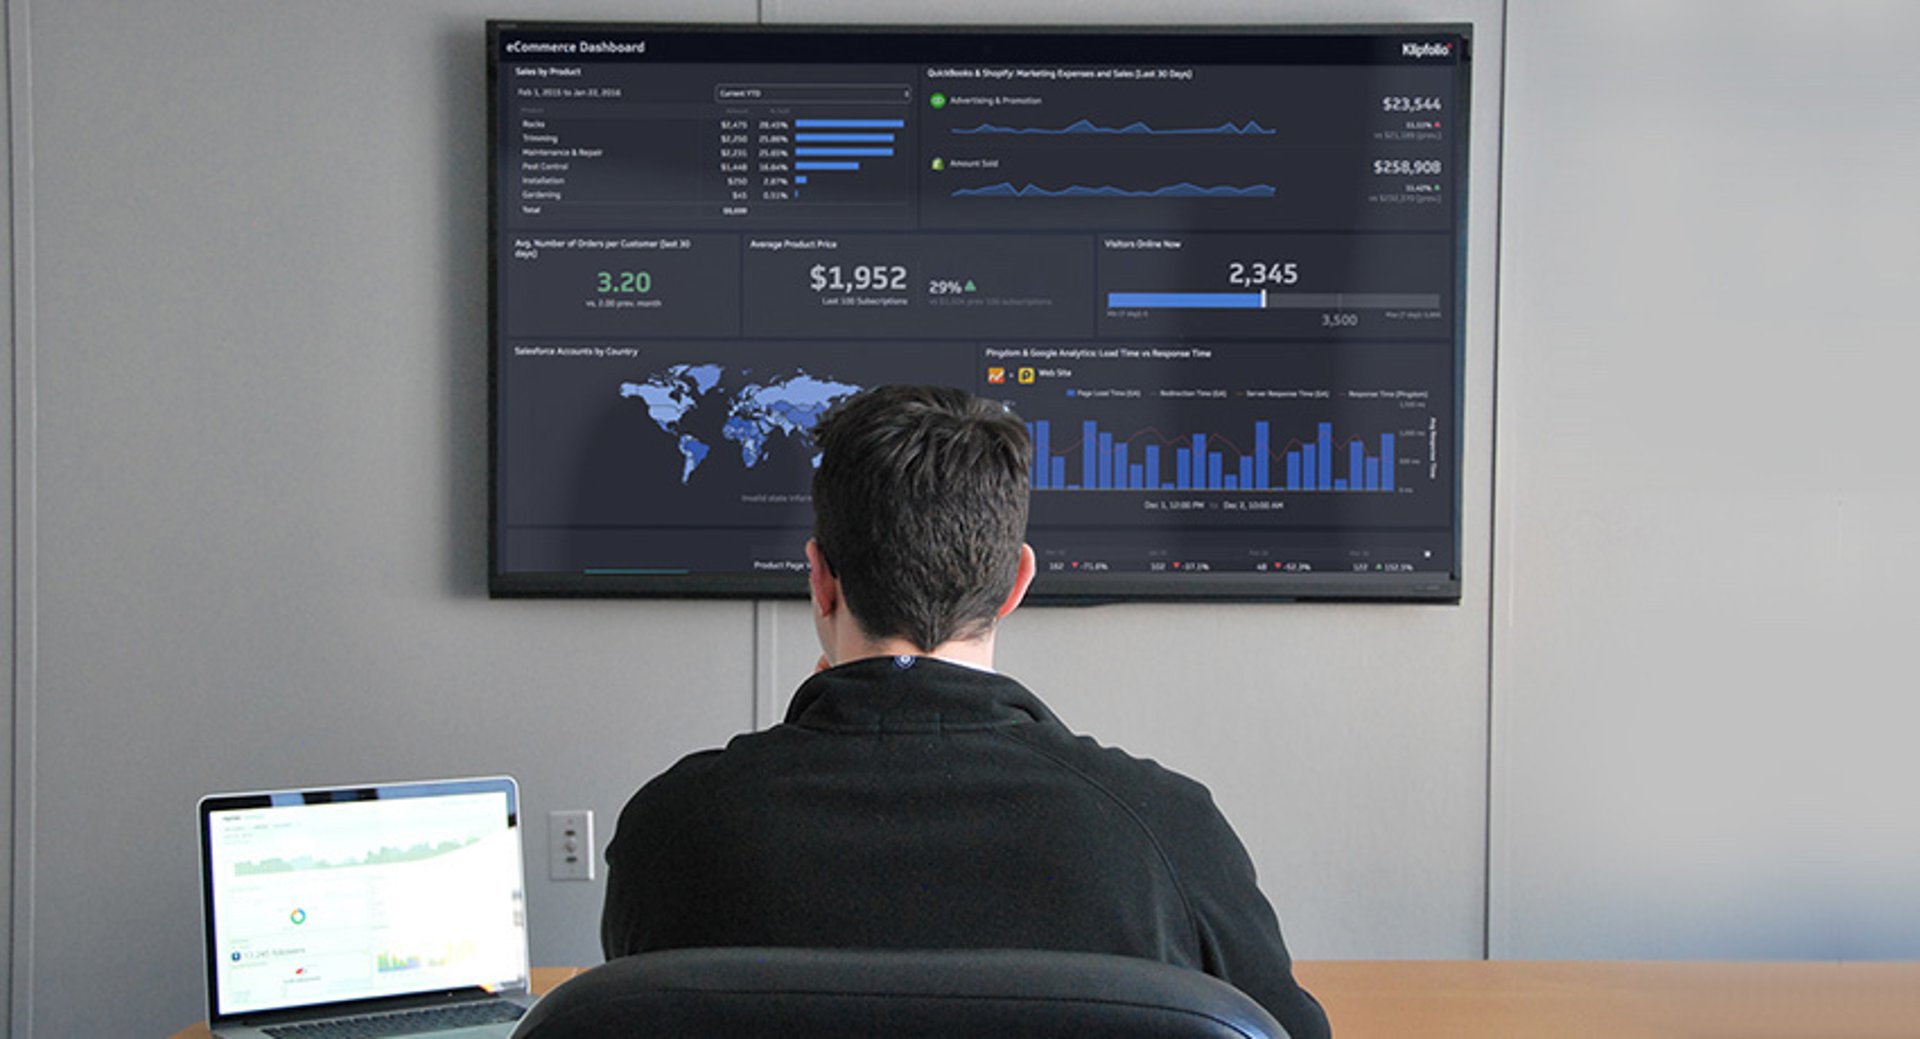
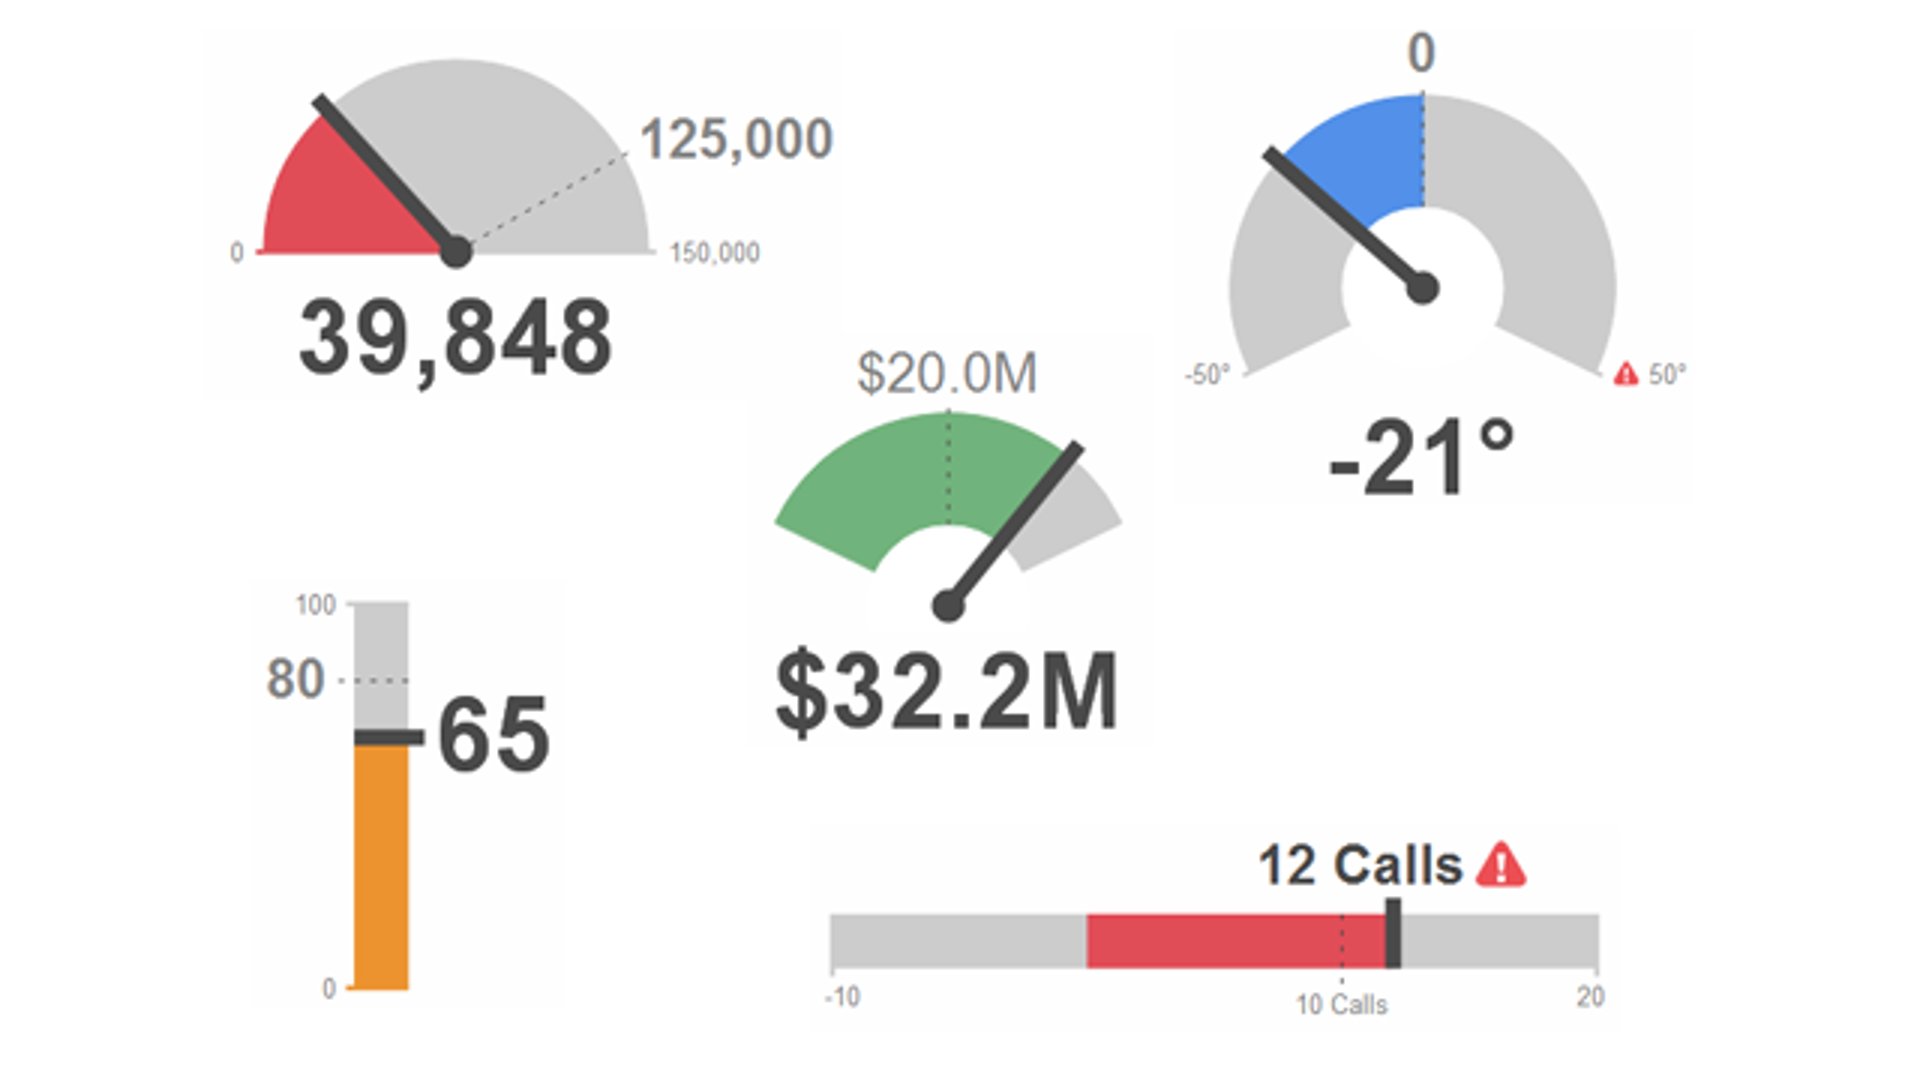
Use dashboards to make tracking your leading and lagging indicators easy
Once you have determined your leading and lagging indicators, it’s time to track them. This is where dashboards come in. A dashboard is an information management tool used to track business KPIs, metrics, and other key data points. Using data visualizations, dashboards simplify complex information to give everyone a clear, at-a-glance understanding of current performance. In short, they are the best way to get your entire team on the same page.
Effective dashboarding involves understanding your indicators, choosing the right ones, and managing your team in a way that makes regular monitoring part of your company's culture. When everyone is aware of your key indicators, you will be able to manage your team’s performance more effectively and drive better results.