Metric Driven Change Management

Published 2023-02-01
Summary - How metrics are making the Klipfolio dev team more efficient and better able to meet the needs of our customers.
There are as many articles and books on change management and process improvement as there are approaches to adopting a new methodology or behaviour in a team or organization. The number and variety of expert opinions on this topic further attests to its complexity. It’s always challenging to find the silver bullet when it comes to making changes. The main challenges for any organization is alignment and sometimes resistance to change.
As we grow both our customer base and product functionality at Klipfolio, we need to ensure we are working effectively. One of our challenges this year is managing product defects or bugs so that we get better at fixing issues.
Regardless of the approach, there needs to be a way to measure the success of the change or process improvement. One of the best ways of measuring success is having the right KPIs for your organization in place. I am going to call this approach Metric Driven Change Management (MDCM). I’ll give you an example of MDCM that we recently experienced and explain why this approach could be used to drive process and behavioural change.
At Klipfolio, we now use MDCM in our development team as part of our prioritization process during product defect reviews. Several months back, we realized that we needed to make some changes in this process to improve the quality of our product and service. This feels like a simple thing, right? You have a list of defects, you prioritize them, you fix them… and you’re done.
Well, in reality, and believe me I have seen this process in small and large development teams, it is never that simple because it’s not just the defects you are dealing with. There are also enhancement requests, new features, future R&D work items, and technical debt. Add to this mix that different departments have their own priorities and requests, as well. This makes for a complex, involved, and sometimes even a political decision-making process for when and which defects will be prioritized over the other development work that also needs to be completed like new feature design. In the worst case, defects fall between the cracks and never get fixed and in the best case, the customers with the bigger voice/sponsors get their issues fixed first.
I can hear you say: that’s an easy problem to solve, you just have to review the defects and prioritize them. Correct, we started changing our process by introducing a better defect review and prioritization process. We gather the main players together - Support, Product Management, QA, and Development - and prioritize the incoming defects. We categorize the defects into categories including the following:
Critical: Defects that block several customers or when a service has stopped working
Major: Defects Impacting one or more customers’ experience or when a major part of a feature does not work as expected
While this improved review process helps prioritize the bugs within the defect pool, it does nothing to streamline the overall prioritization among the competing requirements, resource allocation and planning.
When we first started the process, we had more than 10 critical issues, and 30 plus major issues. It was hard to find the time and resources to address the issues as there were competing expectations to deliver other features.
We solved the problem by introducing two simple metrics, a desired target for each metric, and getting everyone including the senior management to align on those targets. The metrics and their targets were:
- Number of critical issues has to always be less than 3
- Number of Major issues has to always be less than 10
Having these metrics and aligning the company on the targets simplified the conversation significantly. We simply give the highest priority to fixing defects every sprint (i.e. Scrum development process iterations), if and when we start missing our targets. These metrics have become part of our culture and now appear on our development team dashboard.
Of course we always look to improve our processes, product quality, as well as our service. As a result, now that we have reached the targets for the aforementioned metrics, the next step is defining two new metrics and targets:
Number of Critical issues older than 2 days must be 0
Number of Major issues older than 10 days should be under 5
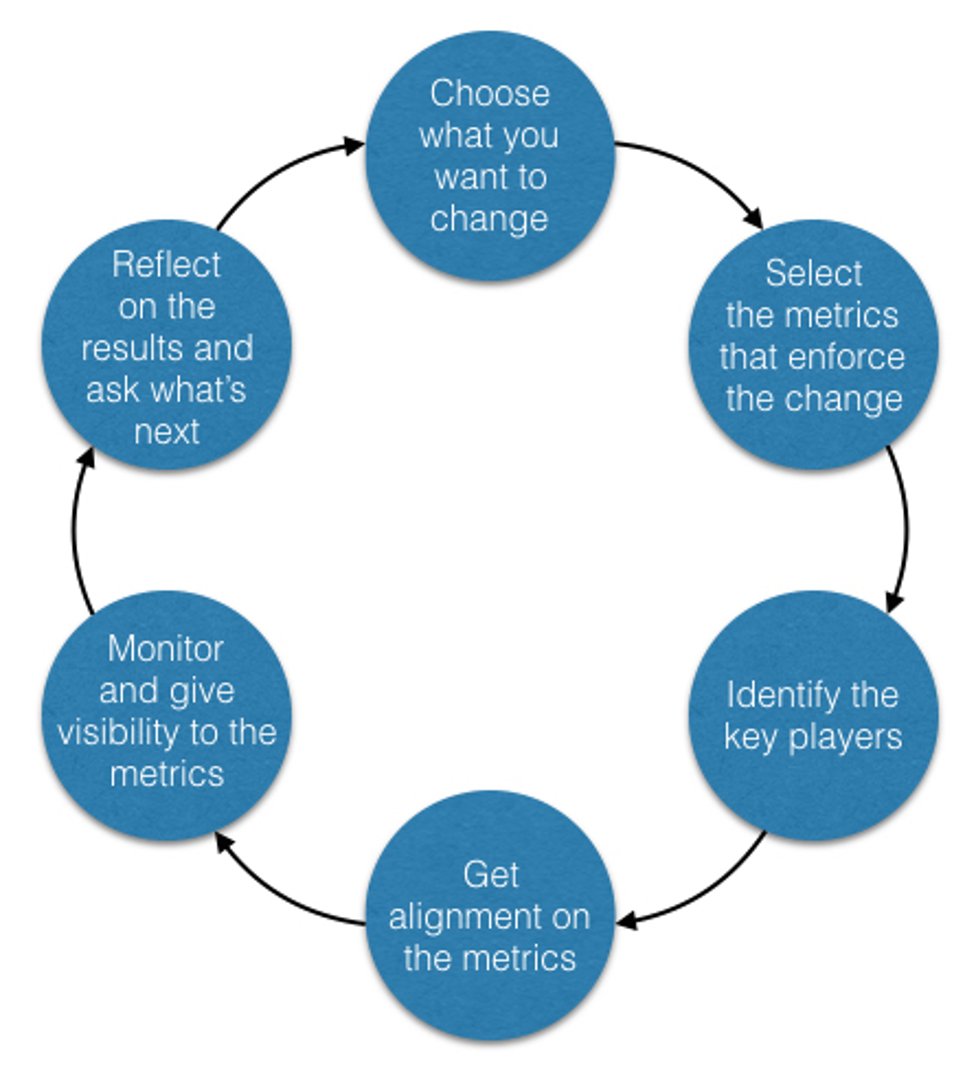
The following diagram shows at a high level how you can go about using this approach in your organization and make changes happen. As illustrated, the key steps in this framework include deciding on what needs to be changed, finding the key players who may be your allies, who will do the work, or who may resist the change, defining the metrics, and monitoring them are some of the key steps in this framework. You can think of this as an iterative and incremental approach and choose a general area and keep adding new metrics to incrementally achieve your vision.

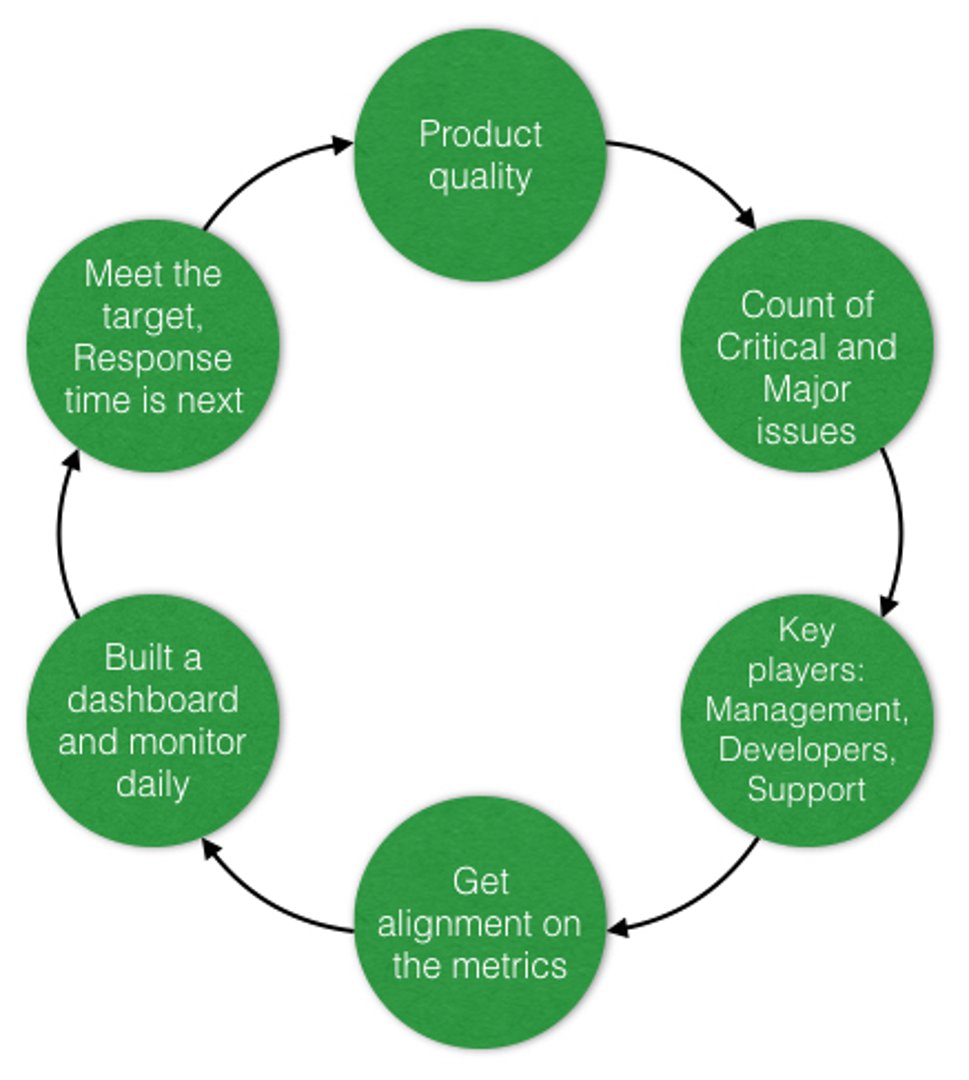
The next diagram uses the above template and shows how you can fill in the steps to have a blueprint for change in place. In this case, we have used the example discussed in this blog post.

Although the metrics we discussed in this blog seem simple and just common sense, it’s not always easy to get everyone’s buy in. Your process definition is doomed if the metrics are not defined, measured, monitored, and if everyone in the organization isn’t rallying around them. But if everyone is committed to a set of metrics and targets, if everyone works to optimize the process and their behaviour to meet those goals, it matters less whether the process / change is formalized as an organization wide initiative or is organic and driven by people. What matters is that the the job gets done and the change happens. That’s what I’d like to call MDCM or Metric Driven Change Management. The critical success factor for this approach is having simple metrics and targets that everyone can understand and get behind.


