

Summary - There are four Functions in Klipfolio that you should understand, and master early on: SLICE, SELECT, GROUP/GROUPBY, and LOOKUP. These Data Manipulation Functions come together into what I will controversially call the single most important formula in Klipfolio.
New users sometimes get frustrated when a Klip or formula in Klipfolio Klips doesn’t come together on the first try. Templates look simple, so building a dashboard from scratch feels like it should be just as simple.
It generally isn’t. Spider-Man’s uncle said, “with great power comes great responsibility.” There’s a learning curve.
If you’re just getting started, or you’re a long-time user who wants a quick refresher, there are four Functions in Klipfolio Klips you should learn early: SLICE, SELECT, GROUP/GROUPBY, and LOOKUP.
These Data Manipulation Functions come together into what can fairly be called the single most important formula in Klipfolio Klips.
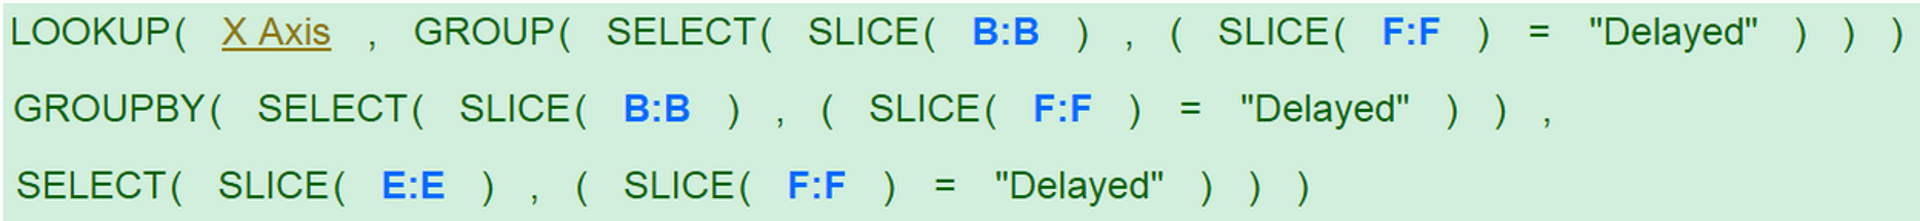
Here it is:
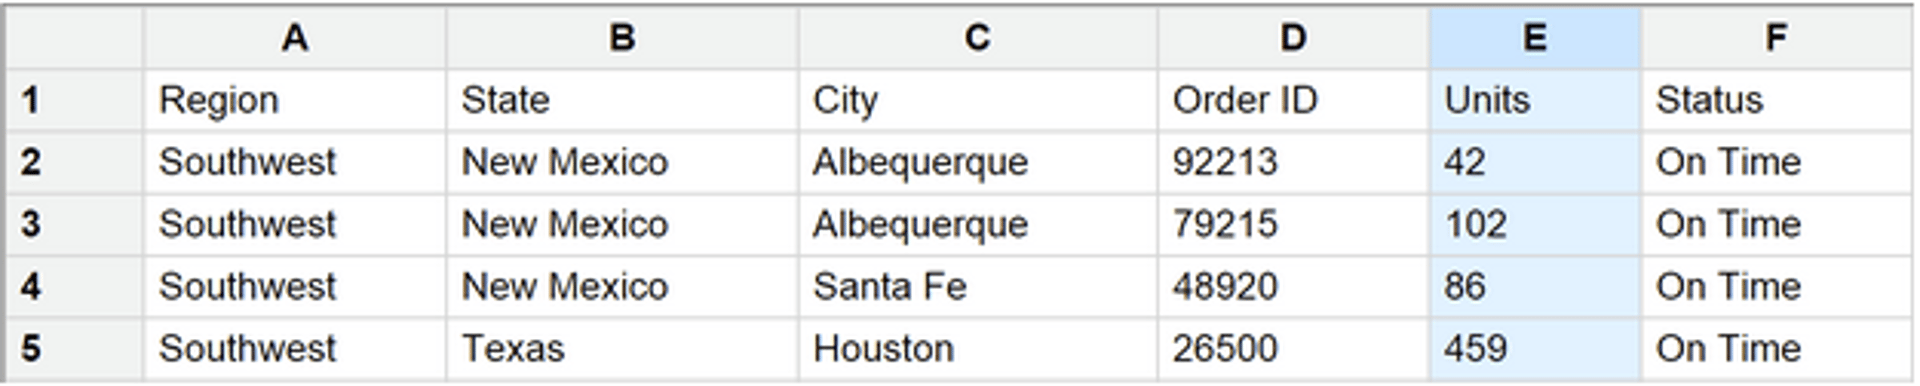
Data source that it uses:
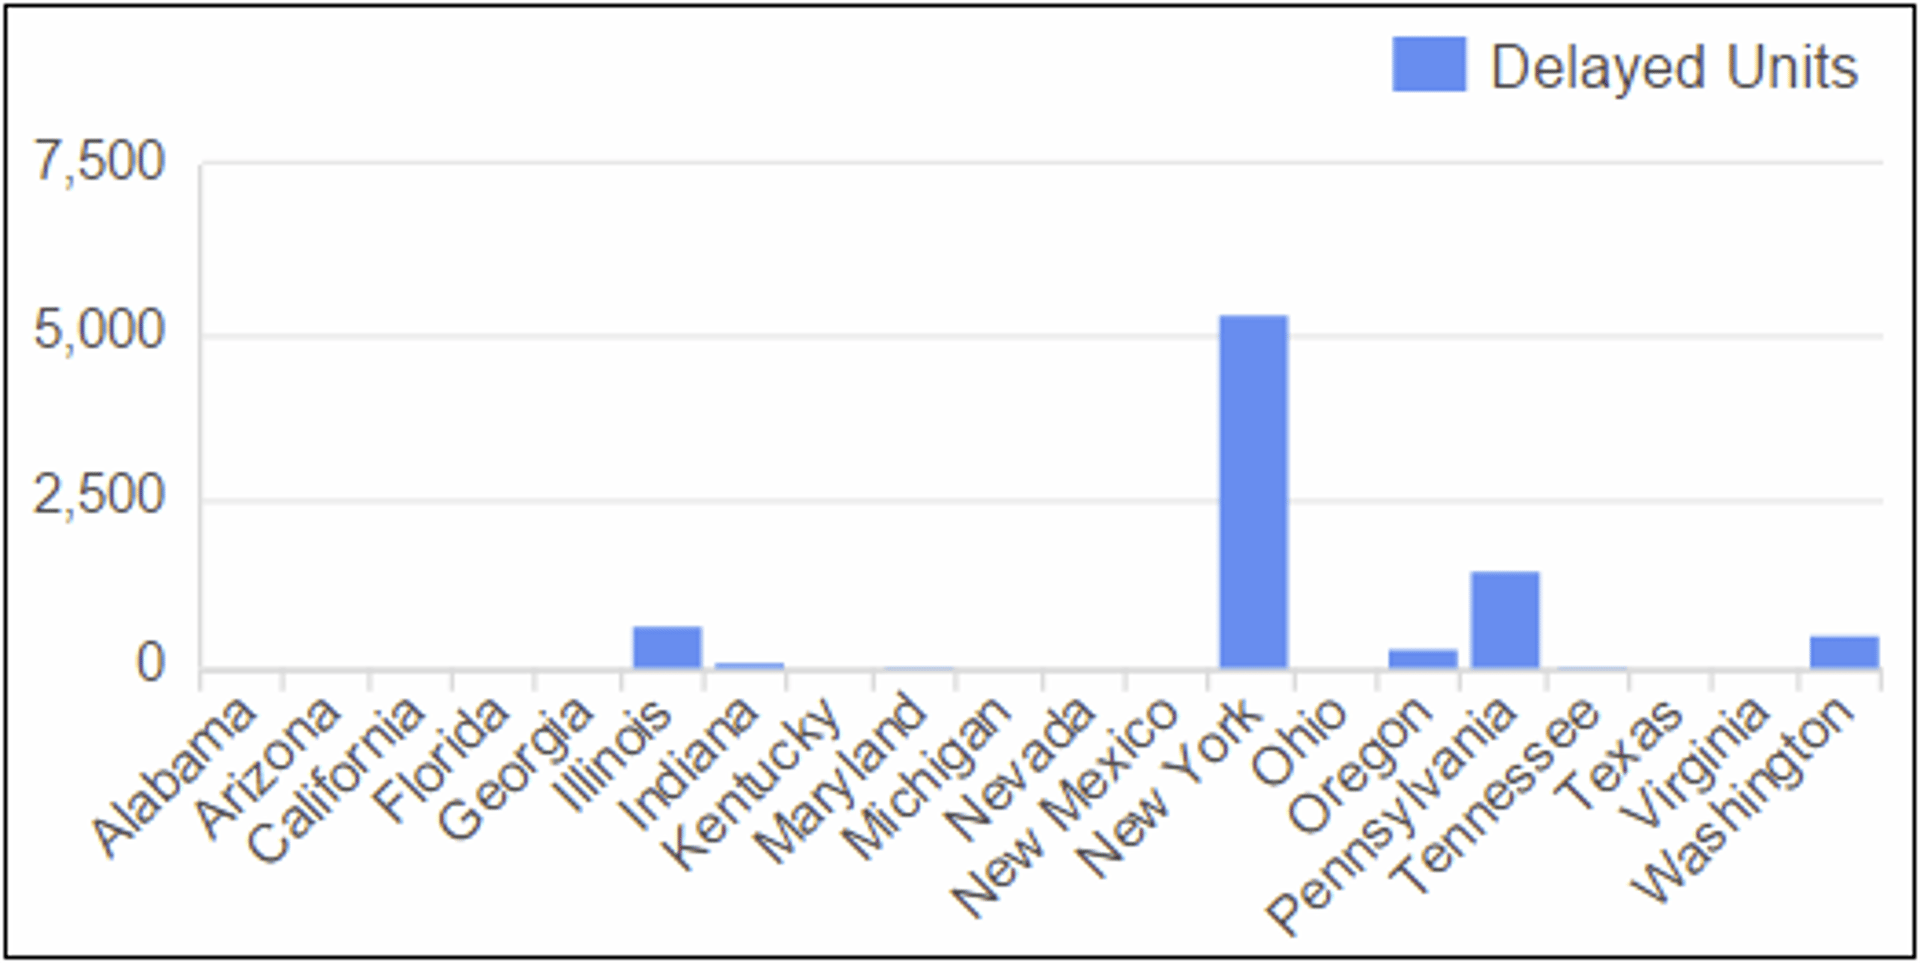
Klip that it built:
The LOOKUP function
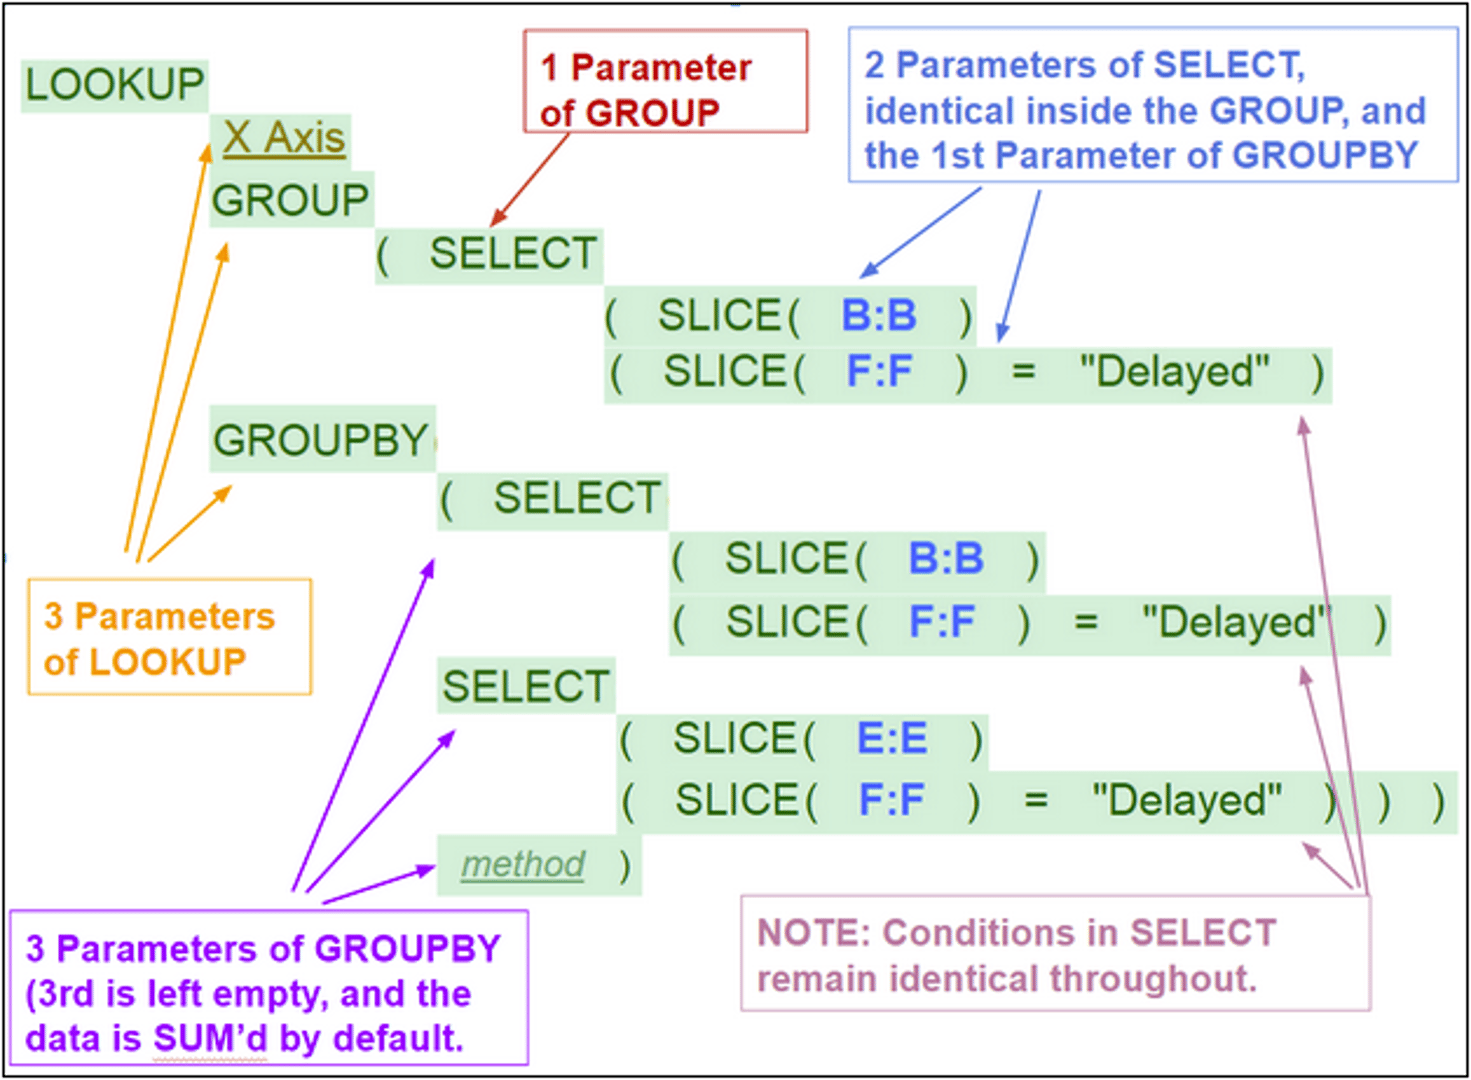
The key to mastering this, and all functions, is understanding parameters. Each function has a set number of parameters. Each parameter expects a certain kind of data and performs a specific action. Take LOOKUP. Break out its three parameters in this formula:
LOOKUP
Parameter One:
X Axis
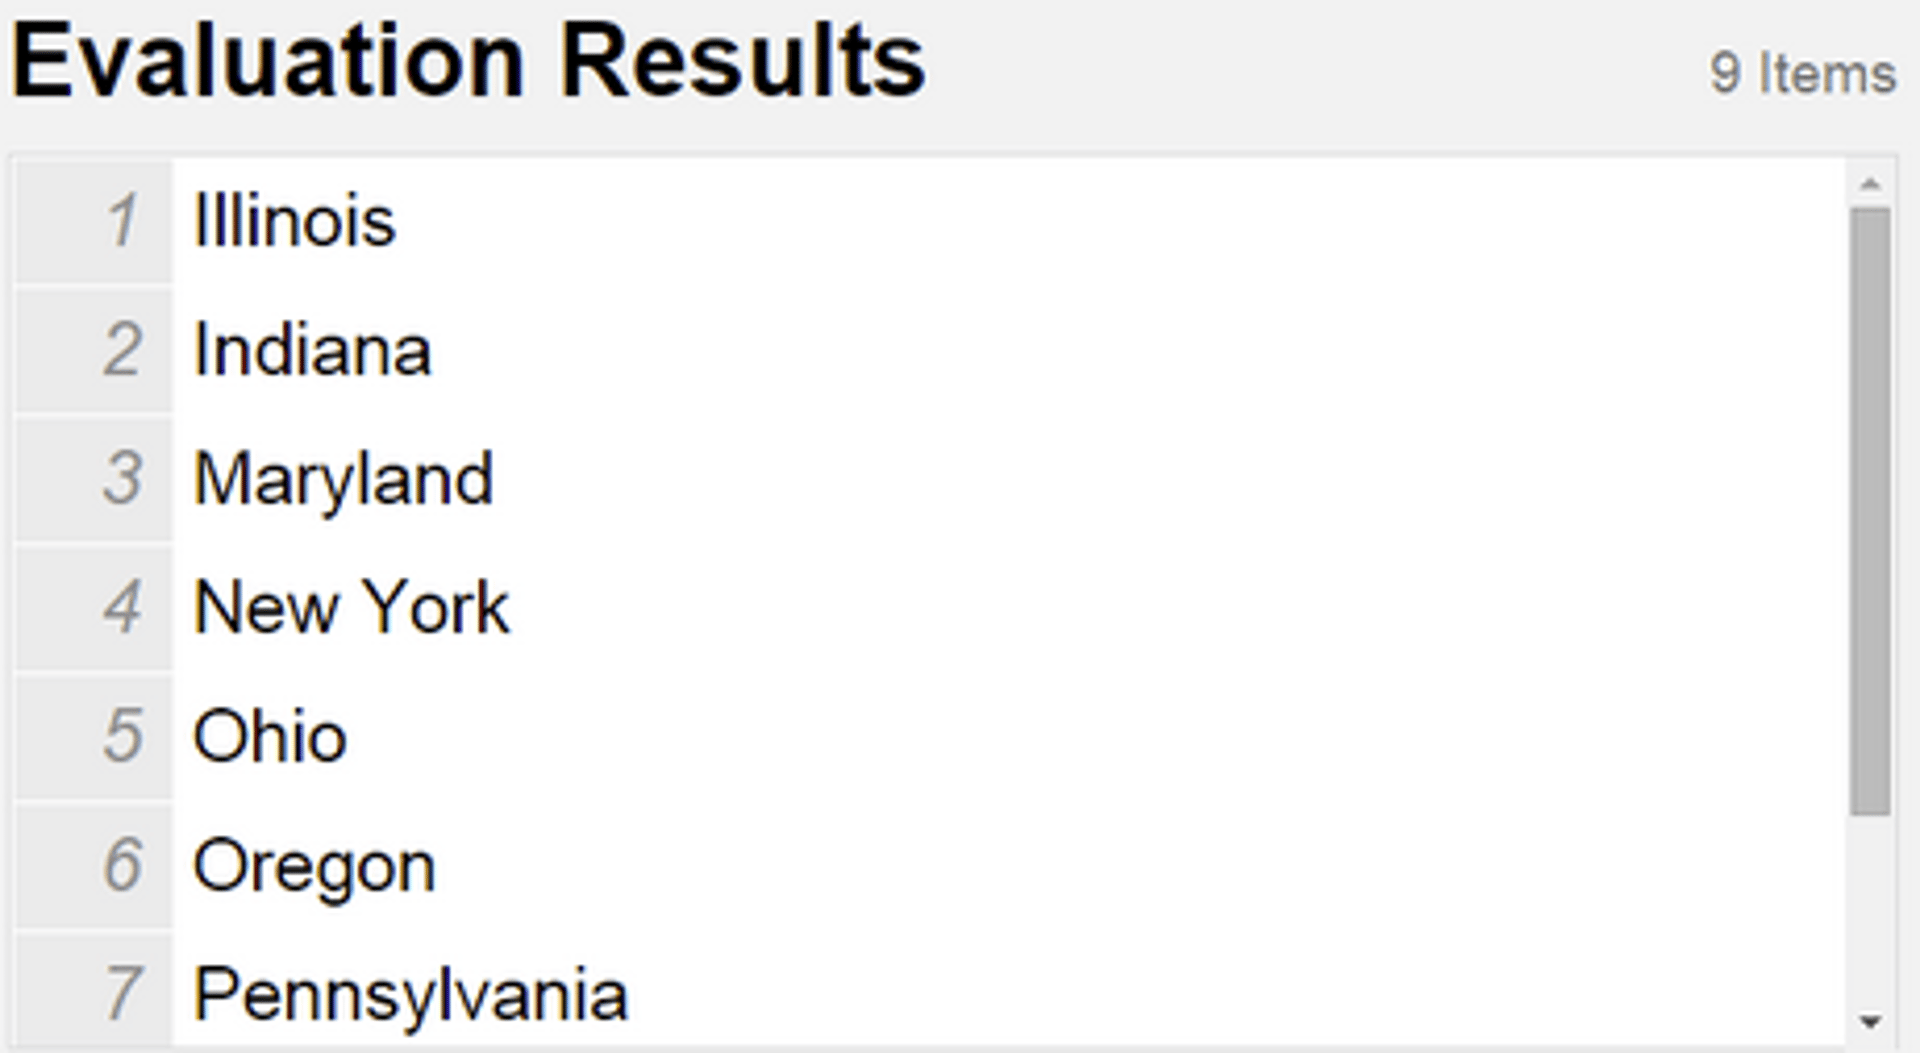
This is a reference to the X axis of the Klip, containing various states in the U.S. Think of it as a long list of values.
Parameter Two:

Think of this as a second list of values. In this case, it’s not all states (B:B) from the X axis, but only those with an Order (F:F) that is Delayed.
Parameter Three:

Here, you’re looking at the states (B:B) that have Delayed Orders (F:F), and totalling the value (E:E) of these delayed orders.
The LOOKUP function takes a list of values (first parameter), looks for matches in a second list of values (second parameter), and, where there’s a match, returns a corresponding data set (third parameter). In the example, of the 20 states on the X axis, only nine have Delayed Orders. LOOKUP aligns the numerical data from the series with the correct state on the X axis.
Take a closer look at each parameter.
Parameter One:
X Axis
When using LOOKUP to align data to the X axis, parameter one is often a reference to the X axis values. This gives all X axis data and sets up the alignment of numerical data to the correct points. Use a Reference (third button on the formula toolbar, REF) to reuse a formula you built elsewhere in the Klip. It saves time. It’s not a performance saver, since referencing the X axis recalculates the entire formula.
Parameter Two:

Think of this as a second list of values. Here, it’s not all states (B:B) on the X axis, but only those with an Order (F:F) that is Delayed.
Parameter two adds some complexity. This data needs to return matches to at least some items on the X axis: states. You only want the states with delayed orders, so use SELECT to specify a simple condition: “F:F = Delayed.” If you only use this SELECT statement and leave out GROUP, you’re left with this data

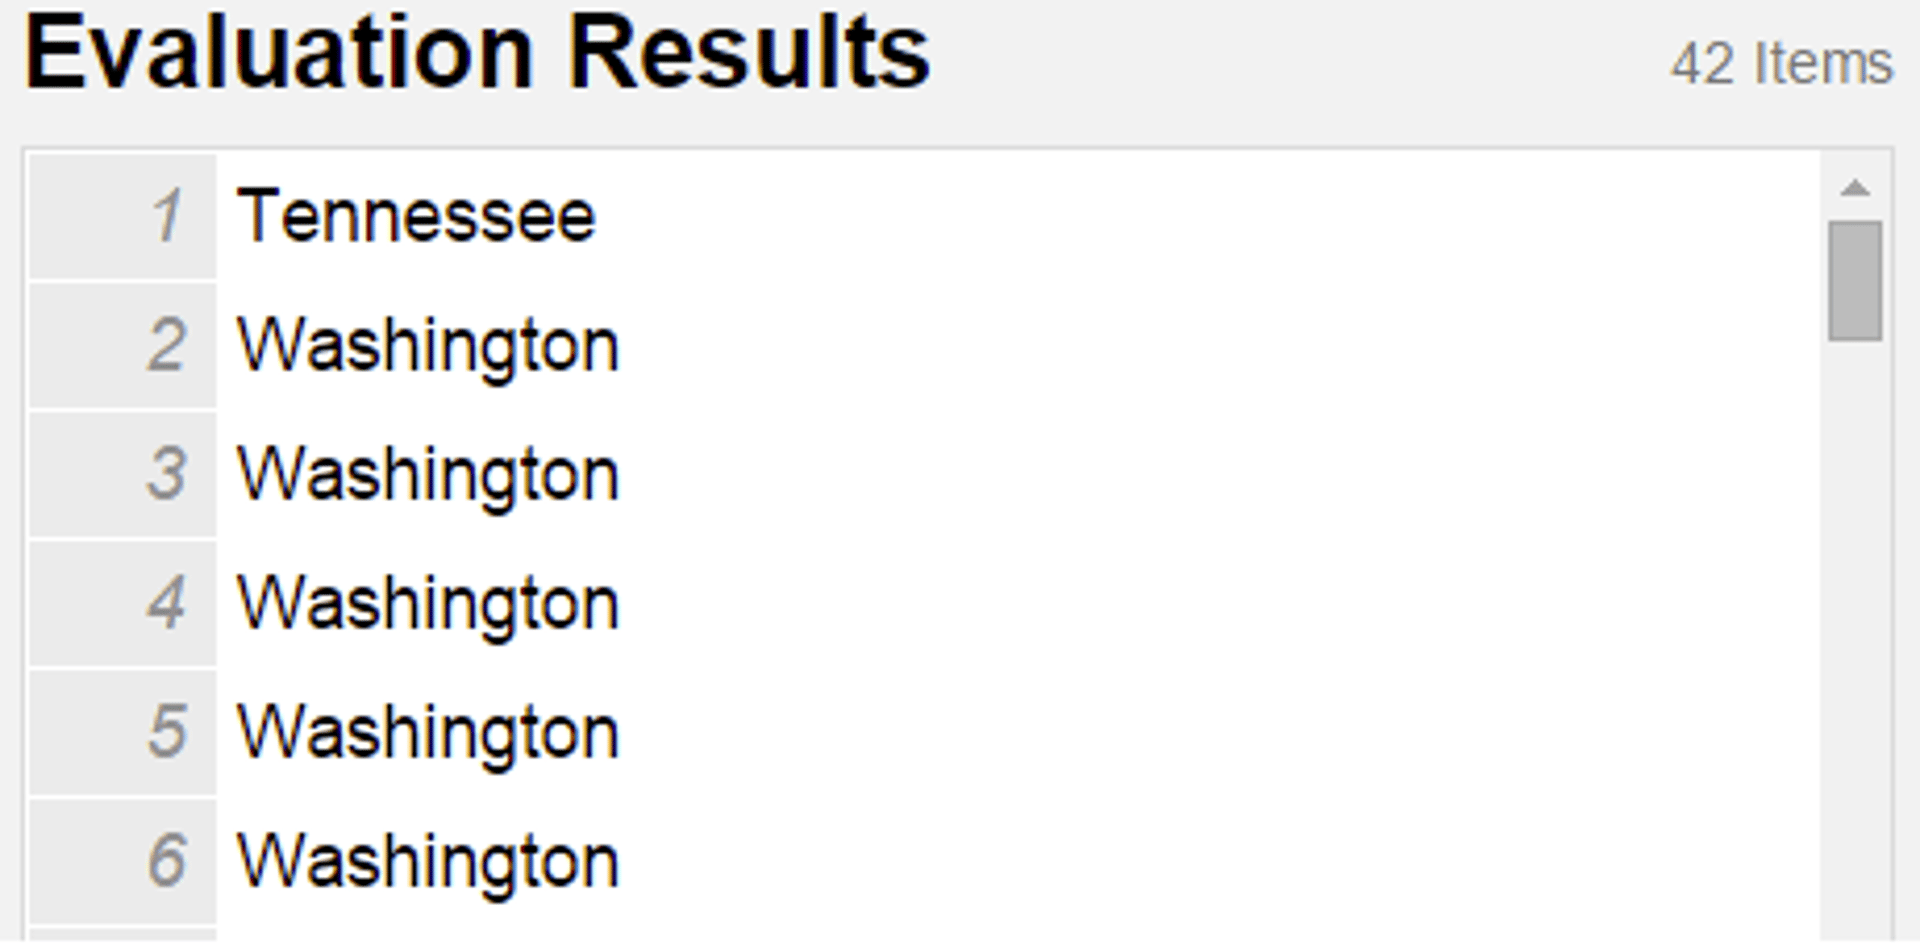
You see the 42 items in the data source where the orders are delayed, with many repeating values.
LOOKUP searches for matches in this list and stops once it finds one. So when it arrives at the first record for “Washington,” it matches an X axis data point, moves on to the third parameter, and uses the value for that Washington order. It ignores the four other Washington matches and moves to the next state.
This is why GROUP is used.

With the list of states with delayed orders GROUPed to remove duplicates, LOOKUP can identify a single match per state.
Which brings us to parameter three, where everything comes together.
Parameter Three:

This approach starts with a reference to the X axis (all states), looks for matches in a smaller set that meets a condition (some states), and, where a match is found, runs this formula.
GROUPBY lets you perform calculations on GROUPed data. Here, the goal is to calculate the value of delayed orders totalled by state where delayed orders exist.
GROUPBY uses three parameters: values, measure, and method.
The first parameter in GROUPBY is the data being grouped. Treat this as a rule. Often you can copy the formula from an X axis, or another part of your Klip, and paste it here.
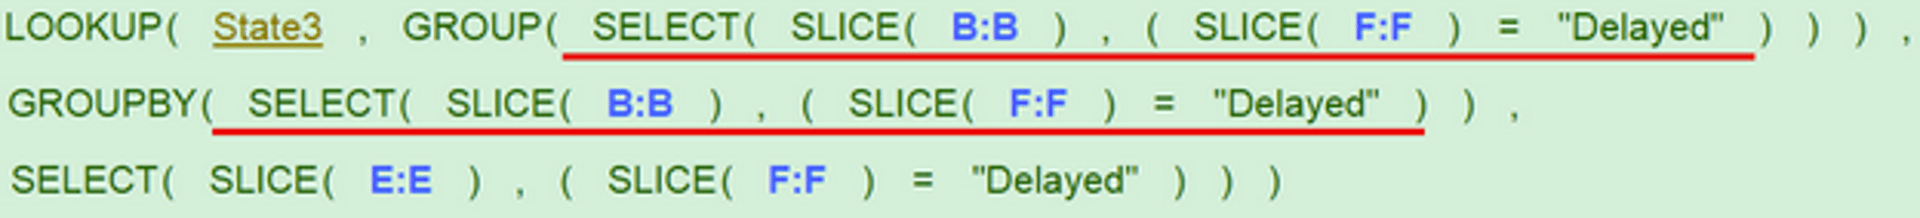
If you look at the complete formula again, the GROUP function is identical to the first parameter of the GROUPBY function (red underlines). Don’t include GROUP inside GROUPBY, since GROUPBY performs that calculation. Reuse the entire contents of GROUP.
The second parameter of GROUPBY is very similar, so copying it often makes sense. It’s also a SELECT statement, with the same condition.
Remember the three parameters of GROUPBY: (data you are grouping) (data being calculated) (type of calculation—leave blank to SUM by default).
To finish GROUPBY, SELECT the data from E:E (# units) where F:F (order status) is delayed. The SELECT statement is identical, but swap B:B (from the first part of GROUPBY) for E:E.
Understanding the LOOKUP formula
The formula looks complex at first. Once you understand a) the number of parameters in each function and b) what each parameter needs and does, you can break it into manageable pieces.
In practice, this pattern shows up often when building dashboards in Klipfolio Klips, including internal dashboards such as the Sales Dashboard. Master it and you’ll have a powerful, versatile tool in your toolkit.
Related Articles

10 Cloud BI Dashboard Tools for Small Businesses in 2026

6 dashboards I use daily to run my SaaS company
By Allan Wille, Co-Founder — April 10th, 2026
Klipfolio Partner How-To #1: Duplicating dashboards across client accounts
By Stef Reid — November 27th, 2025
