New Office, new interactive floor plan in our dashboard

Published 2023-02-01
Summary - Did you know that with Klips you can overlay data over an image file, like a floor plan, to be able to associate a location with the data?
Klipfolio is a platform to visualize various metrics that can help businesses determine the health of their operations and help understand areas where they can optimize performance. This data is typically being displayed on bar charts, tables, and pie charts just to name a few. But what about having the ability to overlay your data over an image file such as a floor plan to be able to associate a location with the data?
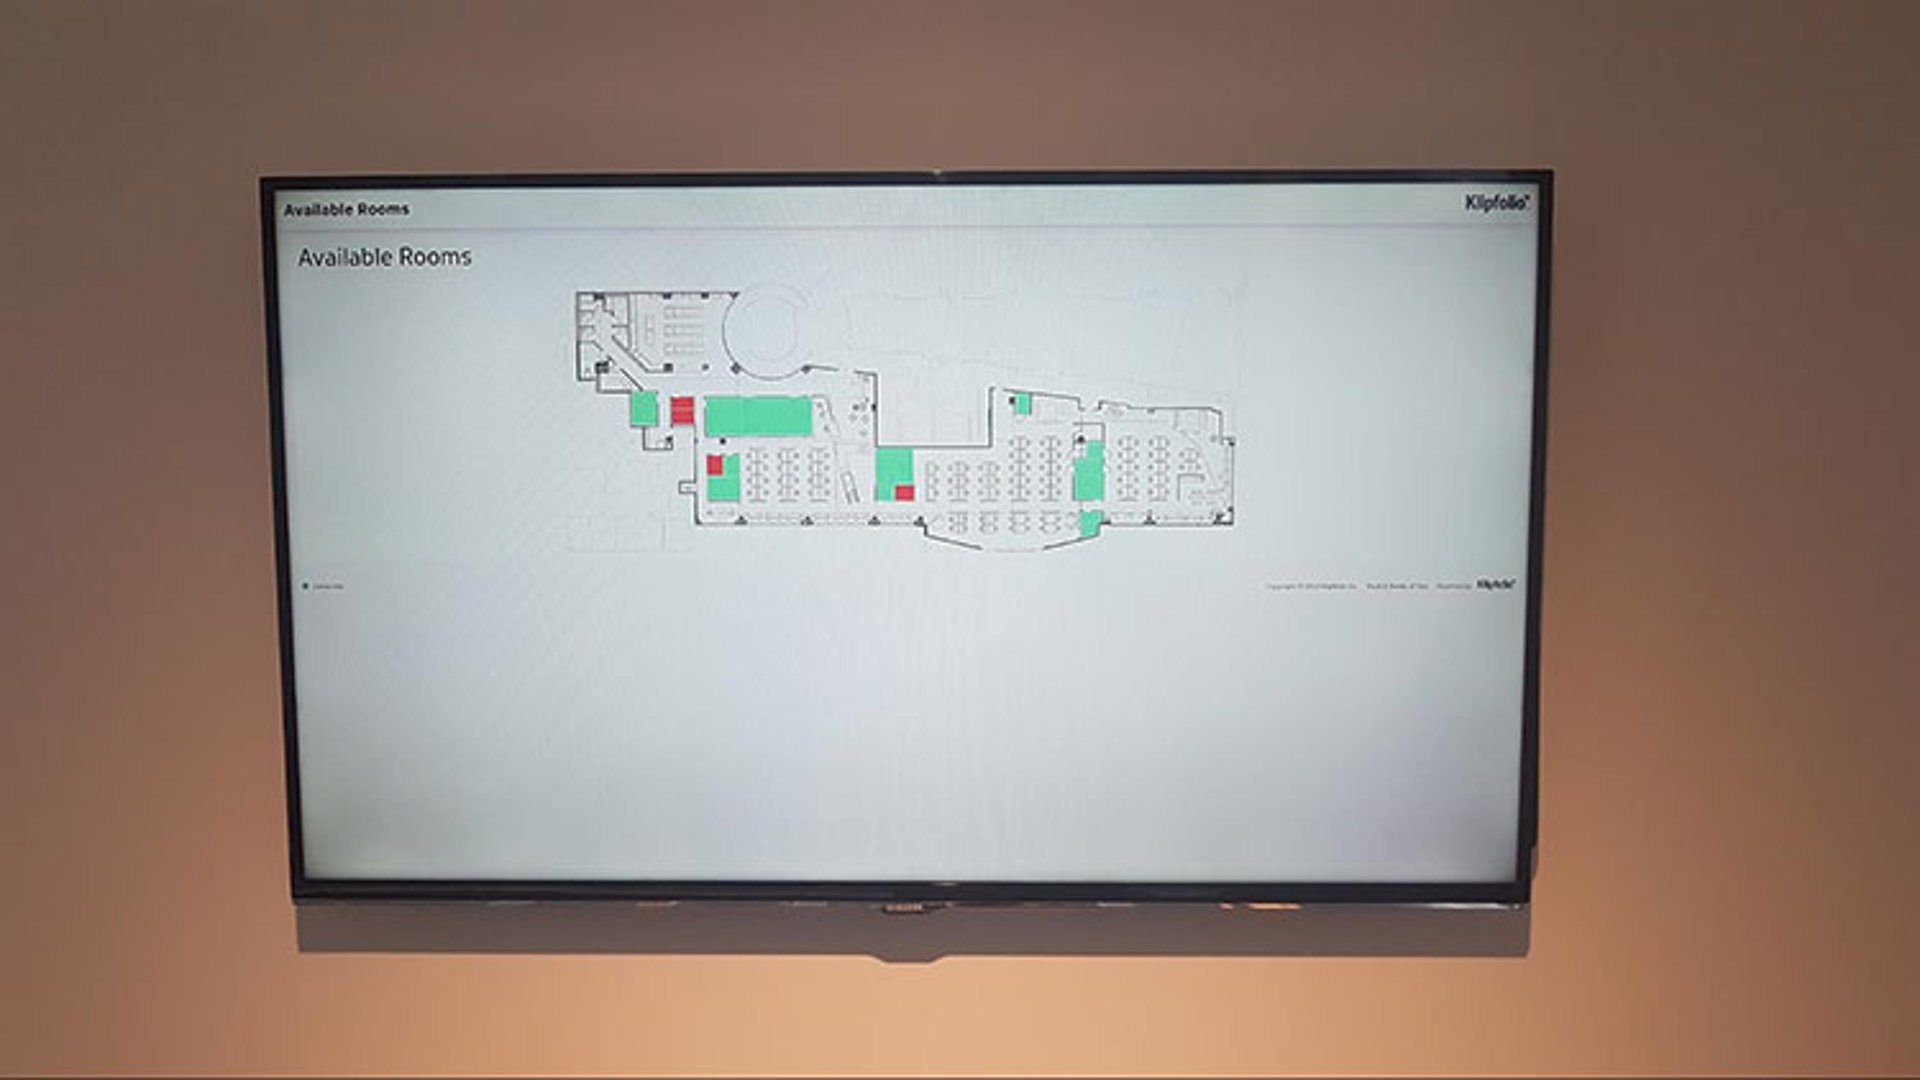
Some information that could be displayed is which meeting rooms in your office are currently being used, but could become much more in-depth and applied over different sectors and industries. For example, a factory could break down their production into areas and display output data for each of these areas to determine how each area is producing. Another example could be in the healthcare industry where you could display data overlaid on rooms such as when the current patient is due to be discharged by displaying varying colours to represent different timeframes.
Whatever your intentions are for the visualization, as long as you are able to map the locations where this data is coming from and you have the data output, it can be visualized.
Klipfolio offers a Map component that allows you to visualize your data from different provinces, states and even countries (depending on your desired level of granularity). The Map component itself displays an SVG which with the correct knowledge, can be edited or for the more advanced users created from scratch of just about anything.
As a proof of concept, we came up with the idea that we wanted to have a dashboard that displayed the floorplan to our new office, with an overlay of which meetings were currently available, occupied and becoming available in the next 5 minutes. The reason we came up with this idea is because moving to the new office and having so much more space, people were having a difficult time finding rooms. To add to this, we oftentimes have customers call in and we have to find a room quick so we are able to have a quiet space to help customers.
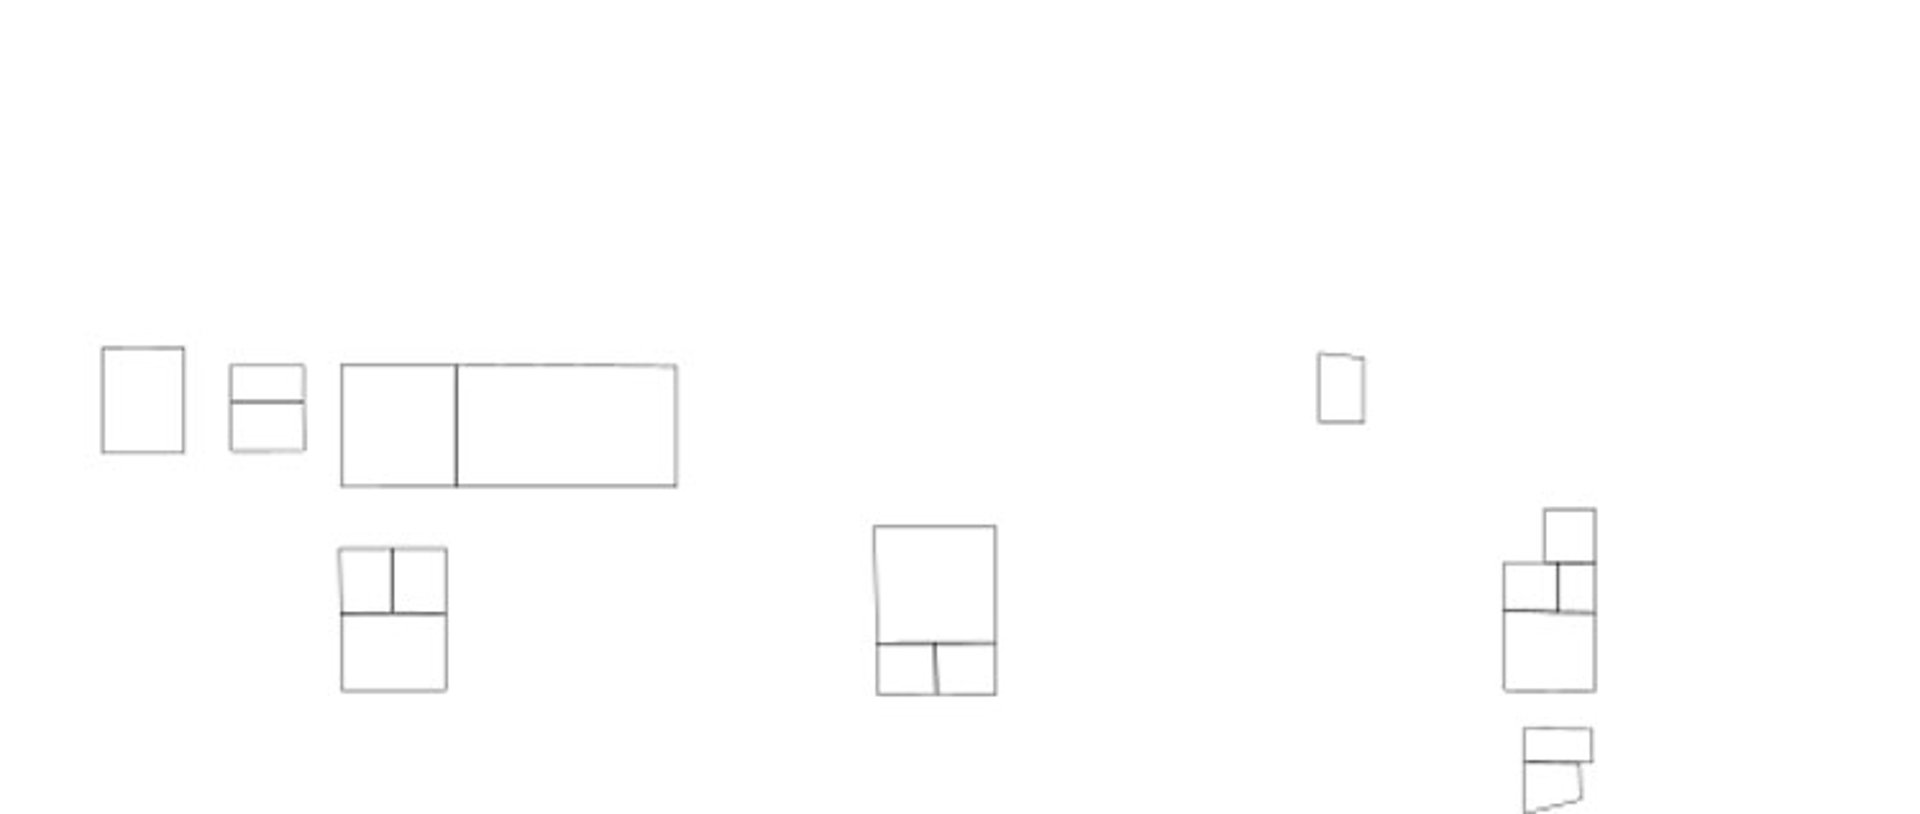
The first thing we needed was an image of the floor plan of our office so that we had something we could build the SVG file off of. Next came the tedious process of mapping each individual room by tracing the walls and connecting the polygon to define the outline of the room and naming it to know which room it was. Once we completed tracing all of the rooms we wanted to display data on, the SVG file was complete!
The next step was to make the image of the floorplan publicly accessible so that we could reference it in an HTML component. I used Imgur however you can use any site as long as you have a URL that is publicly accessible. The reason we need to use an HTML component is because the SVG file that is uploaded to Klipfolio cannot have an image in the file, it will just show the polygon boxes.

Now that we have our SVG file and our image, we can upload the SVG file into the Map component using the custom map and display the image using HTML.
Klipfolio using Google Calendar for each employee so in order to get the data of which meeting rooms are available we needed to get the calendar information for each bookable meeting room. This required us to use the Today endpoint for google calendar, with an uploaded excel file with each unique ID for all of our meeting rooms. We then created a dynamic datasource with the TODAY endpoint the used a MAPFLAT to iterate through each calendar and get all of the events for these rooms for today.
Given that we wanted to display the rooms thats are currently booked, available in 5 minutes and not booked we need to include logic for these three cases. We did this by checking the start and end dates against our NOW function in Klipfolio.

If you need help building something like this for a project of yours, you can always check out our Data Hero services!
Related Articles

Anatomy of a great API
By Danielle Hodgson — January 21st, 2026
Klipfolio Partner How-To #1: Duplicating dashboards across client accounts
By Stef Reid — November 27th, 2025
The Starter Guide to Dashboard Design
By Emily Hayward — September 24th, 2025

