

3 KPIs that carriers and shippers should be tracking
Three core KPIs carriers and shippers should track to improve delivery performance, cash flow, and customer satisfaction. This article covers cash-to-cash cycle time, inventory turnover rate, and customer fill rate (OTIF), explaining what each measures and why it matters for asset-driven supply chain operations.

Every supply chain business has different goals at different times. But a few broad KPIs matter for almost every asset-heavy organization, whether you're a carrier, a shipper, or both.
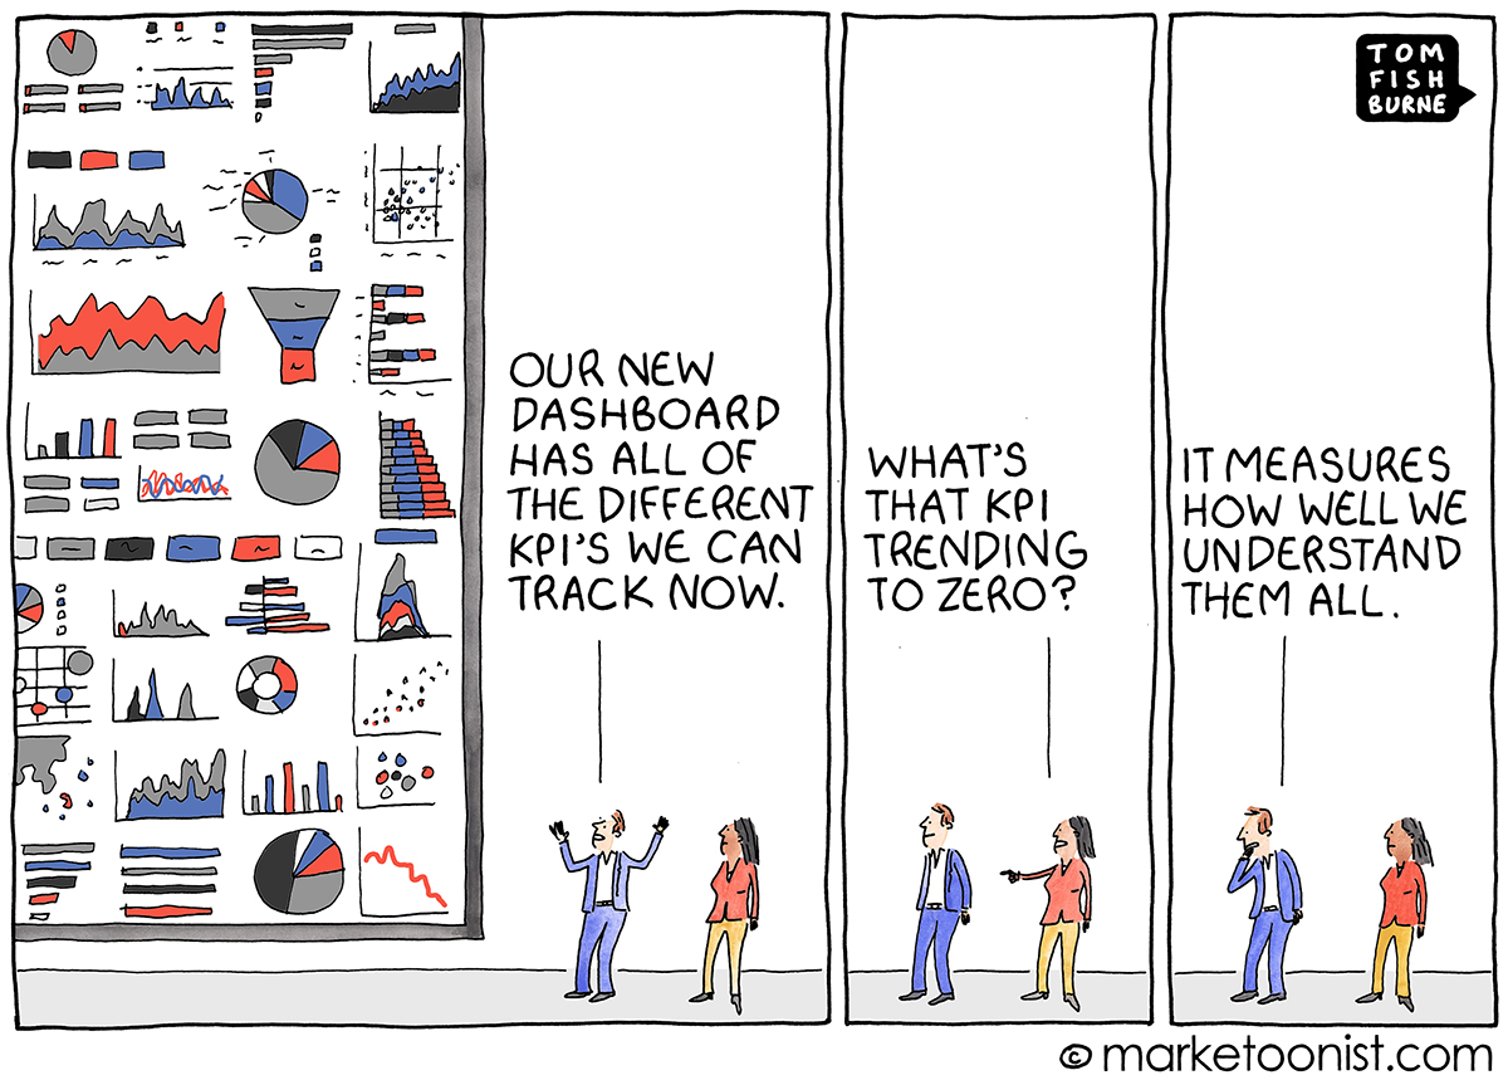
Selecting the right supply chain metrics is harder than it sounds. In some cases, managers hurt performance by tracking too many KPIs at once.
Experts note that having 6 to 8 KPIs in a single department can cause overload or system failure due to overanalysis. Track only what connects directly to your outcomes. More metrics don't mean more clarity.
This article covers three core KPIs for asset-driven service providers and why each one matters. Use them as a starting point, then add what fits your operation.
Top 3 KPIs for shipping
These three KPIs give carriers and shippers a reliable read on delivery performance, cash flow, and operational efficiency.
1) Cash-to-cash cycle time
Cash-to-cash cycle time tracks how long it takes to turn a cash outflow into a cash inflow. Specifically, it measures the time between when a business pays its suppliers and when that business collects payment from its customers.
In an asset-intensive industry where goods move fast, cash visibility isn't optional. Knowing your cycle time tells you whether the operation is generating cash efficiently or quietly bleeding it.
Shorter cycles often signal a leaner, more profitable operation. The metric also shows how well you're using assets and resources to deliver reliably.
Aim for shorter cash-to-cash cycles, but balance supplier and customer needs. An overly aggressive target can strain inventory or supplier relationships. Consistent monitoring keeps both asset management and financial decisions grounded in real numbers, not estimates.
2) Inventory turnover rate
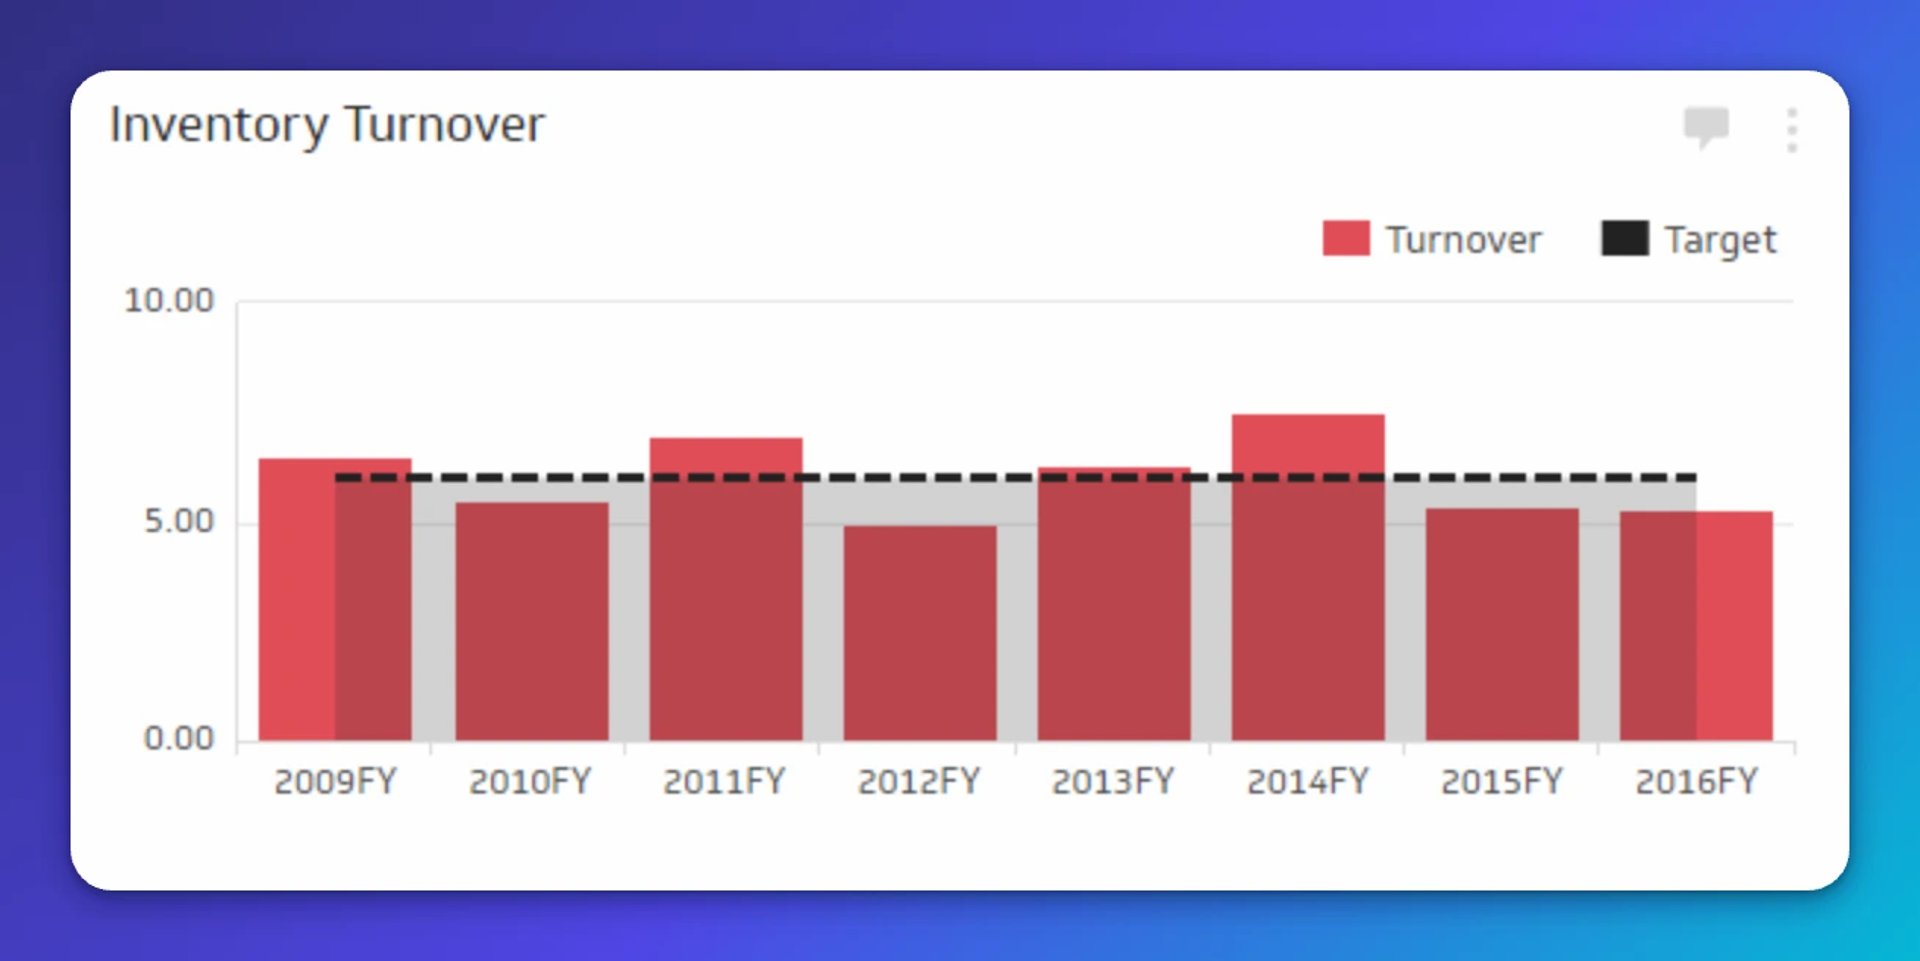
Inventory turnover measures how many times inventory sells and is replaced over the course of one year. It's a direct signal of velocity and efficiency across the flow of goods.
Turnover also reflects demand. If inventory turns quickly, the market is active for those products.
For most categories, faster turnover improves revenue and reduces storage costs. Track this KPI over time and compare it against your category norms. If turnover accelerates, consider testing price, packaging, or mix changes to capture the upside.
The goal isn't just a good number. It's knowing what the number is telling you about where to act next.
3) Customer fill rate (OTIF)
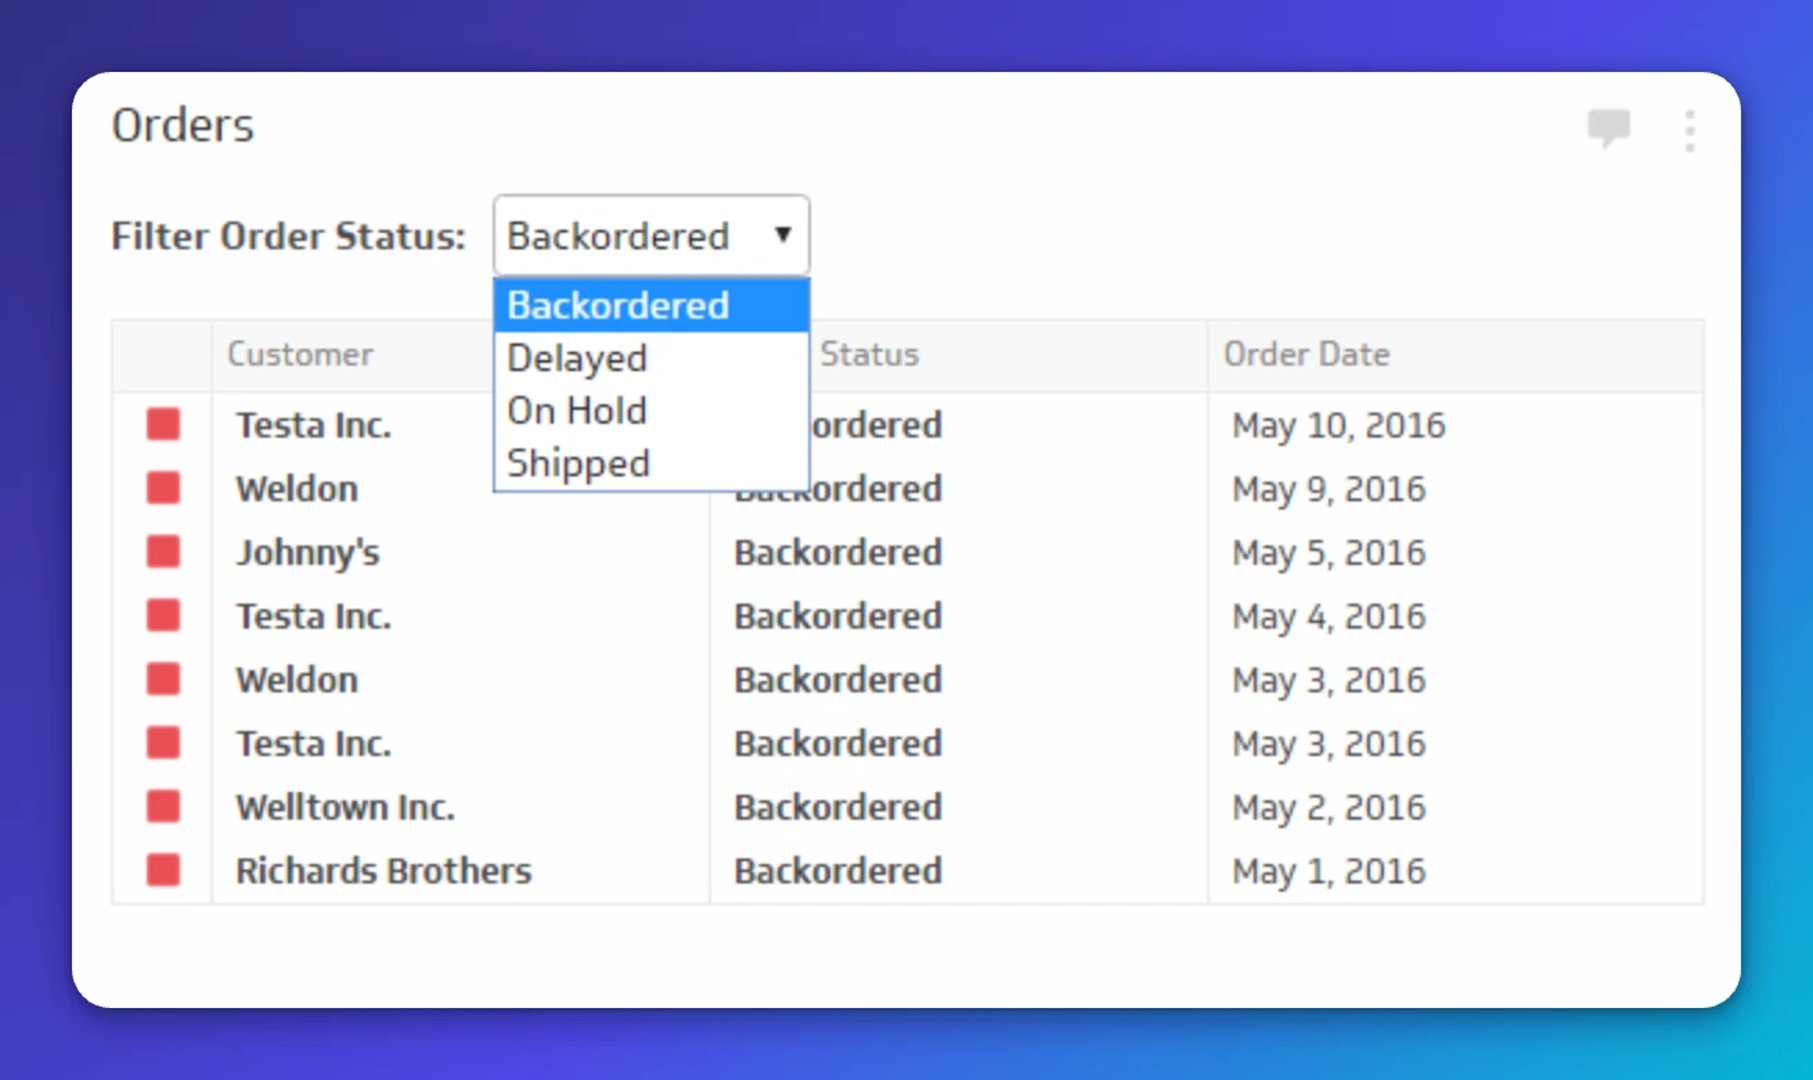
Customer fill rate shows the percentage of orders you can fulfill from current stock. It tells you whether you can consistently provide reliable delivery without frequent backorders and delays.
Because the aim is to deliver orders on time and in full, this KPI is often called On Time In Full (OTIF).
For warehouses, fill rate depends first on inventory. It can also be affected by staffing levels and supplier lead times. For carriers, meeting OTIF means delivering without damage and avoiding transit delays.
Using OTIF across suppliers, warehouses, and carriers encourages collaboration across the chain. When everyone is accountable to the same measure, gaps surface faster and finger-pointing drops.
A low fill rate is rarely a mystery once you're tracking it. The number points directly to where inventory, staffing, or supplier timing is breaking down.
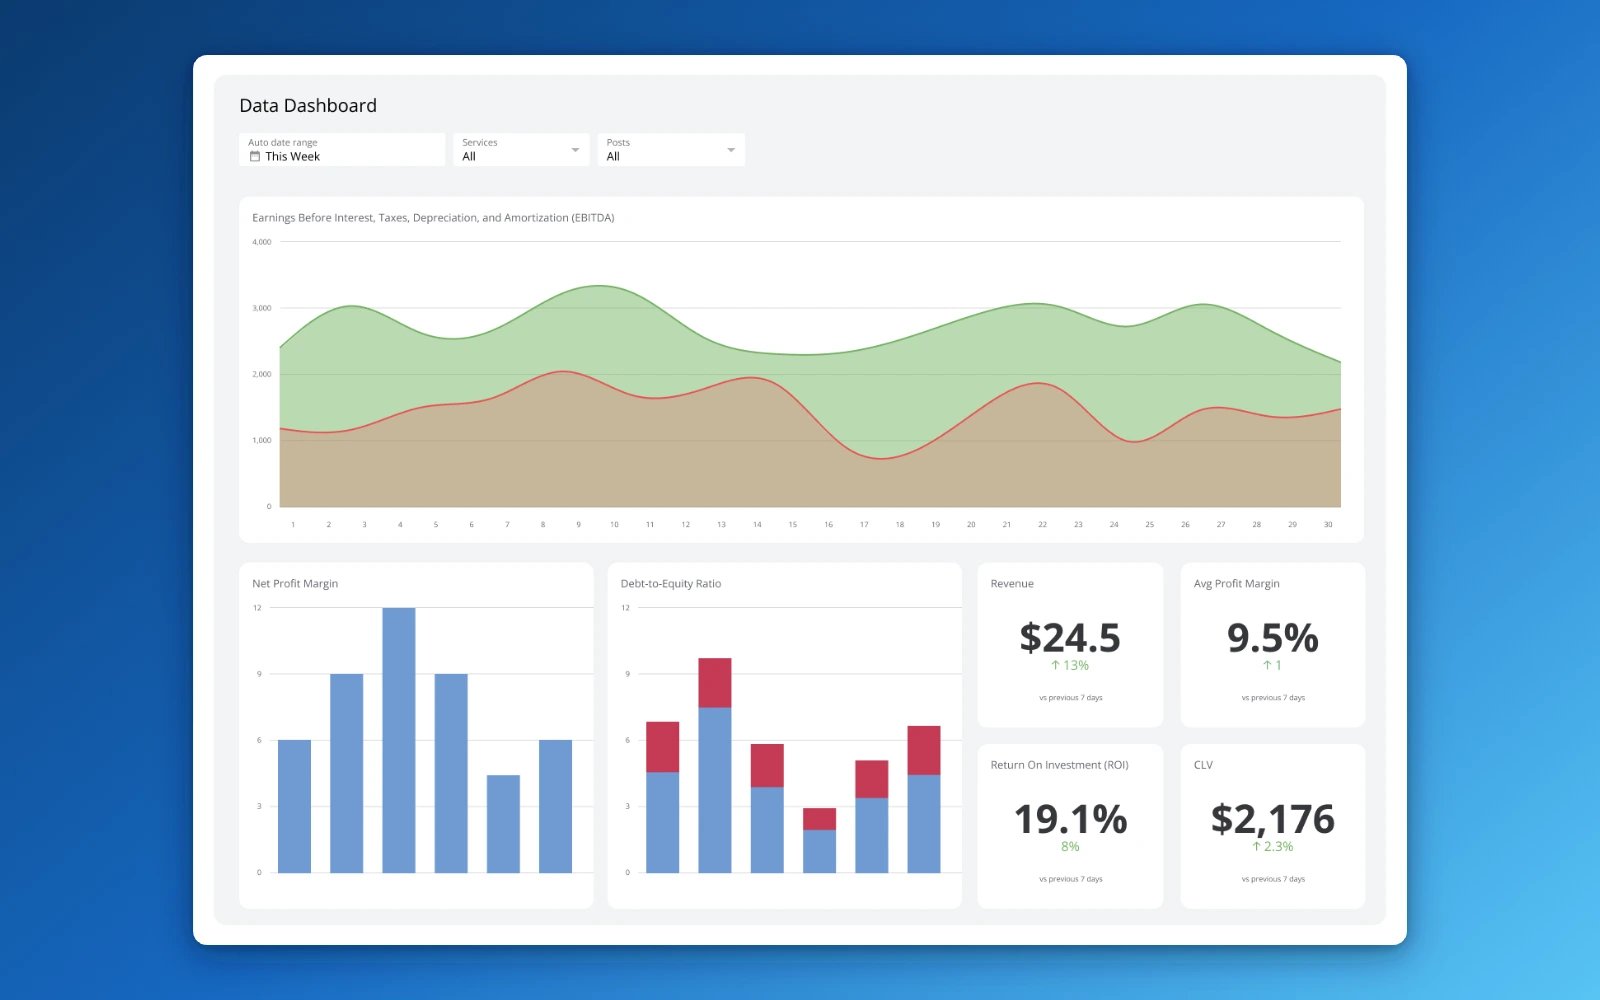
Create custom dashboards for you and your team.
Get started with KlipsStart with three, then build
Too many KPIs create noise. A focused set gives you and your team a clear picture of what's working and what needs attention.
OTIF, inventory turnover, and cash-to-cash cycle time each answer a different question: Are we delivering reliably? Are goods moving efficiently? Is cash flowing the way it should? Together, they give leaders the confidence to make faster, better-informed decisions without digging through spreadsheets or waiting for someone to pull a number.
Updated 2026-09-09




Most recent
- SEP 25What SOC 2 taught a small team about trust
- SEP 15The AI race: progress, humanity, and trust
- SEP 9The good advisor
- AUG 11Beyond simple sign-ups: how True Trials and Activation predict growth
- JUL 7Why business leaders miss important trends in their dashboards
- JUN 19The best chart for the job: Visualizing data for non-technical users