
Summary - The use of business dashboards by nonprofits and other socially-driven enterprises is on the rise. Here are a few examples of how business dashboards are helping organizations make social impact.
I've met and worked alongside countless international and grassroots nonprofits during my work covering issues of human rights and environmental degradation. Although these groups have many things in common—most have big hearts and a relentless desire to transform conflict—there is often one component that separates the good from the great: Organization.
Part of such work being a success, whether it is in trying to help those caught in an environmental disaster or those suffering under the burden of war, depends on fundamental business aspects such as tracking inventory and measuring impact.
These aspects can of course become incredibly difficult to implement in areas where it's challenging and even dangerous to deliver supplies.
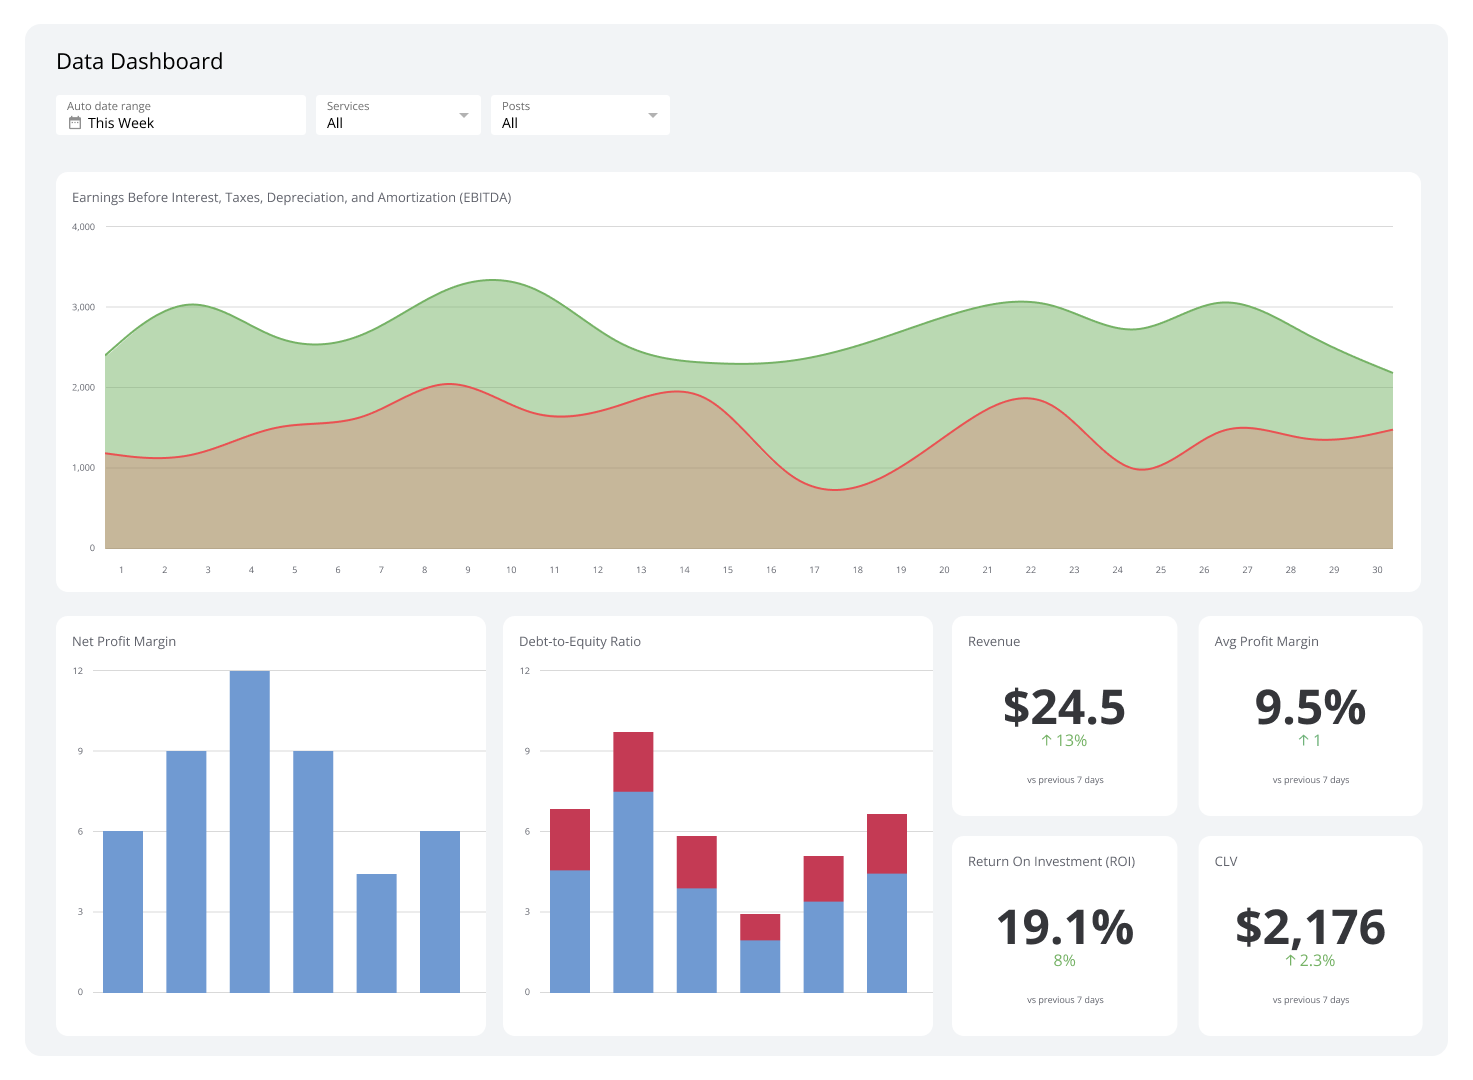
So it should come as no surprise then that I love seeing business dashboards used for such purposes. In allowing organizations to easily pull in, update and distribute the important data they're collecting, dashboards can play a significant role in helping to scale impact.
So while a crusty old notebook will always be necessary for certain types of field work, leveraging the power of business dashboards can help peaceworkers of all types be better organized and ultimately do better work.
Here are a few use cases I've discovered:
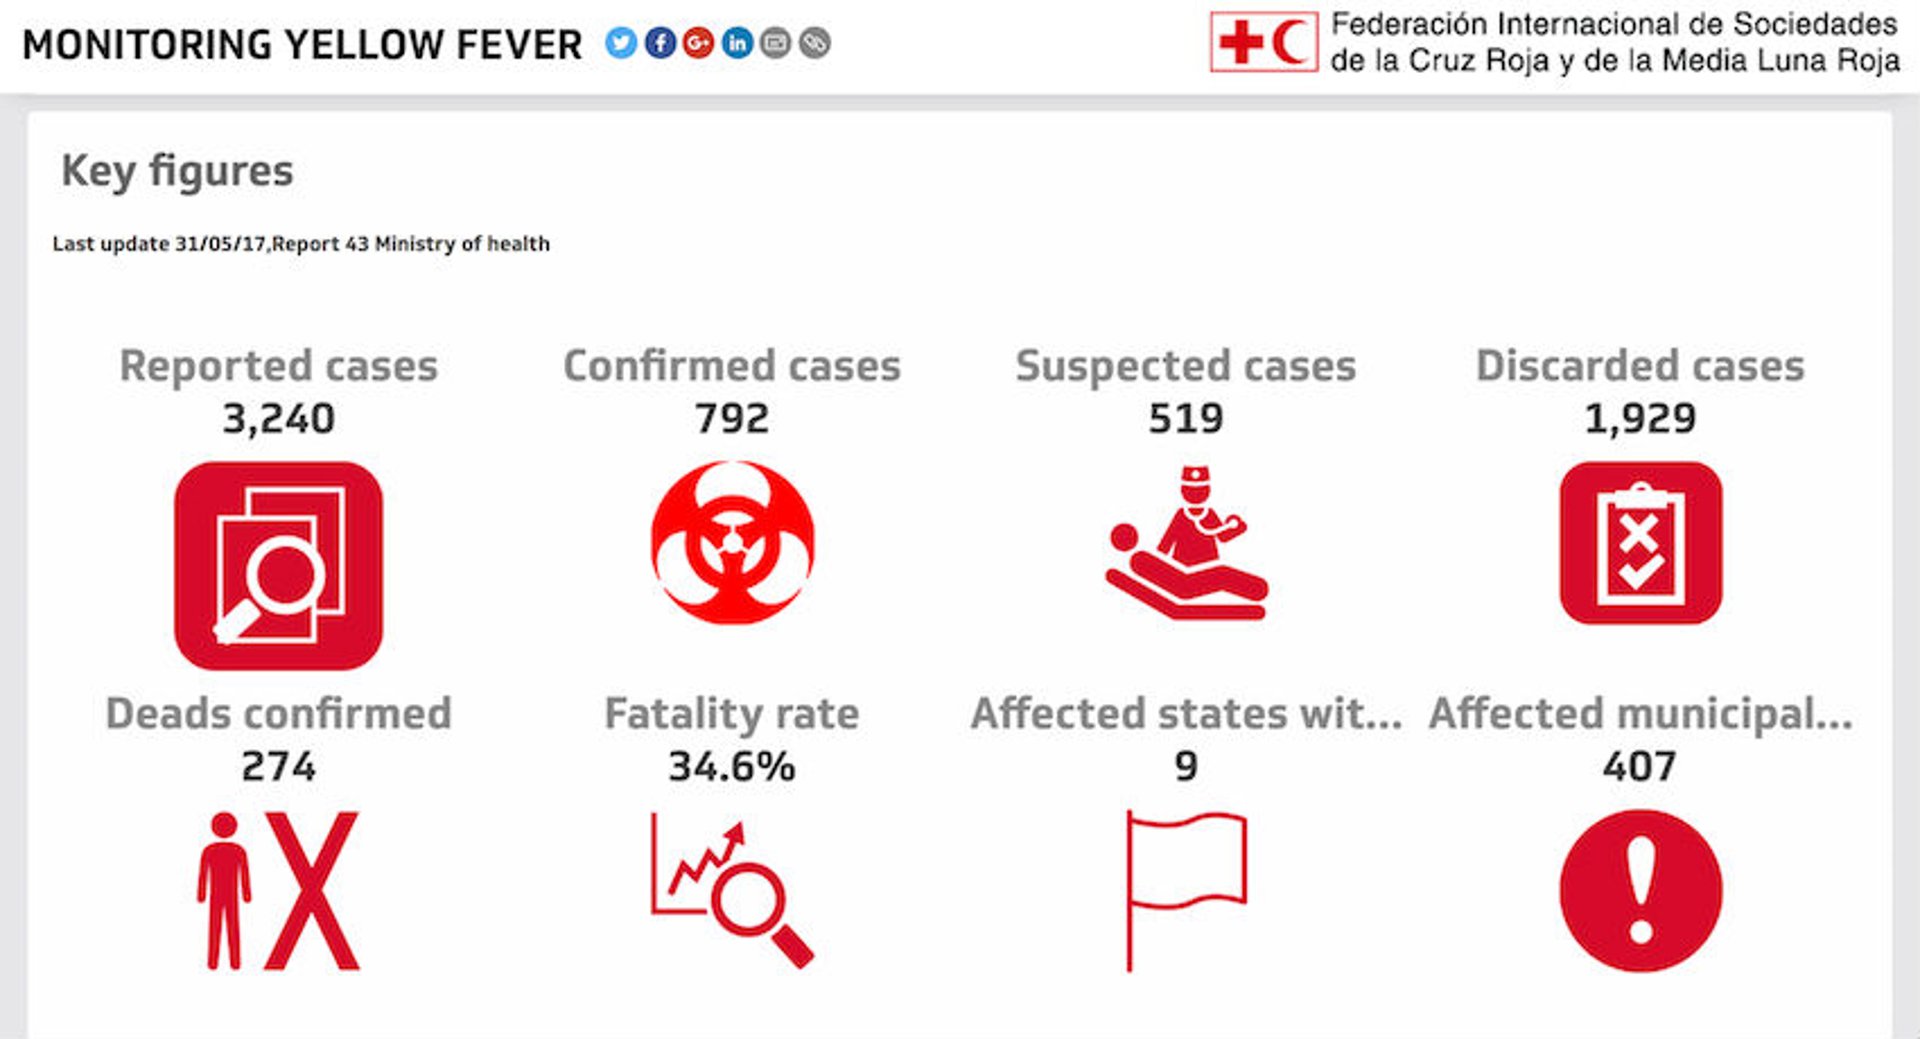
Monitoring Yellow Fever
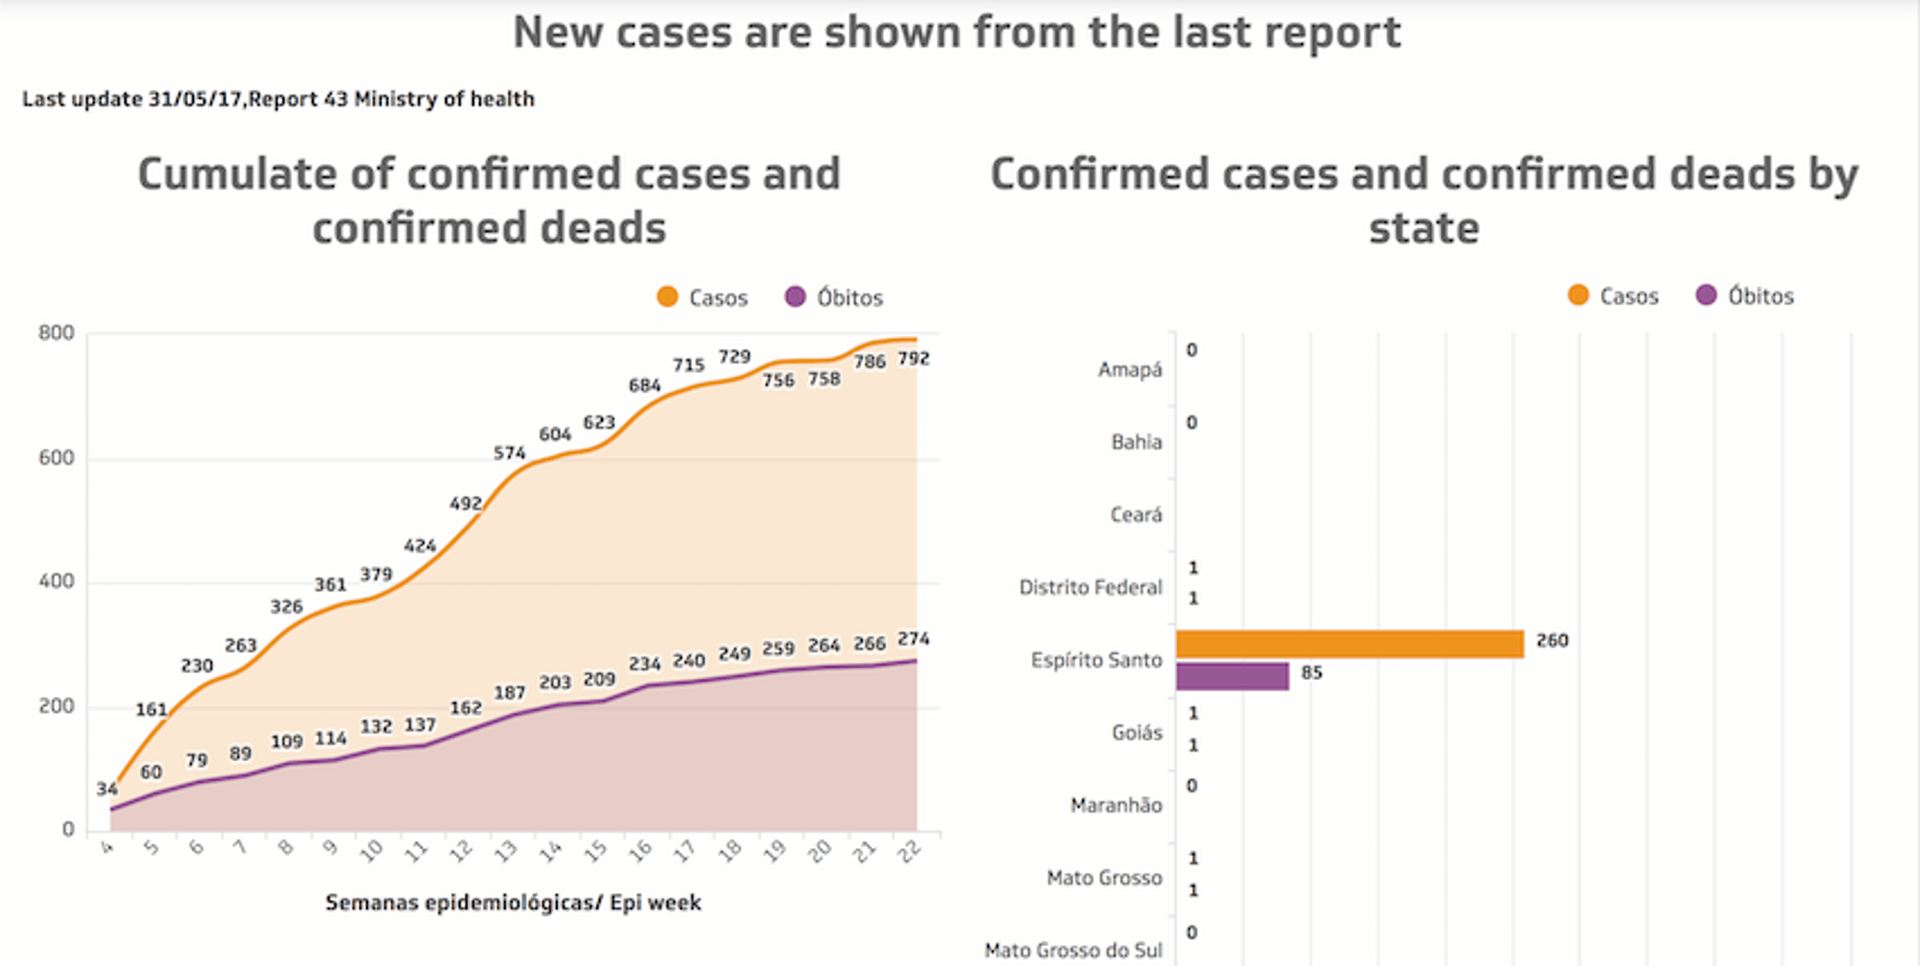
This dashboard (see live example here) from the Brazilian Red Cross monitors the key figures in their fight to combat yellow fever.
In visualizing the data, they're able to quickly see and show others how the viral disease is impacting (or not) certain regions. If a picture is worth a thousand words, a dashboard like this can be worth a thousand reports (and can quite literally help the Red Cross save lives).
Supporting the Tim Horton Children's Foundation

In a private dashboard used internally, Solink, a leading cloud-based loss prevention solution for multi-site businesses, paired up with us and Tim Horton's to support a good cause.
On May 31, 2017, they hosted a competition to visualize the progress across the many franchisees at Tim Horton's who are on the Solink network. The franchisees donated proceeds of coffee sales to send underprivileged children to camp, and the five stores that sold the most coffee were awarded a free month of Solink.
The dashboard, as it updated in real-time and could be accessed by every store, had one column that showed the leading stores per hour and another column that showed the overall leaderboard.
It served at once as a way to see results and as a way to encourage some friendly competition to raise money for the Tim Horton Children's Foundation.
Assessing the effect of Hurricane Matthew in Haiti
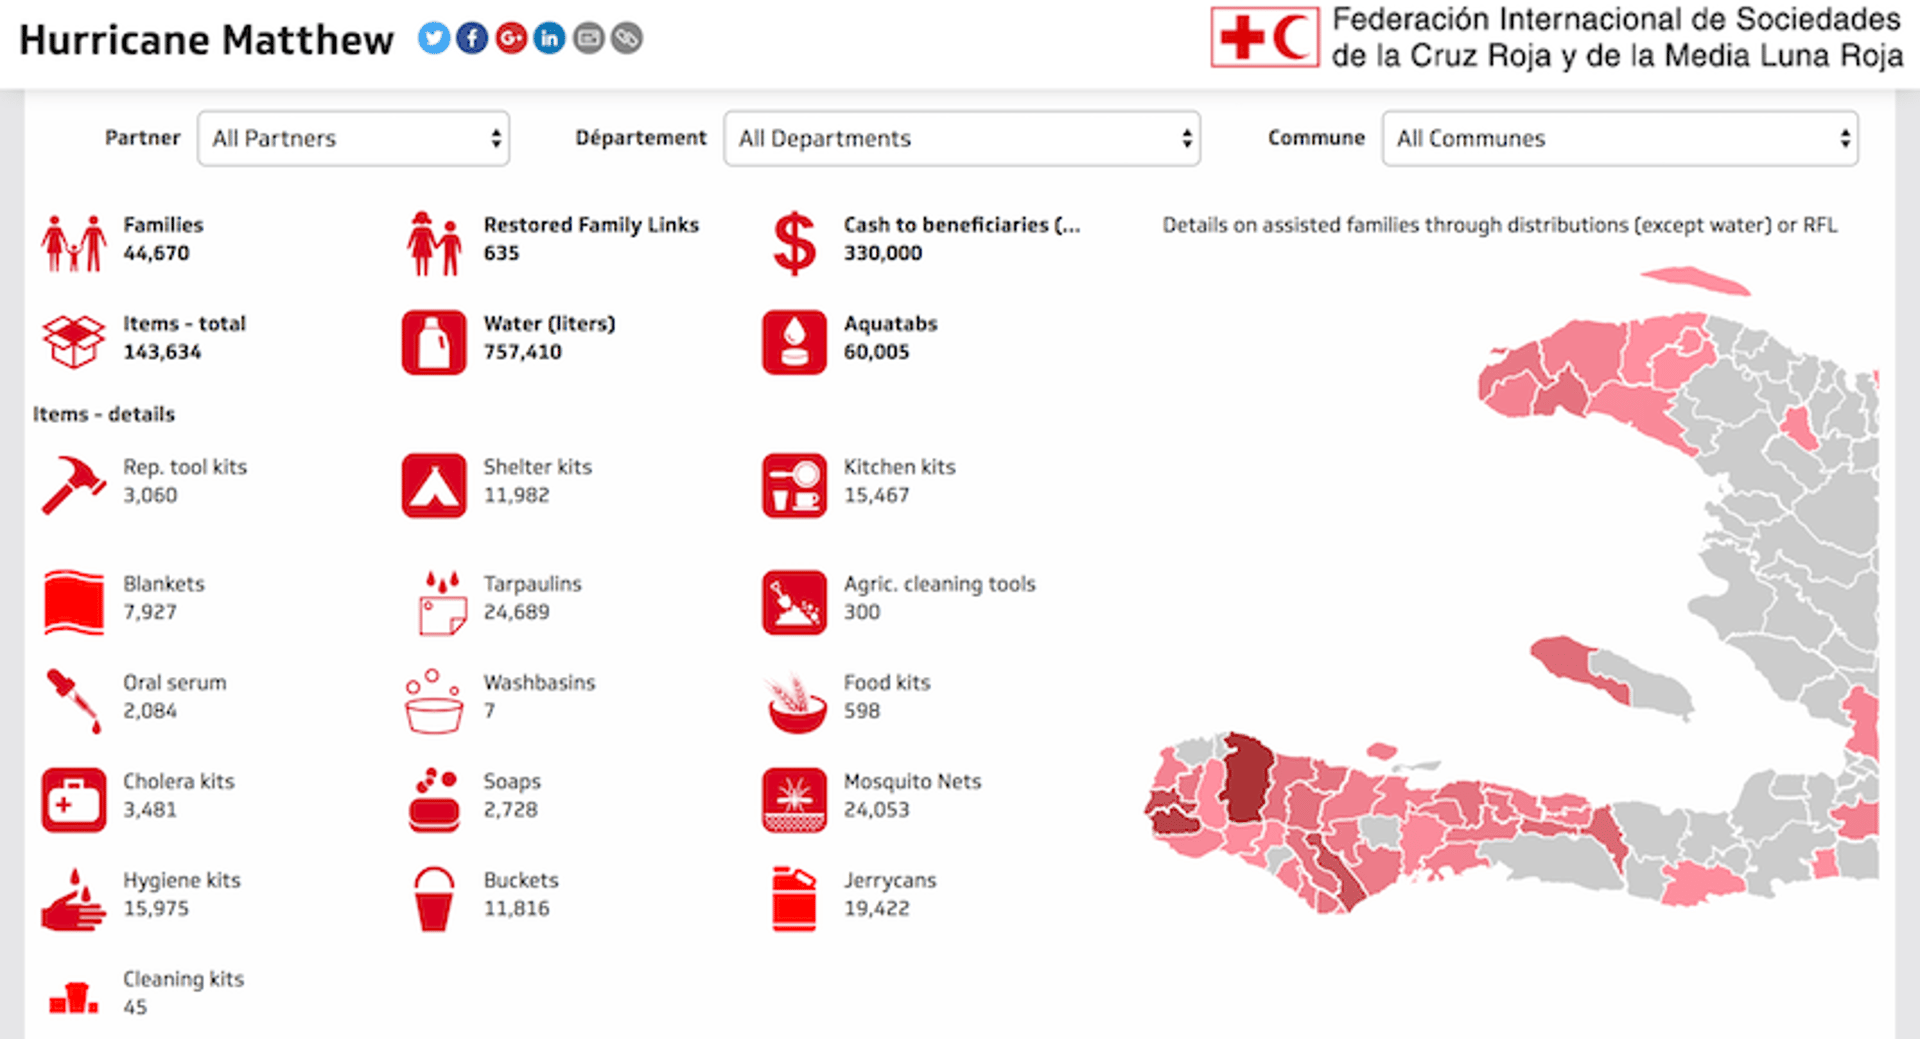
In another example from the International Red Cross, this dashboard (here is the live link) tells the data story of Hurricane Matthew's brutal impact on Haiti.
This type of dashboard helps an organization quickly share information with key constituents and show the impact of their work in a way that a 10-page report simply is not able to do.
In a glance you can see how many families were helped alongside other important data—such as how much water was delivered and how many mosquito nets were handed out. Additional, you can see precisely which supplies each partner contributed to the effort.
Final thoughts on business dashboards for a social cause
The examples here represent only a few of those I've come across, and there are countless other use cases out there.
As global citizens, much of societal progress is about pitching in and helping each other out—even if it means getting dirty and acting more quickly than we'd like.
But business dashboards can be an important tool in driving toward such progress. Nonprofits, for example, can at once convey a sense of transparency while creating organized data visualizations that allow them to better show the social impact of their work.
This, in turn, can help them earn the recognition and grants they need to sustain themselves.
If you're a nonprofit organization interested in using Klipfolio at a discounted rate, contact us here.
Related Articles

6 dashboards I use daily to run my SaaS company
By Allan Wille, Co-Founder — April 10th, 2026
Klipfolio Partner How-To #1: Duplicating dashboards across client accounts
By Stef Reid — November 27th, 2025
The Starter Guide to Dashboard Design
By Emily Hayward — September 24th, 2025