
SaaS Dashboards
Use dashboards to track SaaS metrics for each team in your business.
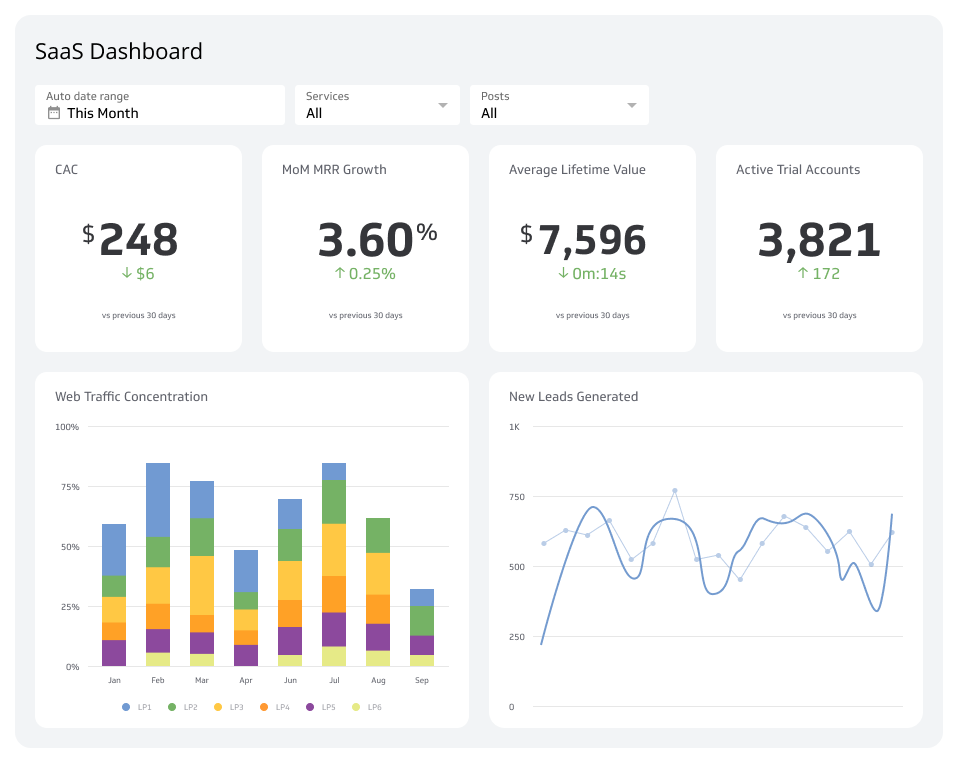
What is a SaaS dashboard?
A SaaS dashboard gives you real-time visibility into the metrics that drive your business: revenue, retention, acquisition, and growth, all in one place.
If you run a SaaS company, you already know the numbers that matter. Monthly Recurring Revenue (MRR), Customer Acquisition Cost (CAC), Customer Lifetime Value (CLTV), churn. The problem is rarely knowing which metrics matter. The problem is getting them out of spreadsheets, out of your CRM, and out of your head, and into a format your whole team can act on.
SaaS Dashboard Examples
- SaaS
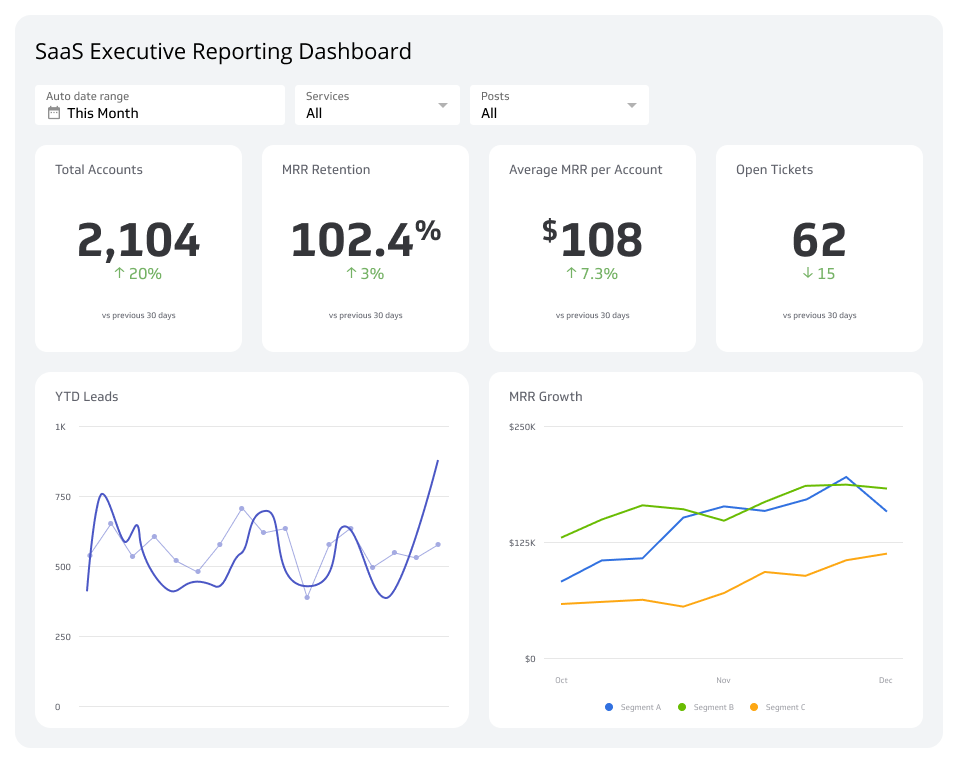
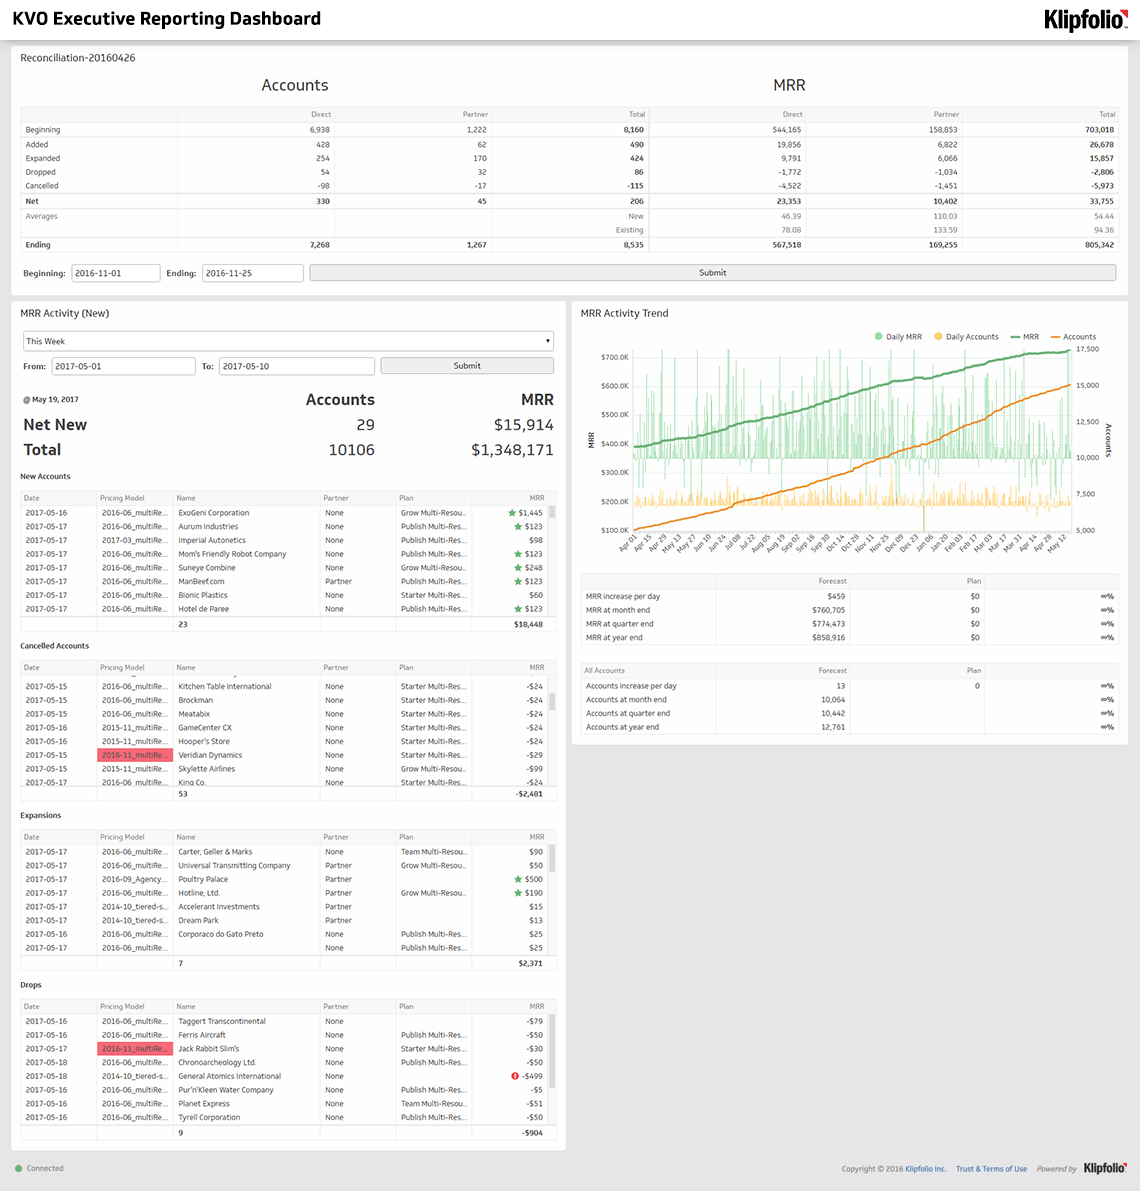
SaaS Executive Dashboard
Track the metrics that matter and steer your startup to success.
- SaaS
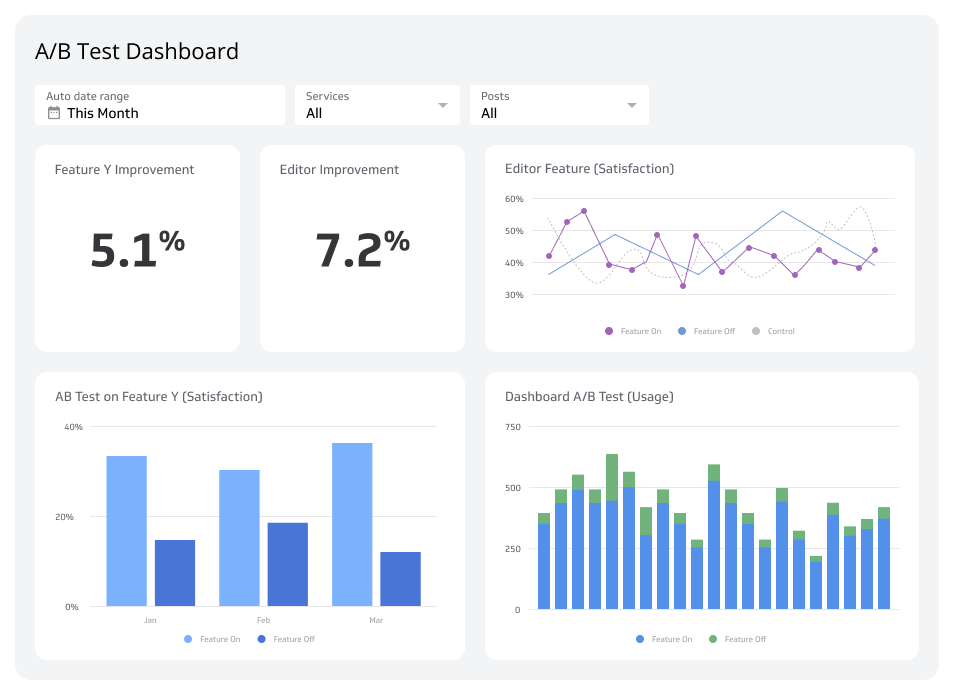
A/B Test Dashboard
Track and measure A/B test results to make data-driven decisions.
- SaaS
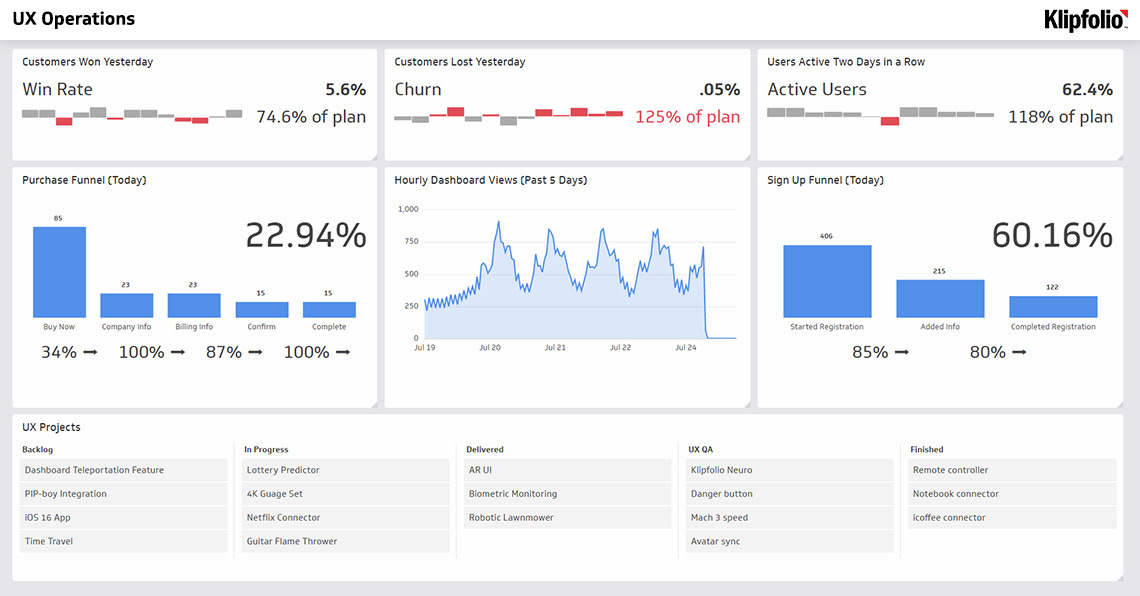
User Experience (UX) Dashboard
The ultimate guide to visualizing user behaviour and improving your product experience.
- SaaS
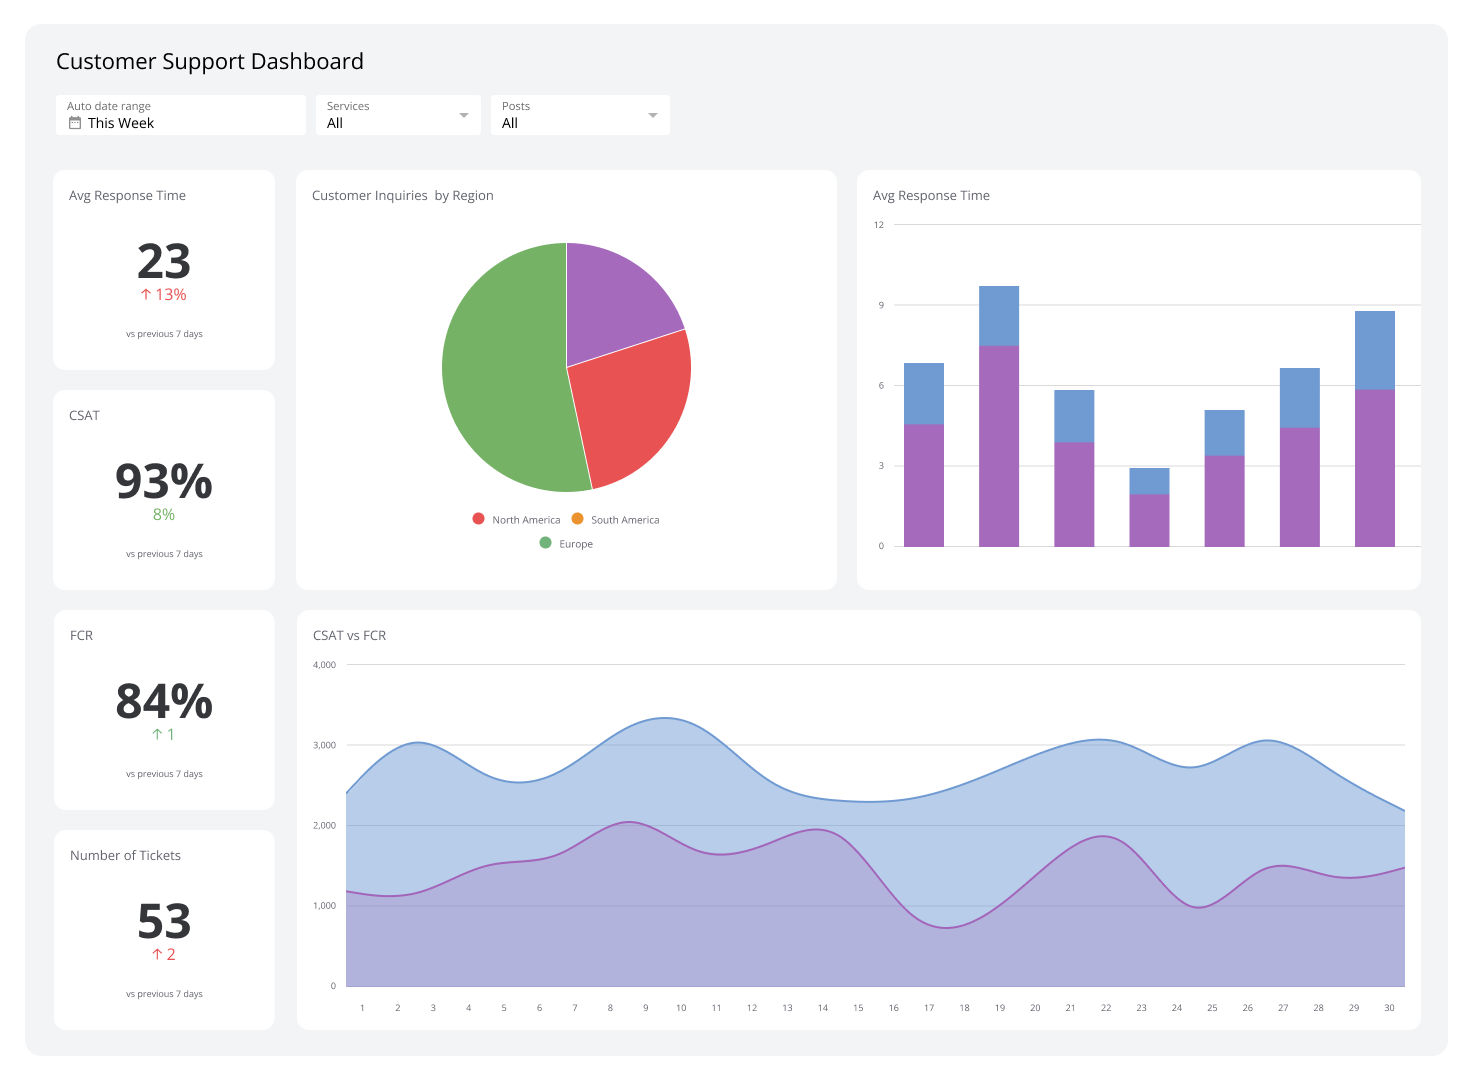
Customer Support Dashboard
Track ticket volume, response times, resolution rates, and agent performance in one real-time view.
- SaaS
SaaS Growth Dashboard
Track MRR, churn, CAC, expansions, and account growth in one live SaaS view.
- SaaS
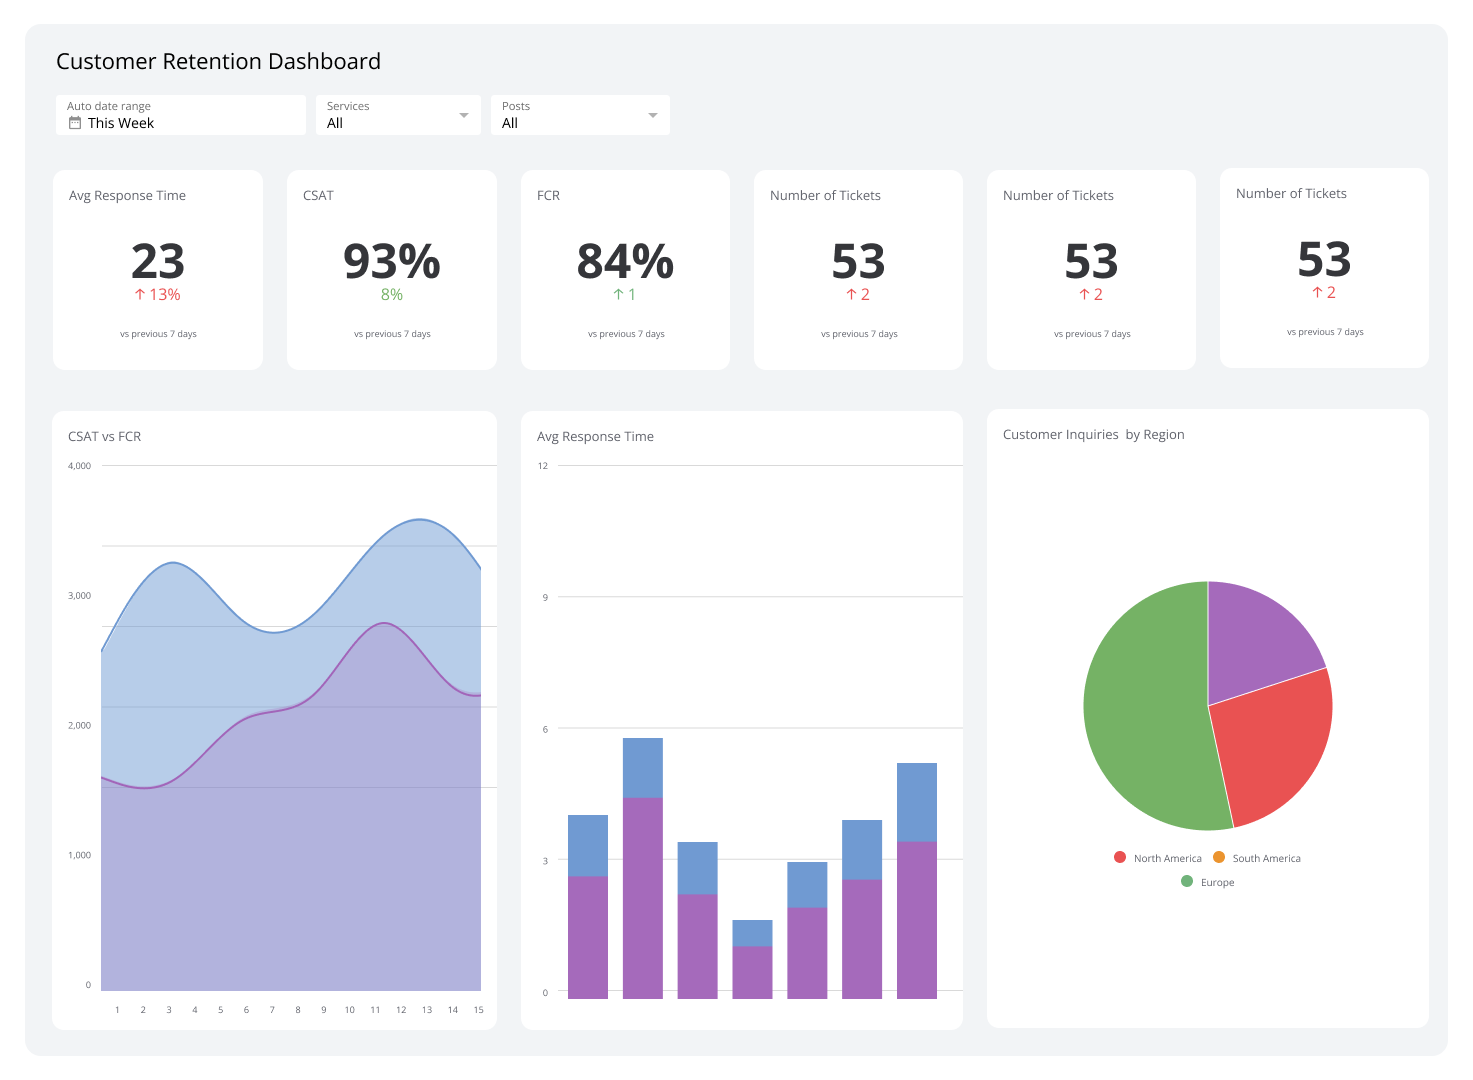
Customer Retention Dashboard
Track net retention, cancellations, contractions, expansions, and MRR in one place so your team always knows where things stand.
- SaaS
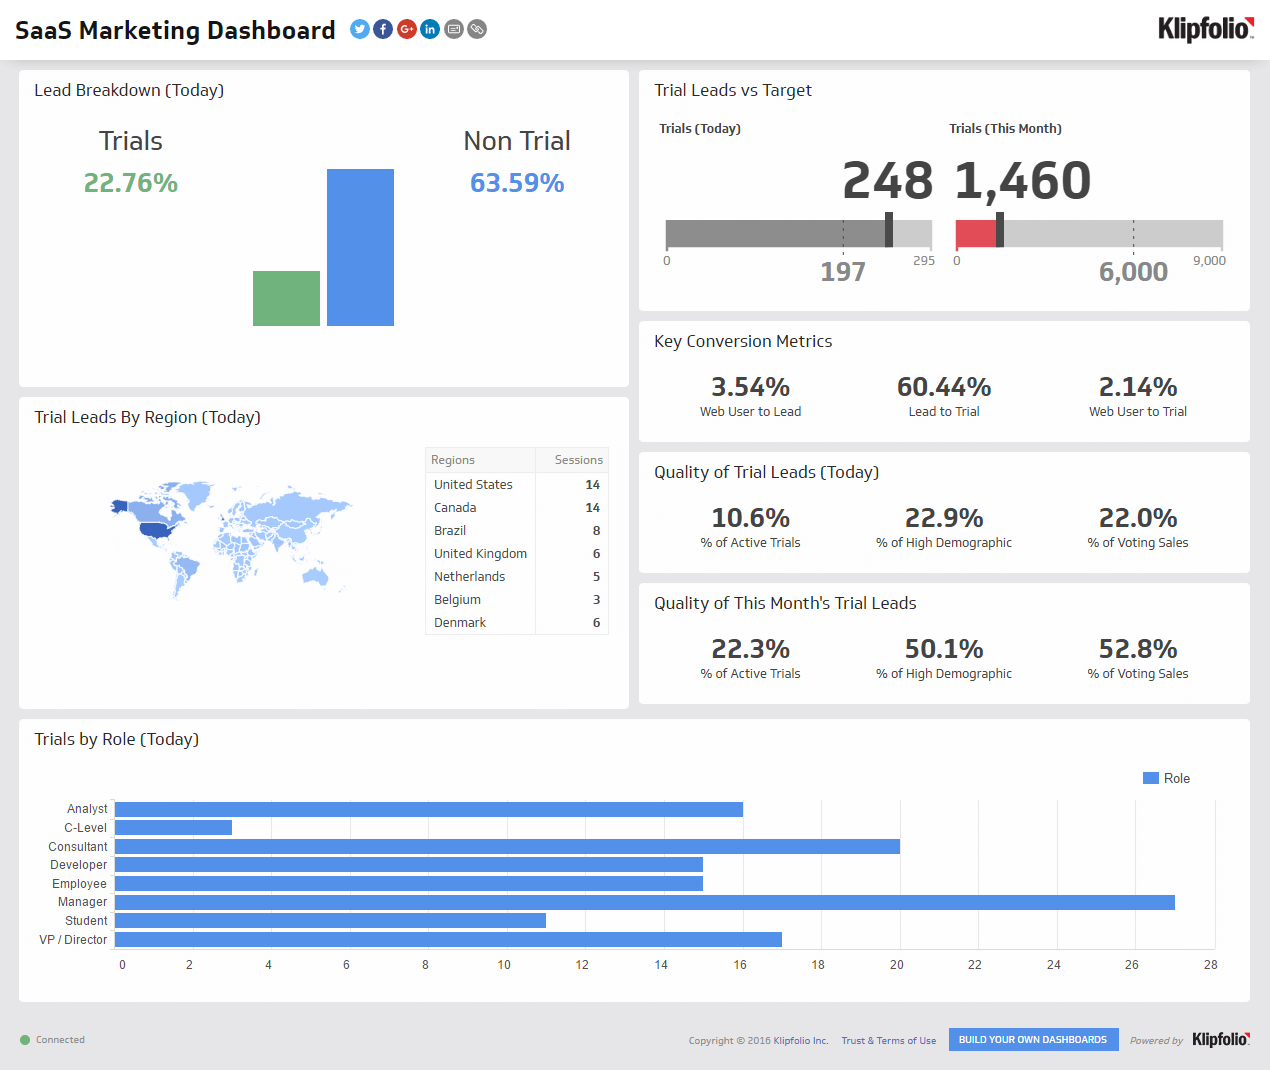
SaaS Marketing Dashboard
Your real-time command centre for marketing performance.
- SaaS
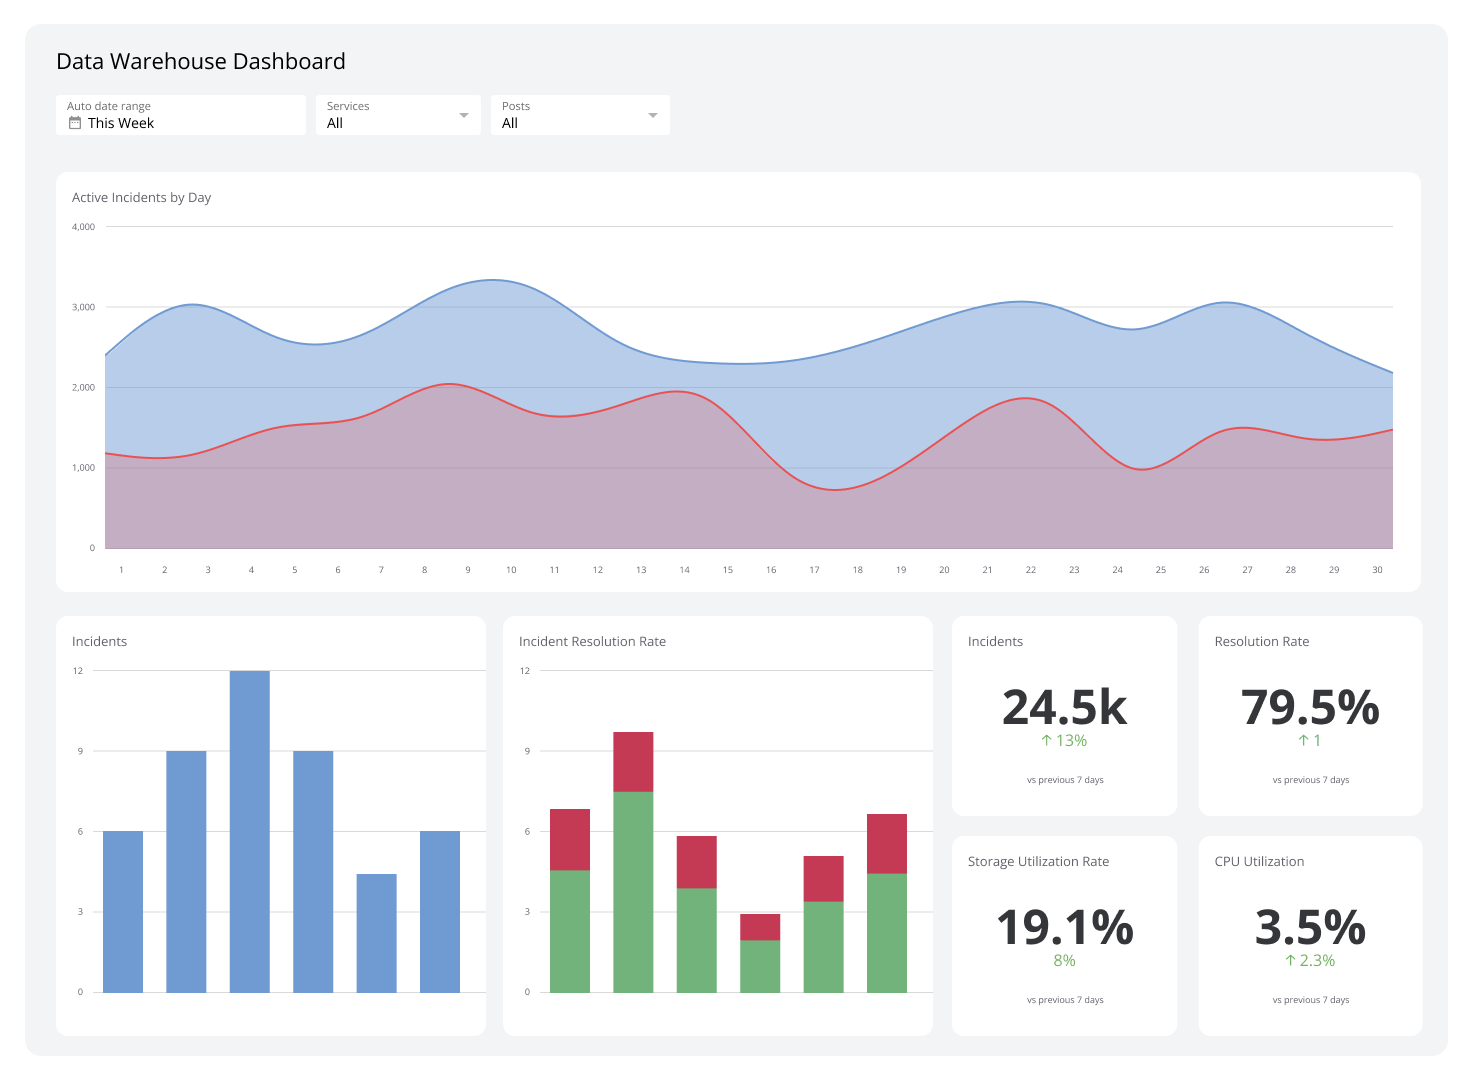
Data Warehouse Dashboard
Monitor performance, quality, and usage across your data warehouse.
Why SaaS leaders use dashboards
SaaS businesses move fast. Decisions on pricing, hiring, and retention cannot wait for someone to pull a report. You need to know where you stand without having to ask.
Successful SaaS companies share one trait: they are hyper-aware of their SaaS metrics and KPIs. Recurring revenue, lifetime value, acquisition cost, and net retention stay top of mind for founders and executives. A SaaS dashboard keeps those numbers current and consistent, so every leader is working from the same picture.
The alternative, pasting numbers into a spreadsheet, explaining your business context to an AI tool from scratch, or waiting for someone to pull a figure, costs time and introduces errors. A dashboard removes that friction.
How to use a SaaS dashboard
Different teams need different numbers. Your growth team watches MRR and new account volume. Your success team tracks retention and churn rate. Your finance lead monitors ARR and burn.
A well-structured SaaS dashboard gives each team the view it needs, without burying anyone in data they cannot use. Browse these dashboard examples to see how fast-growing SaaS businesses report on their performance.
Key components of a SaaS dashboard
An effective SaaS dashboard does three things well: it shows you the right metrics, keeps them current, and lets you configure what you see.
- Actionable metrics: The dashboard surfaces the numbers that drive decisions: user engagement, churn, Customer Acquisition Cost, and Lifetime Value. Not vanity stats.
- Real-time data updates: Metrics refresh automatically, so you are always working from current data, not last week's export.
- Customization: Every SaaS business has a different model. Your dashboard should reflect your metrics, your team structure, and your stage of growth.
What a SaaS dashboard actually gives you
A SaaS dashboard is not just a place to look at charts. It changes how your team operates.
- Faster decisions: When the numbers are in front of you, decisions happen faster and with more confidence. You are not waiting for someone to pull a report or reconcile two spreadsheets.
- Consistent data: Everyone sees the same numbers. No more conflicting figures between the deck your CFO built and the one your VP of Sales presented.
- Less time on reporting: Your team stops spending hours assembling data and starts spending that time on the work that moves the business forward.
- Earlier signals: Trends in churn, acquisition cost, or revenue growth show up before they become problems. You act on what is happening, not what already happened.
Choosing the right SaaS dashboard
The right dashboard fits your business, not the other way around. Look for something that connects to the tools you already use, refreshes data on a schedule that matches your pace, and lets you distribute the right view to the right person.
Scalability matters too. A dashboard that works for a 20-person team should still work when you have 100. And the numbers need to be trustworthy. Confidence in a metric is only as strong as confidence in where it comes from.
Create custom dashboards for you and your team.
Get started with Klips8 important SaaS metrics to include on your dashboard
The metrics below are the ones SaaS founders and executives track most closely. Start here, then add what is specific to your model.
- Monthly Recurring Revenue (MRR): The revenue generated from subscriptions each month. Your clearest signal of business health.
- Annual Recurring Revenue (ARR): The annualized version of MRR. Used for planning, forecasting, and investor conversations.
- Churn Rate: The percentage of customers who cancel during a given period. One of the most important numbers to watch.
- Customer Acquisition Cost (CAC): The average cost of winning a new customer, including marketing and sales spend.
- Lifetime Value (LTV): The estimated net revenue a customer generates over the full length of their relationship with you.
- LTV:CAC Ratio: The ratio of Lifetime Value to Customer Acquisition Cost. A healthy ratio tells you your acquisition model is working.
- Average Revenue per User (ARPU): Total revenue divided by number of customers. Useful for understanding pricing efficiency and expansion potential.
- Customer Retention Rate: The percentage of customers you keep over a given period. The flip side of churn, and equally important.