How we are using A-B testing to refine our pricing model – Part 2

Published 2023-03-21
Summary - Our A-B test on a new pricing model ran for just over two months. During that time, we compiled figures on five things: conversion rates; average subscription value; number of users per account; customer behaviour; and effect on revenue. The results were conclusive. Our proposed new model was better. The question then became: What do we do now? If we implemented it, how would
Last week, I talked about why we created an A-B test of our pricing model.
We launched the test at the end of November, sending 30% of trials and new customers to our existing user based model, and 70% to the new model. By the end of January, the numbers were in.
The results were pretty conclusive, and confirmed our hypothesis. Our 2012 pricing model was not optimized for our target market of small and medium-sized businesses and not aligned with our vision of owning that market. It limited them, and kept us from growing.
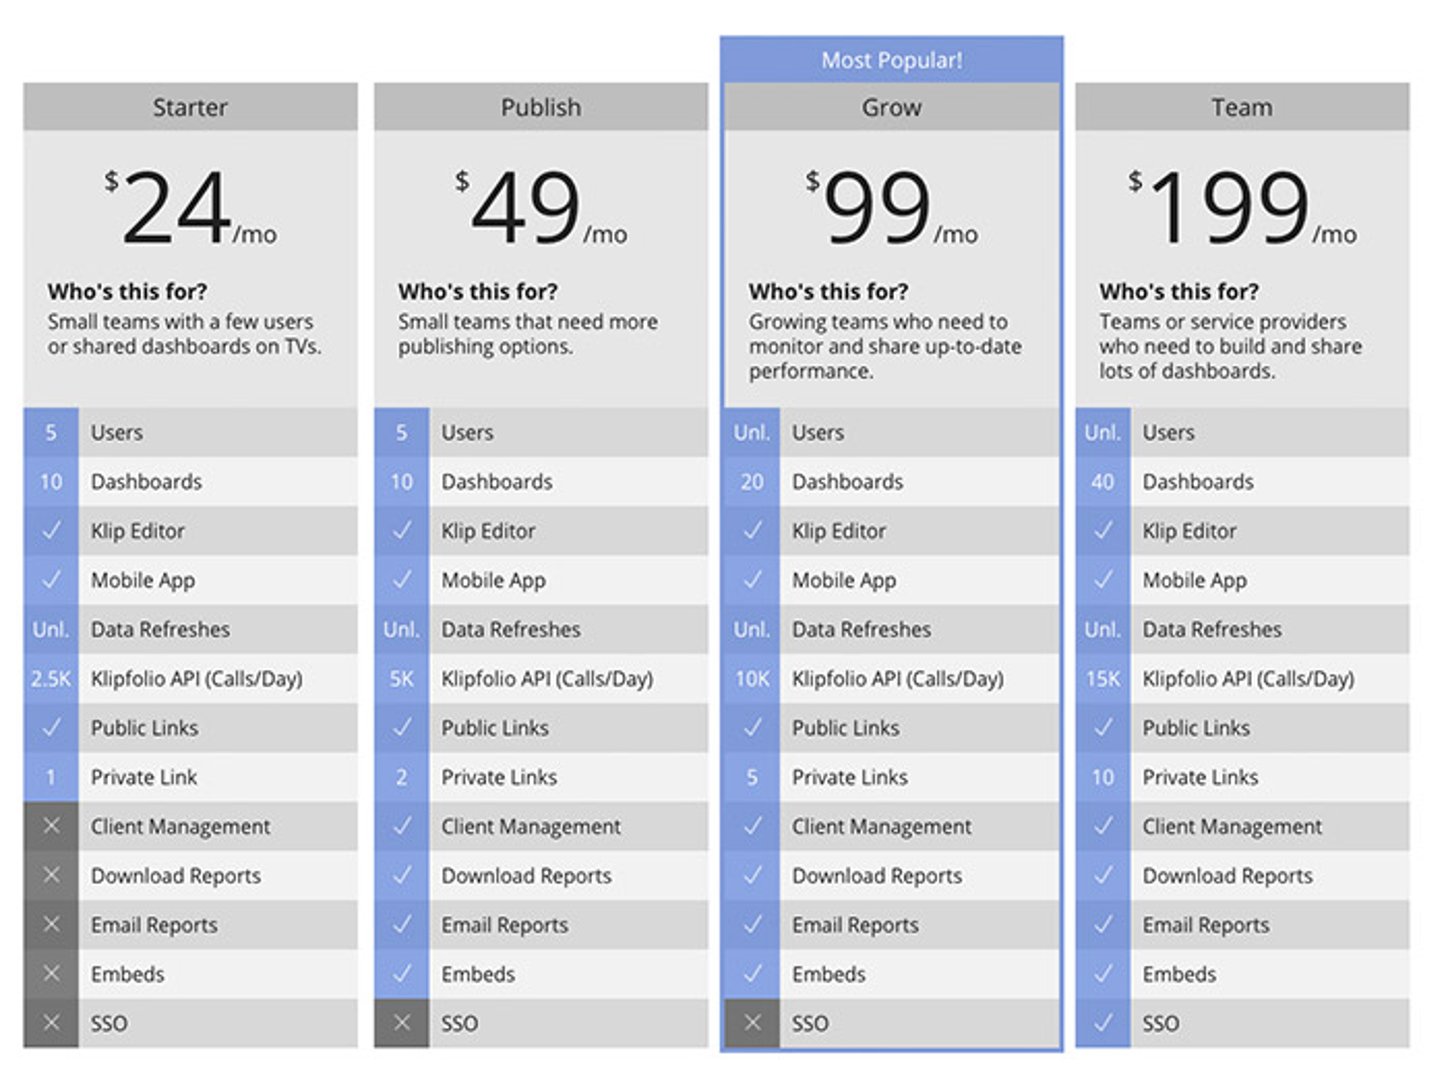
The screenshot below shows the model we were testing. We relaxed the user limit for the first two plans and removed it entirely for the larger plans. Under the new model, we are now pricing on the number of dashboards created, along with secondary feature and resource bundles.

We created the test to measure five things:
- The conversion rate (the number of prospects who converted into customers)
- The average subscription value of a new customer
- The number of users per account
- Customer behaviour (how many dashboards a customer created, for example)
- Any early expansion, contraction or churn.
Here’s what we found:
Conversion rates did not differ from one pricing model to the other – even though the base price of the new model was slightly higher than the old model. In other words, the new price and pricing model was not an impediment to gaining customers.
Average subscription value – how much were new customers paying on average – was probably the most important thing we needed to measure.
Under the old model, we measured it by counting the number of ‘seats’ sold per customer.
Under the new model we evaluated it according to which bundle of services a customer signed up for. Was it a starter bundle, a team bundle or a growth bundle?
The A-B test showed that average starting subscription value was significantly higher under the new model. For customers selecting between the new bundles, the value of what they bought tended to be higher than for customers deciding how many users they would start with.
The number of users per account also went up considerably under the new model. That was no surprise, since the old model limited the number of users. But this is an important strategic win for us - strong user growth is critical to our success.
We found that customer behaviour also changed. Customers channeled to the new model were building significantly more dashboards per account than those sent to the original one.
This was a very important indicator. For us, it showed that the customers were more engaged. But it also showed that the customers were creating greater value for themselves out of their Klipfolio accounts. Customers on the new model were getting more for their money.
Monitoring expansion, contraction and churn was the final piece of the puzzle. After the initial purchase, were customers upgrading their account? Was anybody cancelling?
This is one metric we couldn’t measure fully, because the test did not run long enough.
However, with the limited data we did have, we did get a strong sense of which way things were trending. Arrows for revenue expansion were pointing up quite nicely, and the number of cancellations was relatively unchanged.
So once we had the results, the question became: What now?
The obvious answer was that we should implement the new pricing model, asap.
But it’s not as simple as that.
We have about 4,500 customers of various sizes.
We were actually very concerned about what would happen if we switched all of our customers to the new pricing model. How would our existing customers react if their monthly bill suddenly went up – or down?
Either scenario was possible. A large existing customer with lots of users accessing only a small number of features might see its monthly bill drop significantly under the new pricing model, whereas a smaller firm with a tiny number of very active users but many resources could potentially see its bill go up.
Would our monthly recurring revenue slip because large customers were paying less, while smaller ones were cancelling? Could we convince customers that a small increase was worth it because they would be getting more for their money?
Months before we launched the test, we spent a lot of time looking at our existing customer population - really digging into how many users and dashboards there were, or what features they were using. This led to lots of number crunching and risk modelling - in other words, what was our exposure should all our customers move over to the new model at once?
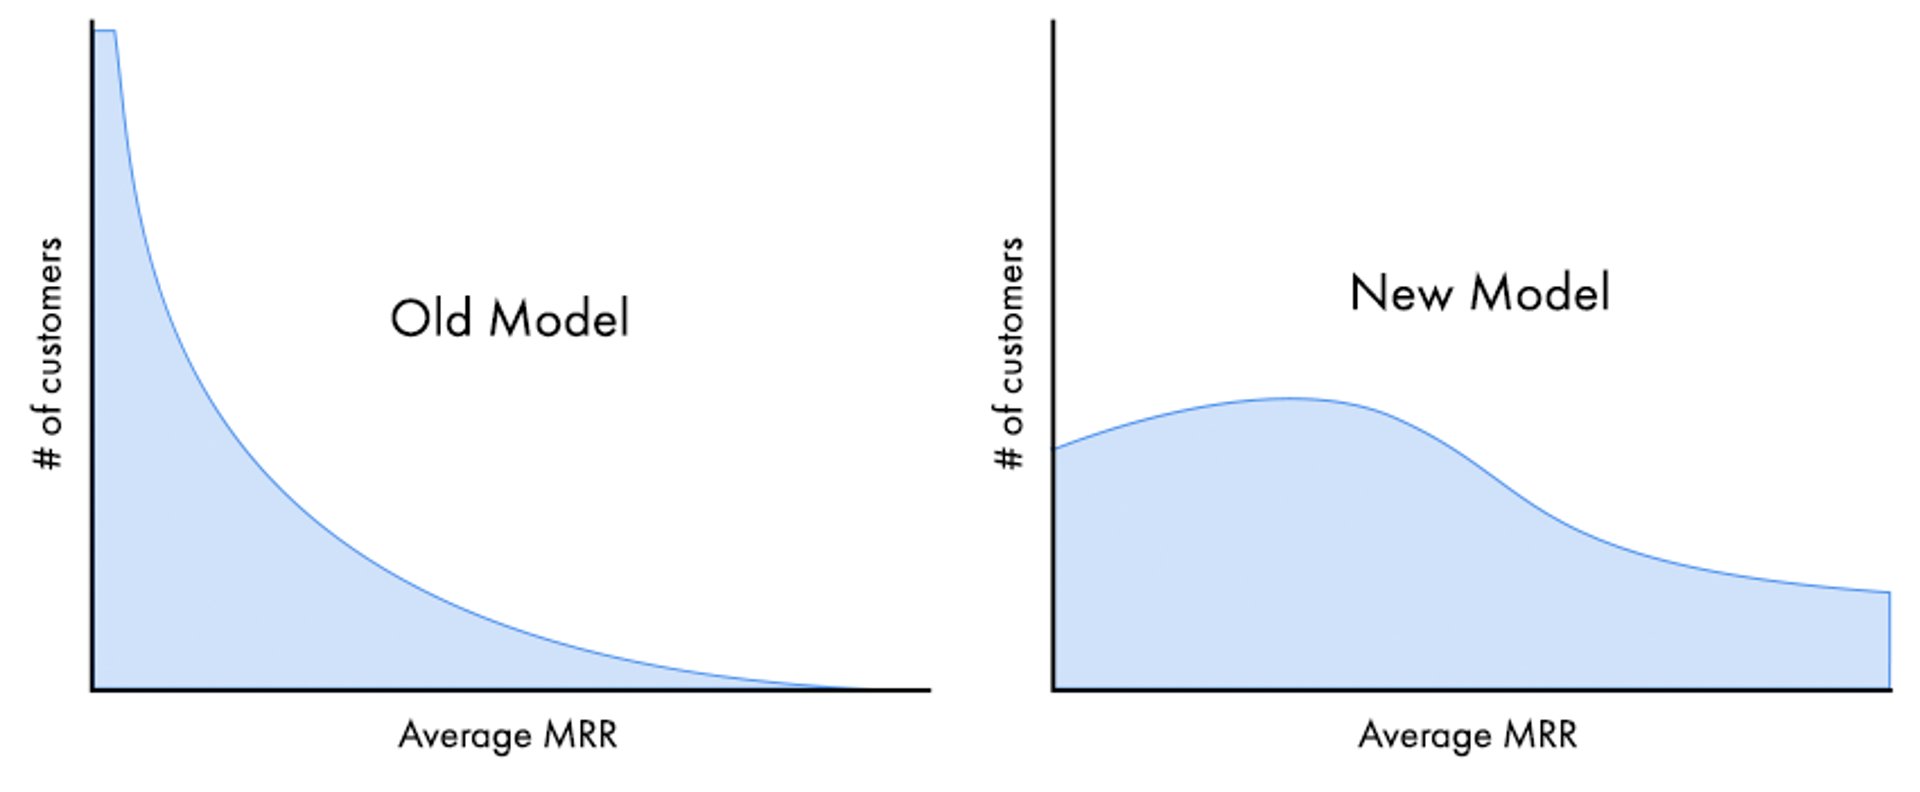
As expected, our current customer distribution, when plotted against average monthly recurring revenue, is an inverted curve. One of the design criteria for the new pricing model was to create a smoother distribution curve - and to limit risk.

So what have we done?
Most importantly, we have made the new pricing model the default path for all new trials.
Secondly, we have started introducing it to segments of our customer base. We’re excited about the results, but we want to take this step by step and make sure it’s done right. In the meantime, for customers who do want to switch, it’s as simple as letting us know.
A-B tests are part of our fabric. We’ll continue to use them to optimize our offerings and reduce the risk of making big changes. It’s good for our customers, and good for us.
Allan Wille is a Co-Founder and Chief Innovation Officer of Klipfolio. He’s also a designer, a cyclist, a father and a resolute optimist.
Related Articles

Why Are KPIs Important?
By Danielle Poleski — August 5th, 2025
Promoting Data Literacy with MetricHQ.org and the Power of AI
By Allan Wille, Co-Founder — March 20th, 2025
2025 BI and Analytics Trends for Small and Mid-Sized Businesses
By Allan Wille, Co-Founder — December 18th, 2024

