

Power BI vs Tableau
The main difference between Power BI and Tableau is that Power BI provides seamless integration with Microsoft products and offers a more cost-effective solution, making it ideal for organizations within the Microsoft ecosystem. In contrast, Tableau excels in advanced data visualization and analytical capabilities, catering to users who require sophisticated tools for in-depth data exploration and are willing to invest in a premium platform.
In the realm of Business Intelligence (BI), two powerhouses have emerged as the go-to solutions for organizations seeking to unlock the value hidden within their data: Power BI and Tableau. These leading BI platforms have garnered immense popularity and widespread adoption across industries, revolutionizing the way businesses analyze and visualize their data. As you embark on your quest to choose the right BI tool for your business, it's crucial to understand the unique features and capabilities that distinguish Power BI and Tableau. The decision you make today can have a profound impact on your organization's ability to harness data-driven insights and drive growth.
What is Microsoft Power BI?
Microsoft's Power BI has gained significant traction in recent years thanks to its seamless integration with other Microsoft products and its user-friendly interface. As part of the Microsoft ecosystem, Power BI offers seamless compatibility with popular tools like Excel and Azure, making it an attractive choice for organizations already leveraging Microsoft technologies. Its intuitive drag-and-drop interface and extensive pre-built data connector library enable users to create visually stunning reports and dashboards quickly.
Power BI's strength lies in its ability to handle large volumes of data and provide real-time insights, empowering businesses to make informed decisions on the fly.
What is Tableau?
Tableau, now owned by Salesforce, has established itself as a powerhouse in the realm of data visualization. Its visually appealing and interactive dashboards have captivated users across industries, enabling them to transform complex datasets into compelling stories. Tableau's strength lies in its robust data visualization capabilities, allowing users to explore data from multiple angles and effortlessly uncover hidden patterns and trends.
With a drag-and-drop interface and a rich palette of visualization options, Tableau empowers users to create dynamic and engaging reports that captivate stakeholders and facilitate data-driven discussions.
However, as Tableau becomes more closely aligned with Salesforce, questions arise about its status as a standalone product. Salesforce's CEO, Marc Benioff, has highlighted the benefits of integrating Tableau into the Salesforce CRM, showcasing how it facilitates data analysis. Rena Bhattacharyya, a service director at GlobalData, anticipates further integration between the two platforms, which could prove advantageous for Salesforce and Tableau users.
Power BI vs Tableau vs Klipfolio PowerMetrics
The importance of selecting the right BI tool for your business cannot be overstated. In today's competitive landscape, data has become the lifeblood of organizations, and the ability to extract meaningful insights from it is paramount. Both Power BI and Tableau offer powerful features and capabilities, but their suitability for your organization's unique needs may vary.
Visualizations and dashboards


Yes, automatically generated and customizable
Yes, automatically generated and customizable
34+
24
25+
400+
100+
400+
20+
Data connections
Data preparation
Data history and storage
Premium Only
Premium Only
Templates
400+
100+
400+
20+
Exploration
Yes (Azure)
Yes (Azure)
Yes (Azure)
Yes (Azure)
Yes (Azure)
Sharing and distribution
Client management & customization
Yes (Power Automate)
Yes (Embedded)
Embedded only
Can change logo
Embedded only
Privacy and security
Support and resources
API
Why Klipfolio
PowerMetrics is the best alternative to
Power BI & Tableau
At Klipfolio, we prioritize the needs and requirements of our clients above all else. Thanks to continuous upgrades, we improve our software every day to ensure that you're getting all the features you want without the added premiums.
Data governance and security
BI tools like Tableau and Power BI make it easy to make sure that data is protected, secure, and available. However, Klipfolio PowerMetrics goes the extra mile to provide enhanced data governance and security measures, giving organizations peace of mind when working with sensitive information.
Klipfolio PowerMetrics prioritizes data governance by offering granular access controls and user permissions. Data owners can define role-based access to ensure that only authorized individuals have access to specific data sets, metrics, and dashboards. This ensures that sensitive information remains restricted and that data is shared with the right people within the organization.
The platform also provides comprehensive audit logs, tracking user activity, data changes, and system events. These logs allow organizations to monitor data usage, identify any anomalies or unauthorized access attempts, and maintain a complete record of data activities. This audit trail supports compliance requirements and helps organizations maintain data integrity and accountability.
Klipfolio PowerMetrics further enhances data governance by facilitating data lineage and documentation. Data teams can document data sources, transformations, and calculations, creating a clear lineage of how metrics are derived. This documentation ensures transparency and traceability, making it easier to understand and validate the accuracy and reliability of metrics.
In terms of data security, Klipfolio PowerMetrics employs industry-standard encryption protocols to protect data both at rest and in transit. This includes encryption of data connections, ensuring that sensitive information is securely transmitted between data sources and the platform. Additionally, the platform adheres to best practices for data storage, employing robust encryption mechanisms to safeguard data at rest within its infrastructure.
A metric-centric approach to business intelligence
Klipfolio PowerMetrics takes a distinctive metric-centric approach to BI, allowing organizations to focus on the business metrics that truly matter. While Power BI and Tableau offer comprehensive BI functionalities, Klipfolio PowerMetrics emphasizes the importance of metrics and their impact on business performance. By shifting the focus to metrics, Klipfolio PowerMetrics helps organizations prioritize and align their efforts around crucial business indicators, driving actionable insights and better decision-making.
Metric-centric business intelligence takes a structured approach to metrics. It makes sure that each metric has a clear semantic meaning and is accompanied by a comprehensive description.
As such, it enables users to understand how the metric is calculated, the data it encompasses, and the time frame over which it is aggregated. Since it establishes a standardized framework for metrics, Klipfolio PowerMetrics allows organizations to prioritize and align their efforts around the crucial business indicators that drive success.
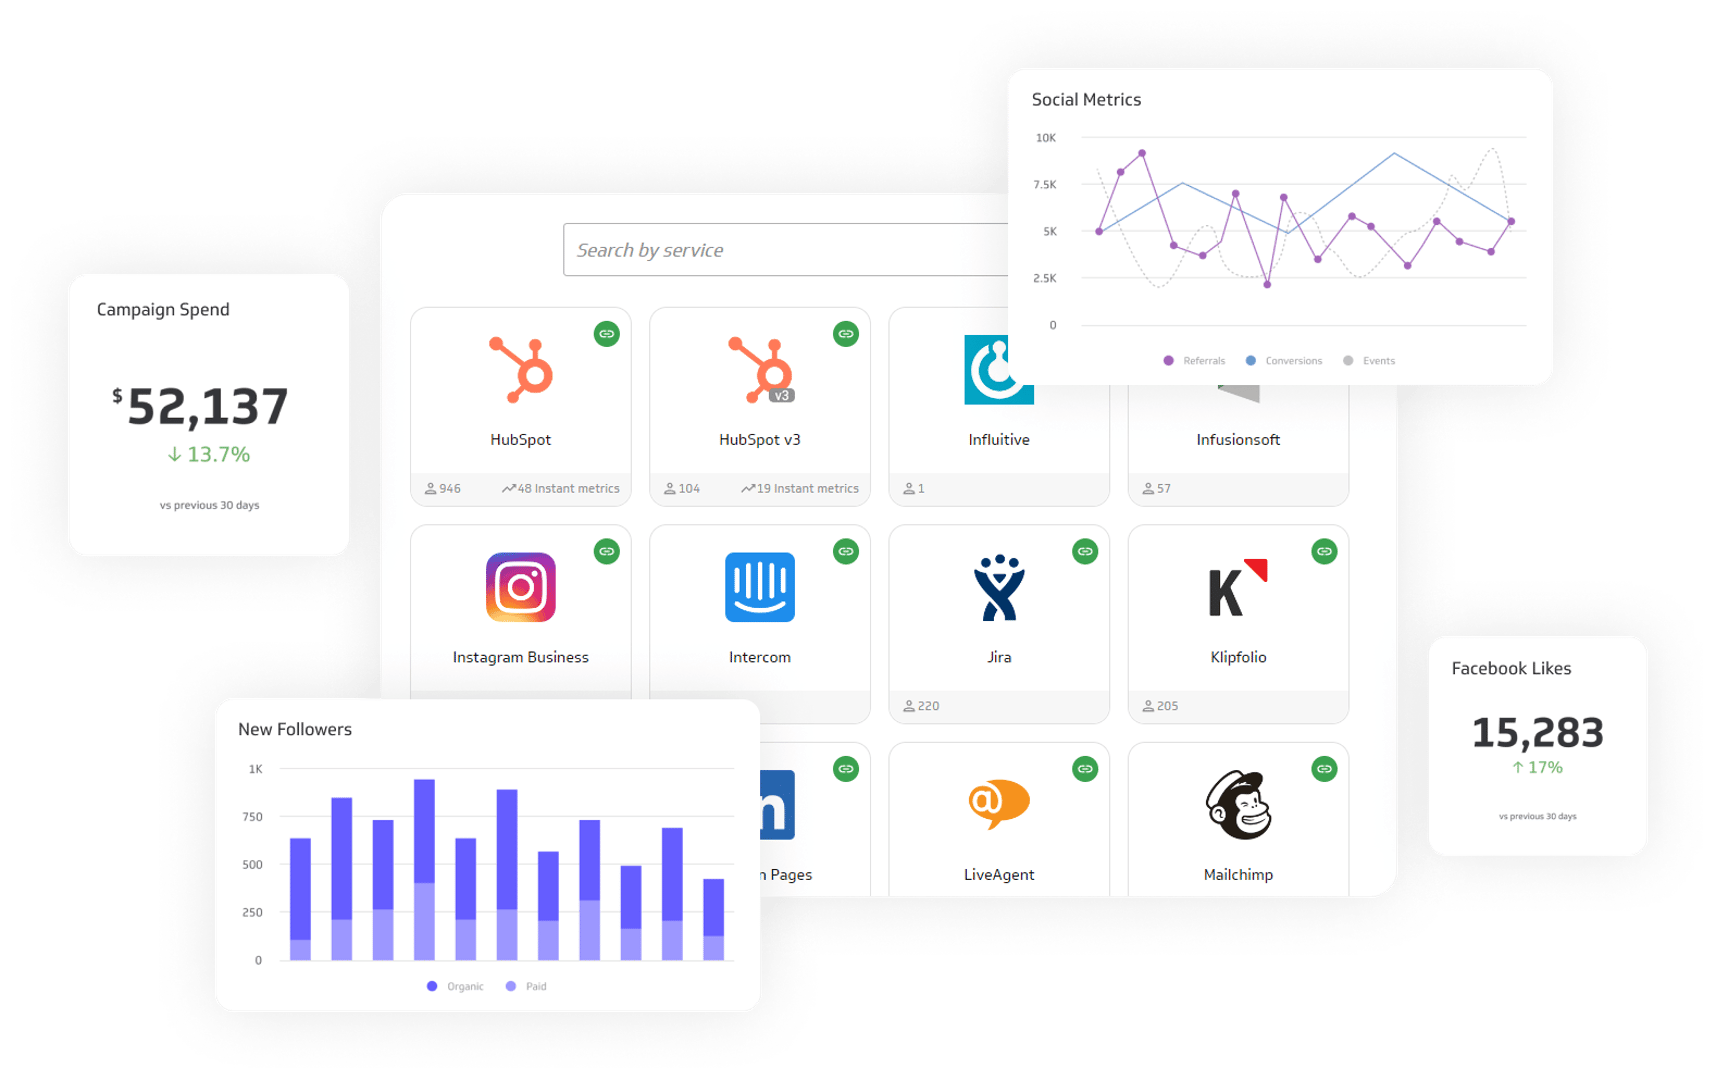
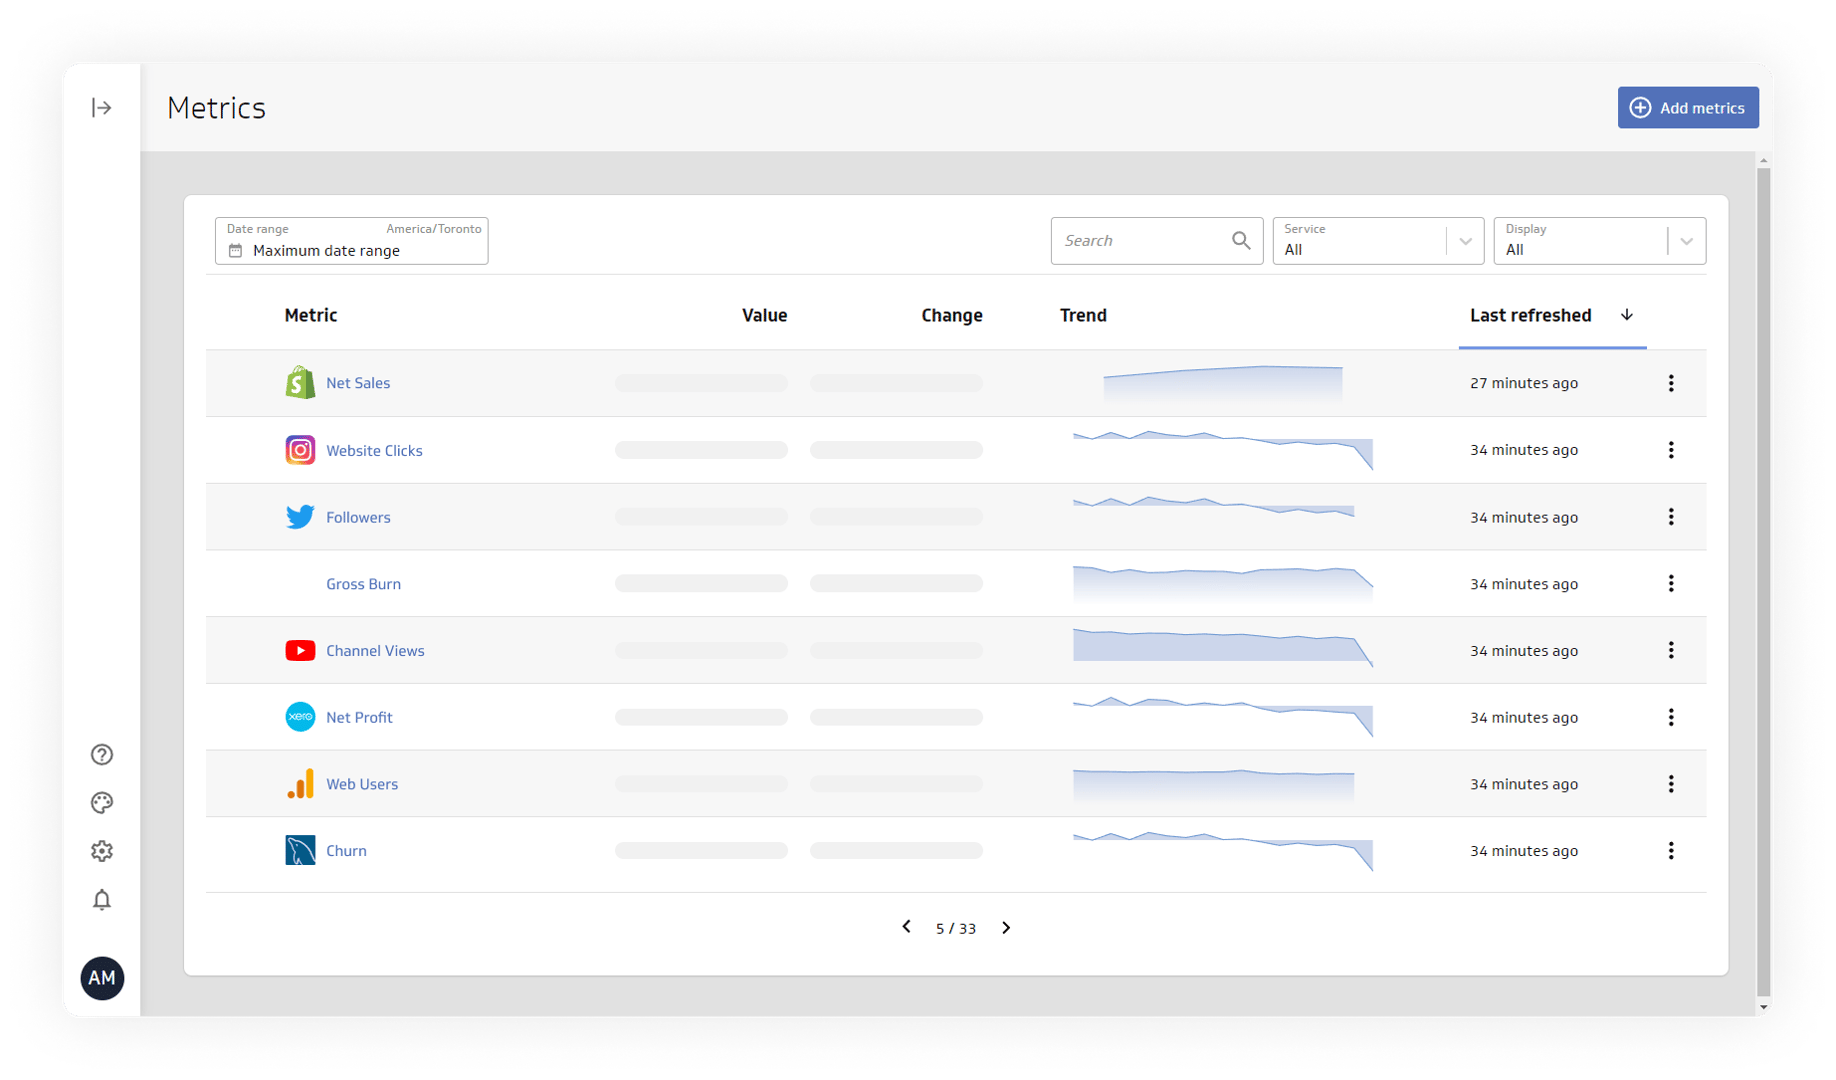
To facilitate metric adoption and utilization, Klipfolio PowerMetrics provides a user-friendly metrics catalog. This catalog acts as a centralized repository where users can easily access and self-serve the metrics they need.
With the ability to select and build their own dashboards and reports, users can effortlessly explore, visualize, and analyze the metrics that matter most to them. This empowers teams to gain deep insights into performance trends, make data-driven decisions, and take meaningful actions.
With the metric-centric approach of Klipfolio PowerMetrics, the visualization layer seamlessly integrates with any metric. Whether it's tracking revenue over time, applying filters and segmentation, or performing ad-hoc explorations, the visualization capabilities work consistently across all metrics. This ensures a cohesive and intuitive user experience, allowing stakeholders to derive valuable insights and communicate findings effectively.
Bringing data teams and business teams together
Power BI and Tableau are renowned for their data analysis and visualization capabilities. However, Klipfolio PowerMetrics takes collaboration a step further by bridging the gap between data teams and business teams. Data teams can handle data connectivity, preparation, and metric definition, while business teams gain the ability to choose from a catalog of trusted and verified metrics and leverage purpose-built visualizations. This seamless collaboration empowers both sides to work together towards common goals, fostering a data-driven culture throughout the organization.
The concept of a single source of truth
Power BI and Tableau excel in providing powerful data visualization tools, but Klipfolio PowerMetrics offers an additional advantage: a single source of truth for crucial business metrics. With Klipfolio PowerMetrics, organizations can create a centralized repository of key metrics that can be easily shared via a metrics catalog with teams and individuals for further analysis. This ensures that everyone is working with consistent and up-to-date metrics, eliminating discrepancies and aligning the organization's understanding of performance.
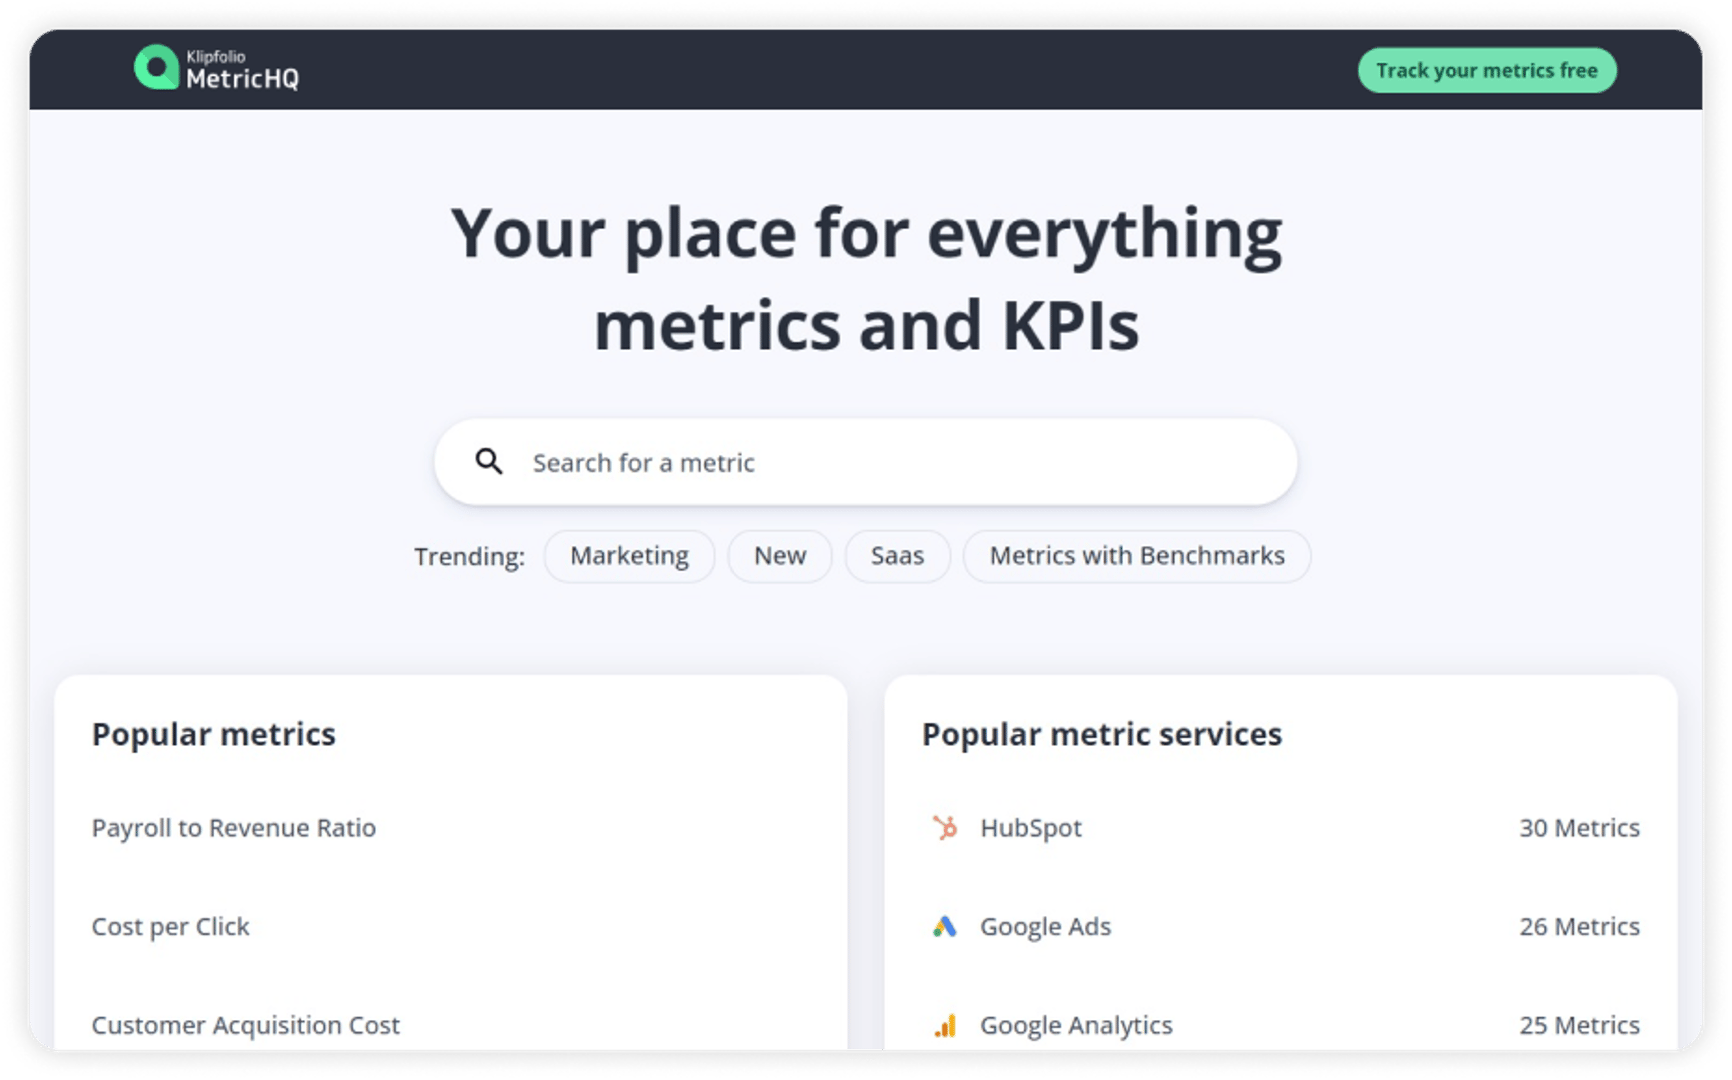
Integration with MetricHQ
Klipfolio PowerMetrics goes beyond the boundaries of a typical BI solution by integrating seamlessly with MetricHQ, a community-driven online dictionary for metrics and KPIs. This integration enables users to access a vast library of expert-contributed metrics definitions, empowering them to truly understand how their metrics are performing. By leveraging MetricHQ, organizations can tap into the community's collective knowledge and expand their understanding of metrics, driving more accurate and informed decision-making.
While Power BI and Tableau have established themselves as leading BI solutions, Klipfolio PowerMetrics offers a fresh perspective and valuable features that seamlessly integrate into the conversation. Its metric-centric approach, emphasis on collaboration between data teams and business teams, the concept of a single source of truth, and integration with MetricHQ make it a strong contender for organizations seeking a comprehensive BI solution.
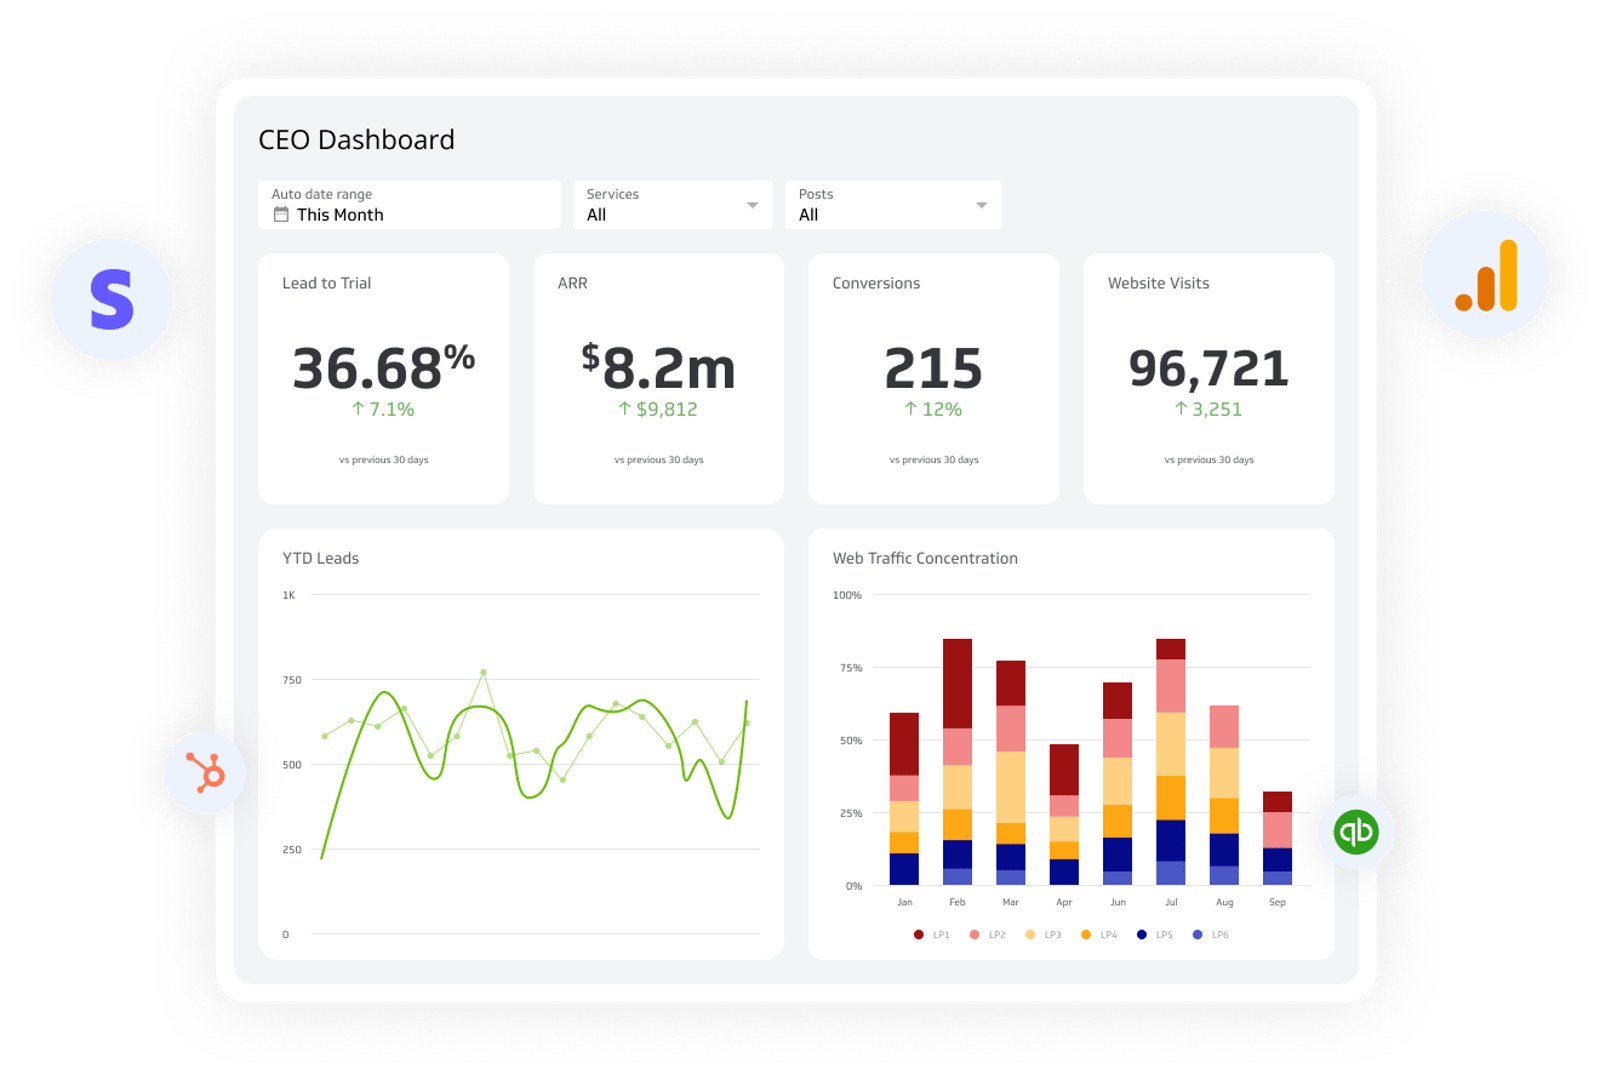
Code-free dashboard creation
Power BI and Tableau provide intuitive interfaces and drag-and-drop functionalities that allow users to design visually appealing and interactive dashboards. However, Klipfolio PowerMetrics takes code-free dashboard creation to the next level by offering a seamless and user-friendly experience that frees data teams and enables business users.
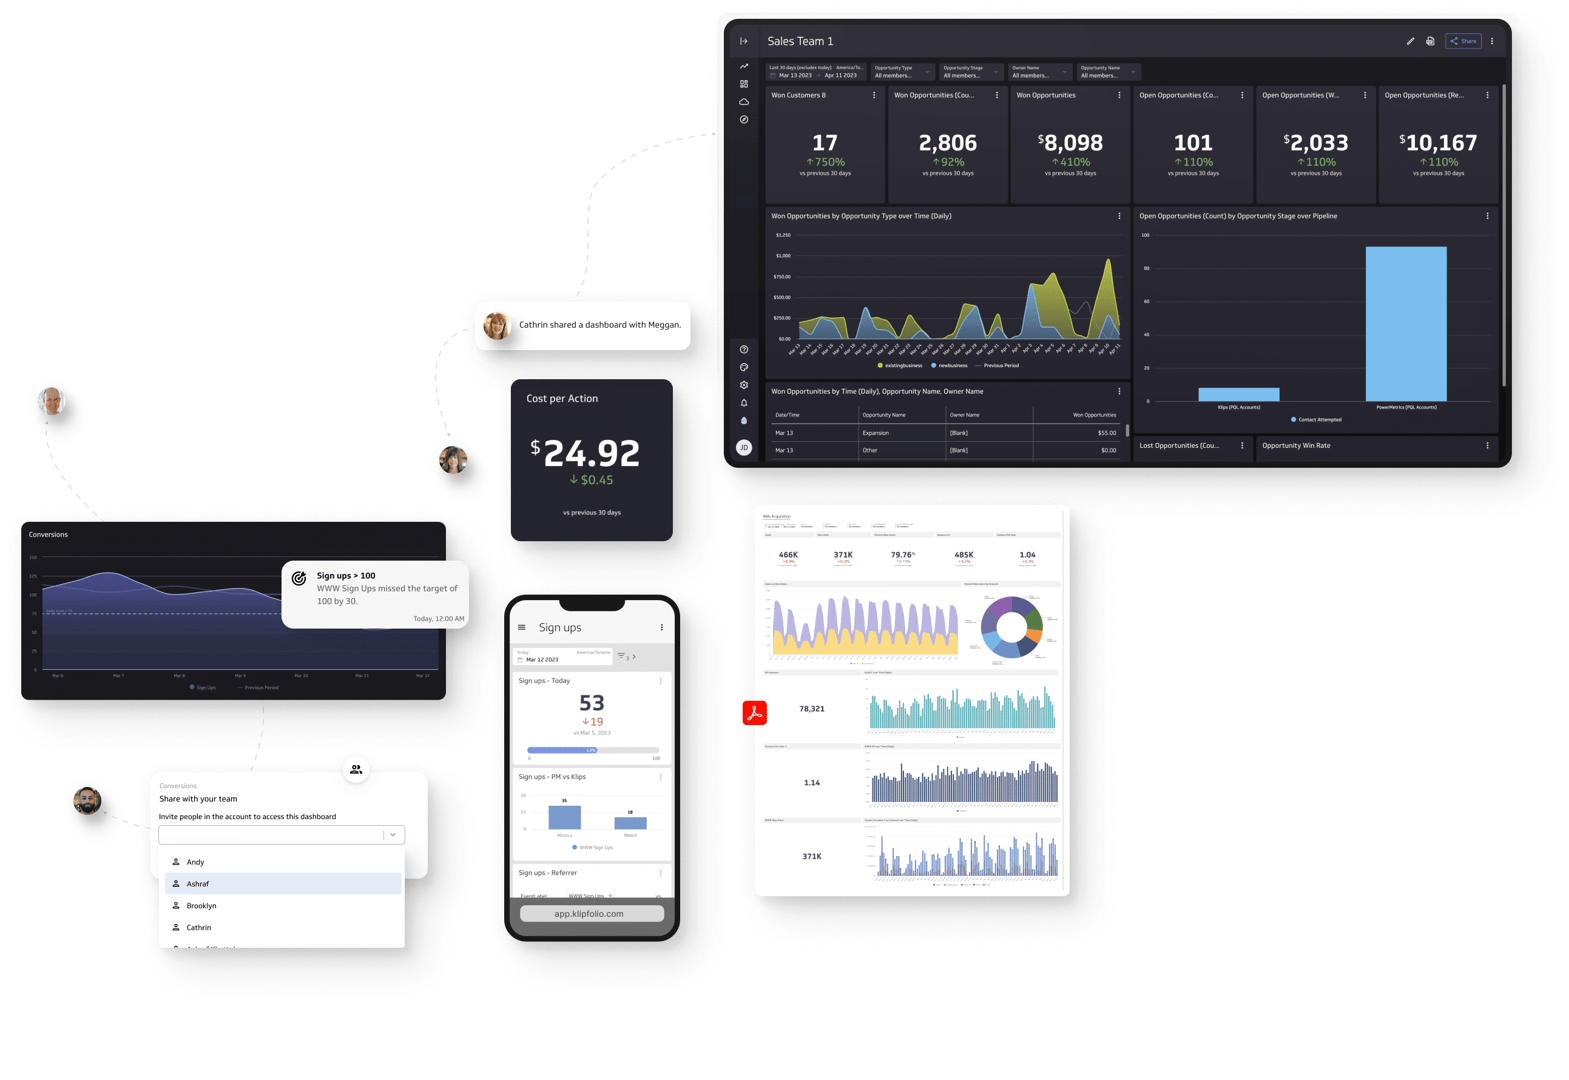
With Klipfolio PowerMetrics, users can effortlessly create stunning dashboards without the need for any coding or technical expertise. Users can add any metric onto the canvas, resize and rearrange them, and configure settings to suit their specific requirements.
Klipfolio PowerMetrics’ flexibility enables users to customize their dashboards according to their specific requirements. Users can resize, rearrange, and format the visual components to create a visually appealing and engaging dashboard. This level of control allows users to effectively communicate insights and highlight key metrics that drive business performance.
Beyond static visuals, Klipfolio PowerMetrics empowers users to explore their dashboards further. Users can change date ranges to analyze data over different time periods and apply filters to focus on specific segments or subsets of data. This interactive capability enhances the flexibility and depth of analysis, enabling users to dive deeper into the metrics and uncover valuable insights.
Meanwhile, Tableau users have raised concerns regarding the platform's feature decisions, which have been predominantly focused on integrations rather than addressing long-standing user feedback on improvements. This ongoing tension within the Tableau community highlights the evolving landscape and prompts users to evaluate alternative tools that better align with their needs.
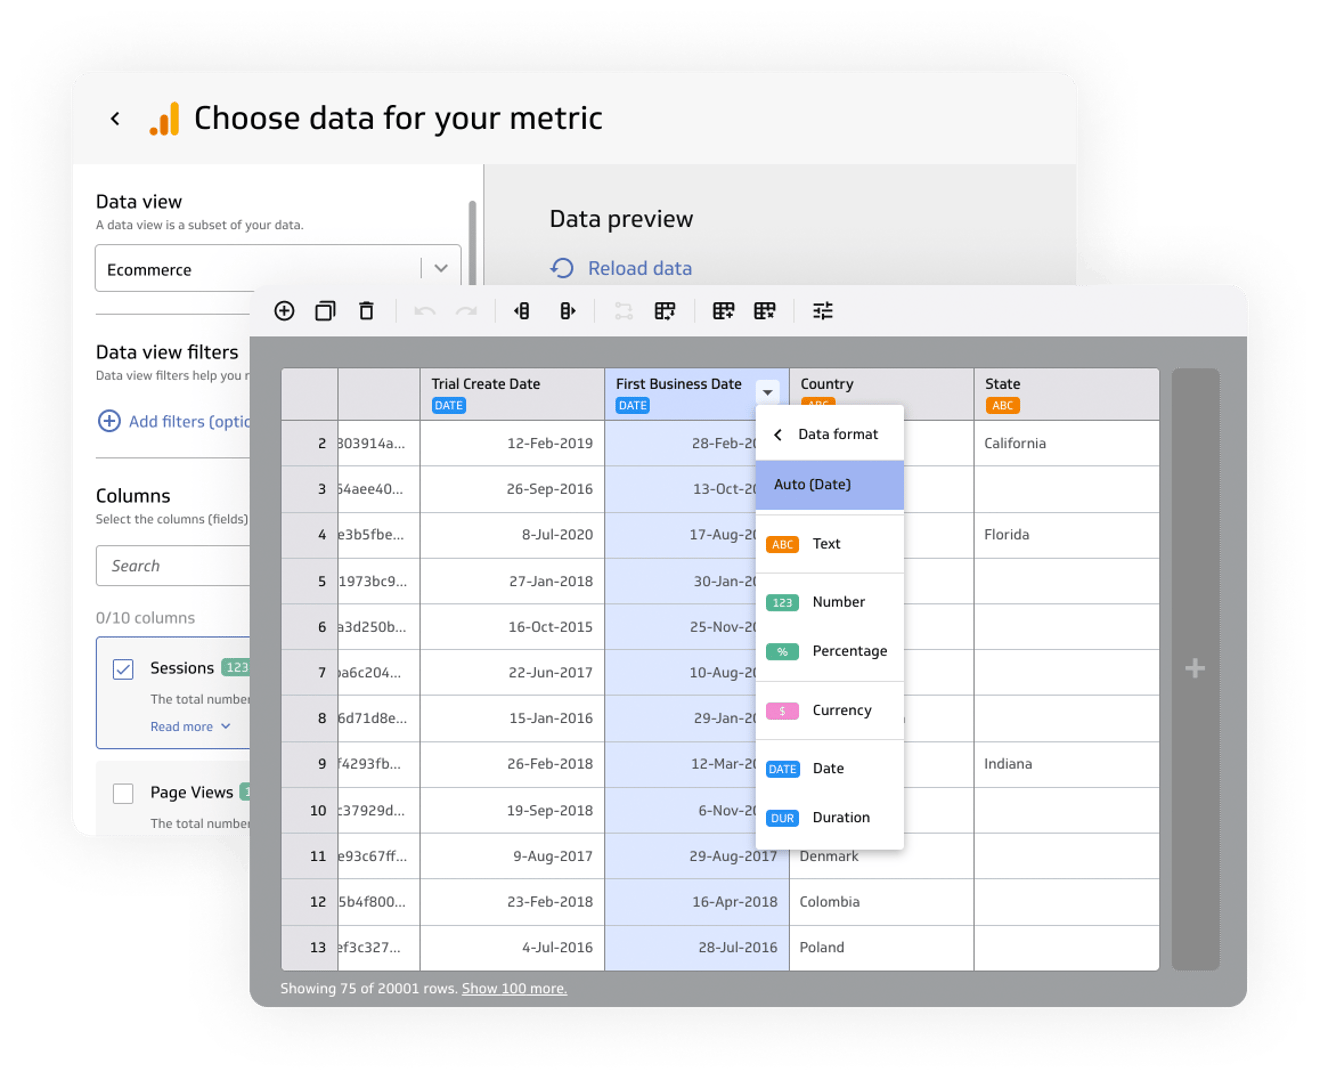
Data transformation and preparation
When comparing Power BI and Tableau's data transformation and preparation capabilities, it's evident that both platforms offer essential functionalities for cleaning, filtering, aggregating, and manipulating data. Tableau users have expressed concerns about the direction of the platform, with some expressing dissatisfaction over features focused primarily on integrations rather than addressing long-standing user suggestions for quality-of-life improvements.
This has prompted Tableau users to contemplate alternative tools or consider different BI solutions. While integration with Salesforce may offer benefits to clients in terms of data analysis within the Salesforce ecosystem, there is an ongoing discussion about finding the right balance between integration and preserving Tableau's unique offerings.
Klipfolio PowerMetrics takes these capabilities to the next level, providing users with a comprehensive suite of tools and functions to unlock the full potential of their data.
With Klipfolio PowerMetrics, users have access to a wide range of built-in Excel-like functions and operations that facilitate seamless data transformation and preparation. The platform offers a user-friendly interface and intuitive workflows, enabling data teams to efficiently filter, merge, and manipulate their data to create meaningful metrics and visualizations.

Klipfolio is trusted
across industries.
PowerMetrics has been helping teams just like yours organize, visualize, and share metrics since 2019. With extensive docs, an AI-powered help UI, friendly support staff, a free tier, and low pricing plans, now's the time to give us a try.
"We've grown by over 300% since using Klipfolio, and the decisions that led to this growth have come from data displayed on Klipfolio."
Marcus Taylor
Founder and CEO of Venture Harbour"Our leadership team is making smarter decisions and were on target to grow by 40 - 50% this year thanks to our insights from Klipfolio."
Brian Dainis
Founder and CEO of Curotec"I love the full range of capabilities that are possible when building a Klipfolio dashboard (specifically with their Klips product). Unlike the majority of BI platforms, building with Klipfolio feels more like designing a web page than configuring a single chart at a time. [...] Variables are straightforward and can be made independent of the data, which makes room for creative solutions to a wide variety of UI requirements."
Graham H
Principal Consultant for SMBs"Klipfolio is data analytics software that is best suited for businesses of all sizes that are looking to get instant insights from their data"
Power BI vs Tableau vs Klipfolio Pricing
$10/u/m (Pro), $20/u/m (Premium), $4995/per capacity/month
$70/u/m (Creator), $42/u/m (Explorer), $15/u/m (Viewer), $250/m (Resource Block)
Starts at $56/m (billed annually)
When considering the pricing of these BI tools, it's crucial to evaluate not only the cost but also the value proposition they offer. Power BI provides a comprehensive set of features and robust integration capabilities, making it a popular choice for organizations seeking scalable solution. Tableau, on the other hand, excels in data visualization and provides a user-friendly interface for exploring and analyzing data. Klipfolio PowerMetrics offers a metric-centric approach, combining data teams and business teams on a single platform, and its pricing structure provides flexibility for organizations of all sizes.
Klipfolio PowerMetrics takes a different approach to pricing, offering both freemium and paid options. The freemium version allows users to get started with essential features at no cost. For users requiring more advanced functionality, Klipfolio PowerMetrics offers paid pricing plans starting from $56 per month and easily scales to organizations with more extensive requirements. These paid plans provide additional features and benefits, such as increased data source connections, priority support, and custom branding options.
Still uncertain about what product to choose? Read our other comparisons: Looker vs Tableau, Power BI vs Qlik Sense, and Domo vs Tableau.
Frequently Asked Questions
Klipfolio PowerMetrics stands out with its metric-centric approach to BI–metric definition, metrics catalog, and purpose-built metric visualizations–bringing data teams and business teams together on one platform.
Klipfolio PowerMetrics enables data teams and business teams to collaborate seamlessly, with data teams ensuring the integrity of the data and the creation of metric definitions, while business teams can choose metrics via the metrics catalog and create visualizations without the need for coding.
Klipfolio PowerMetrics acts as a library of centrally-defined key metrics, providing a consistent and reliable source of important business metrics that can be easily shared with teams and individuals.
The integration with MetricHQ enhances the capabilities of Klipfolio PowerMetrics by providing a community-driven online dictionary for metrics and KPIs. Users can learn about metrics and their definitions and easily build these metrics with a few clicks.
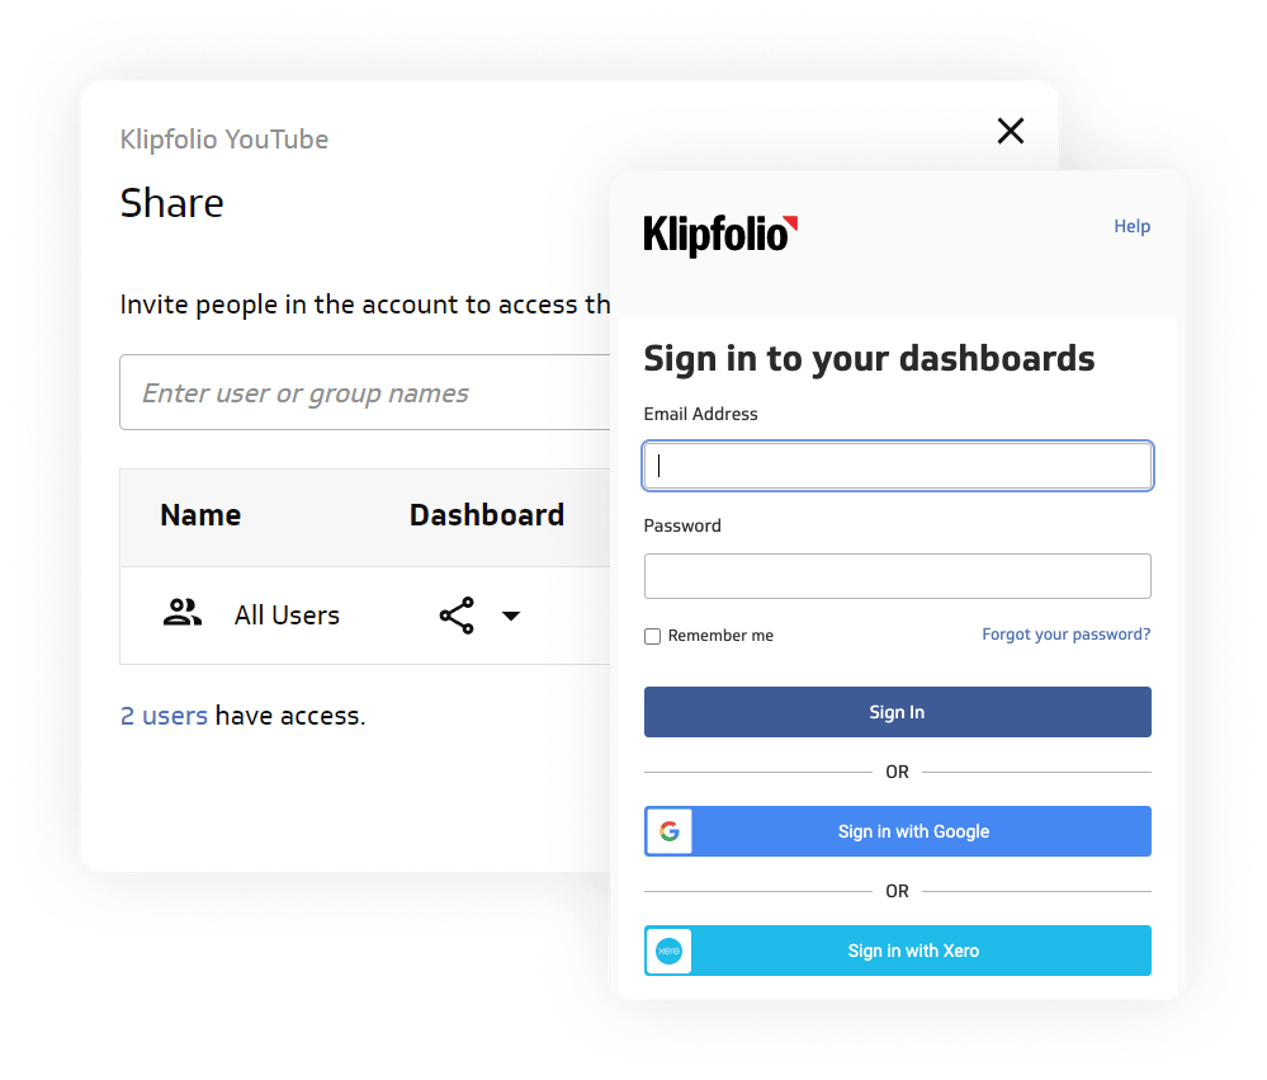
Yes, one of the actionable features of Klipfolio PowerMetrics is the ability to share real-time data with the people that matter, enabling organizations to make data-driven decisions faster.
Yes, Klipfolio PowerMetrics offers a freemium version that allows users to access essential features at no cost, making it a great option for those starting with BI.
Klipfolio PowerMetrics offers paid pricing plans ranging from $90 to $800 per month, providing additional features and benefits such as increased data source connections and priority support
Klipfolio PowerMetrics is designed to scale with the needs of businesses, accommodating both small and large organizations as they expand their data and reporting requirements.
Klipfolio PowerMetrics provides support through various channels, including online documentation, knowledge bases, and responsive customer support, to assist users in maximizing their experience with the tool.
Yes, Klipfolio PowerMetrics offers custom branding options for organizations, allowing them to align the tool's visual appearance with their brand identity.
