

Power BI vs Qlik Sense
The main difference between Power BI and Qlik Sense is that Power BI offers advanced data modeling capabilities and seamless integration with Microsoft products, making it ideal for users with complex data needs within a Microsoft ecosystem. In contrast, Qlik Sense provides a user-friendly interface and a powerful associative engine for intuitive data exploration, catering to business users without a strong technical background.
Data visualization and analytics tools are key to identifying relationships and patterns in your organization’s data, monitoring your campaigns’ performance, and facilitating collaboration within teams. Most importantly, they are used to share findings and grant everyone a common understanding of the data, allowing you to create informed decisions that drive results.
Difference Between Qlik Sense and Power BI
Power BI, developed by Microsoft, is ideal for users who need seamless integration with Microsoft products and advanced data modeling capabilities. It's perfect for those with complex data needs and existing Microsoft ecosystems. On the other hand, Qlik Sense stands out for its user-friendliness and powerful associative engine, which enables easy exploration of data relationships. Qlik Sense is best suited for business users who prioritize intuitive data exploration without needing a strong technical background.
Visualizations and Dashboards


Yes, automatically generated and customizable
34+
17
25+
400+
Exploration
Microsoft Azure
Microsoft Azure
Microsoft Azure
Microsoft Azure
Microsoft Azure
Data Connections
Data Preparation
Data History and Storage
Premium only
Premium only
Sharing and Distribution
Limited
Privacy and Security
Support and Resources
API
Why Klipfolio
PowerMetrics is the best alternative to
Power BI & Qlik Sense
At Klipfolio, we prioritize the needs and requirements of our clients above all else. Thanks to continuous upgrades, we improve our software every day to ensure that you're getting all the features you want without the added premiums.
Import all your data onto one platform
As a Microsoft product, Power BI is big on utilizing the cloud to its fullest potential. It lets you have nearly unlimited storage, flexibility, and integration with other Microsoft services. However, everything runs on Azure. For organizations looking to keep their data private, Power BI does pose some concerns.
Qlik Sense offers up to 240 GB of storage on their Enterprise SaaS solution and an additional two 240 GB memory pods on the cloud. It’s safer but costly to scale. If you already have existing data sources, Klipfolio PowerMetrics simply lets you connect all of them to its platform. It’ll retrieve and store data as soon as it drops too, allowing for real-time updates.
Collaborate across teams more effectively
Both Power BI and Qlik Sense provide various collaboration features to facilitate teamwork and sharing of dashboards and reports. For example, both allow users to work together on dashboards, reports, tiles, and apps. It’s just that Power BI only offers integration with other Microsoft tools, like Teams, while Qlik Sense is more open with its apps. Plus, Qlik Sense allows its users to capture snapshots of specific data, add personal notes, and tag their colleagues to open up discussions.
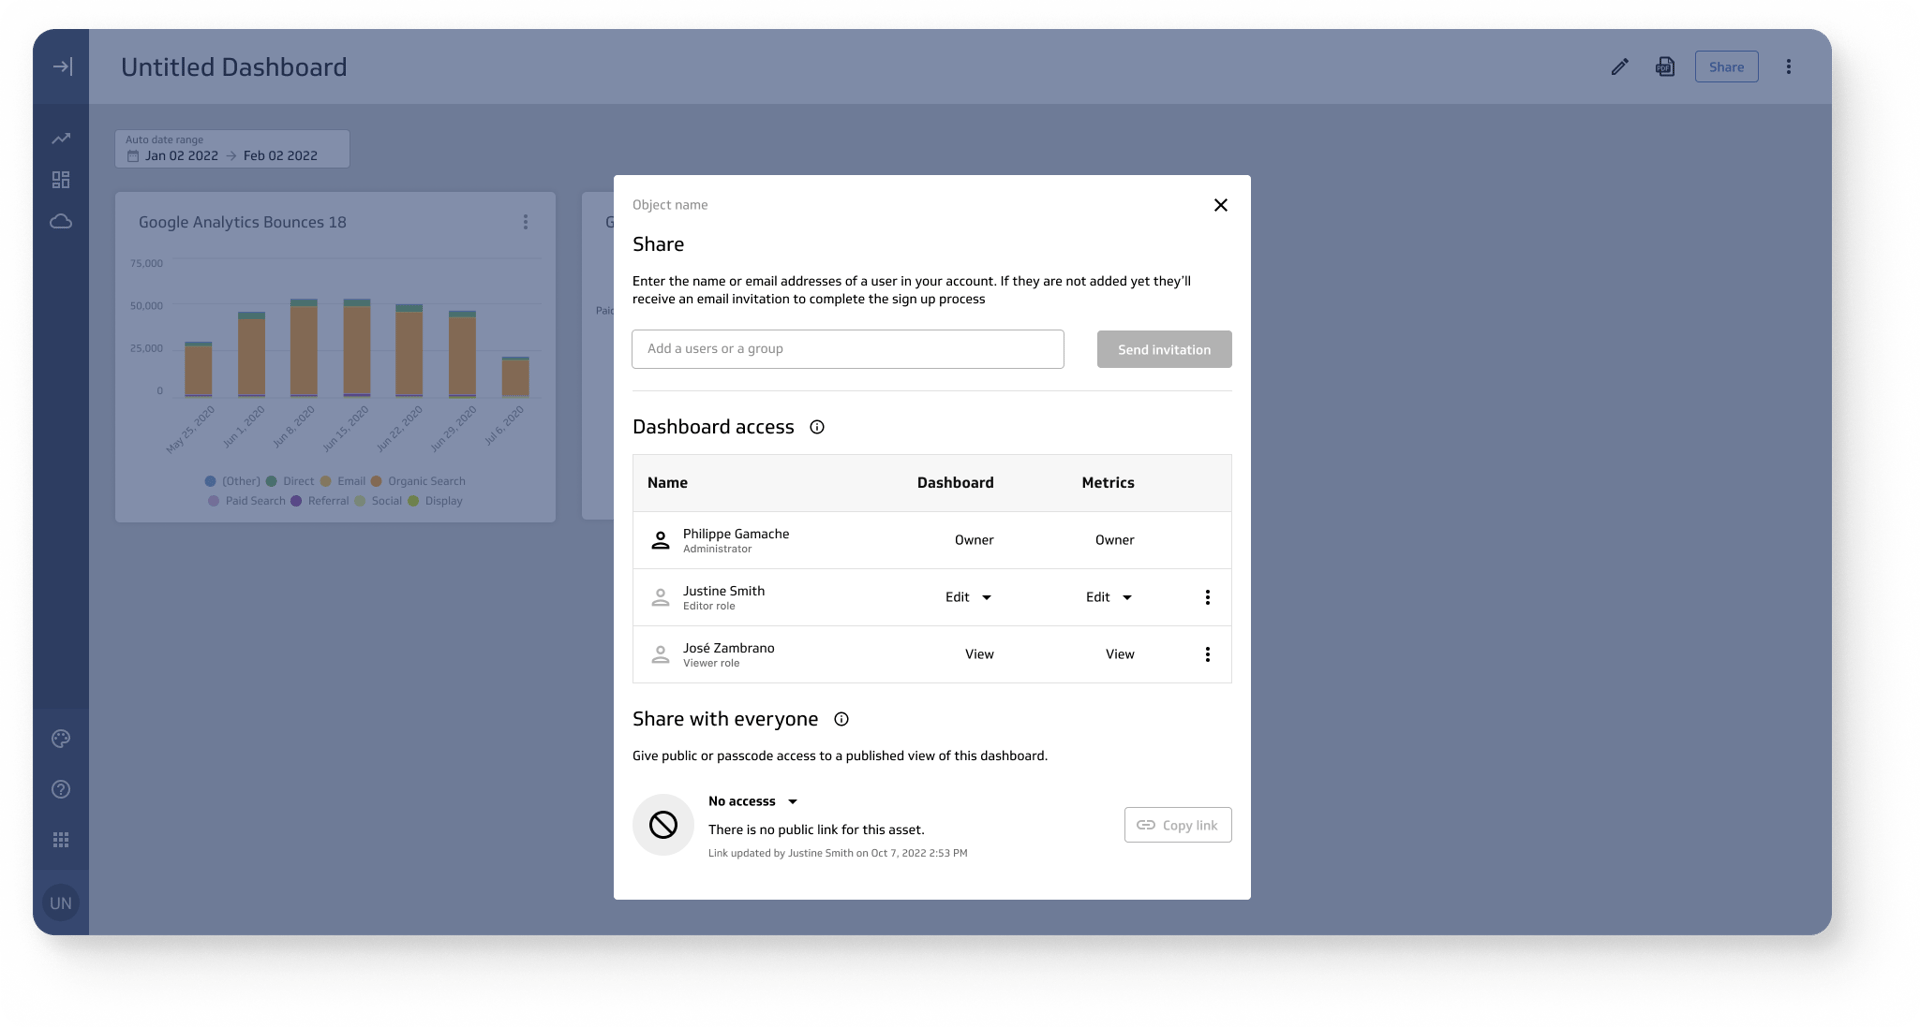
Klipfolio borrows a bit of both in this regard, allowing its users to share their dashboards with individuals, teams, or departments by creating groups, assigning roles, and granting tailored access rights. You can even share specific settings with other collaborators, allowing them to build the metric with you.
Flexible access controls
Data security is a priority for any business, and software providers take this part very seriously. For example, with robust data encryption, RBAC, MFA, and integration with Azure AD, Power BI admins have granular control over user permissions, activity monitoring, and data loss prevention. Meanwhile, Qlik Sense has default security rules that cover common scenarios, such as granting full access to administrators and restricting access to specific data or apps for certain users or groups.
Klipfolio ensures something similar to both through private connections, user access controls, and data encryption.

Over 400 pre-built visualizations
Power BI is known for empowering people to create compelling visual representations using custom visualizations and other interactive features. On the other hand, Qlik Sense prioritizes functionality, offering features like comparison periods, guided analytics, and more.
While it may not boast the same range of visualization types as Power BI, Klipfolio PowerMetrics more than makes up for it with its over 400 pre-built visualizations. It will also automatically generate and suggest visualizations for the metrics you build, which can be edited and customized.
Additionally, PowerMetrics conveniently generates an overview of a metric's performance through up to 7 visualizations displayed on a dedicated metric homepage. This clear, curated overview of a metric is designed to get a first orientation, providing the value, definition, previous period, segmentations and multiple chart types. You can use dynamically assigned values, much like Qlik Sense. The UI is straightforward, and everything is easy to access, making it the best of both worlds.
Easy to use interface
For all its use, Qlik Sense is often referred to as an “advanced Excel sheet” because it can look and feel that way at first. In fact, we find that many Qlik Sense users need training to get used to the layout. Most even prefer Power BI because of its user-friendliness—more specifically its drag-and-drop features and self-service capabilities.
Much like Power BI, Klipfolio PowerMetrics users enjoy a great user interface and custom dashboards. Even those with limited technical knowledge can quickly get boarded and utilize the platform effectively. It also has the extra advantage of having 400+ pre-built visualizations, making it easier than ever to start.

Klipfolio is trusted
across industries.
PowerMetrics has been helping teams just like yours organize, visualize, and share metrics since 2019. With extensive docs, an AI-powered help UI, friendly support staff, a free tier, and low pricing plans, now's the time to give us a try.
"We've grown by over 300% since using Klipfolio, and the decisions that led to this growth have come from data displayed on Klipfolio."
Marcus Taylor
Founder and CEO of Venture Harbour"Our leadership team is making smarter decisions and were on target to grow by 40 - 50% this year thanks to our insights from Klipfolio."
Brian Dainis
Founder and CEO of Curotec"I love the full range of capabilities that are possible when building a Klipfolio dashboard (specifically with their Klips product). Unlike the majority of BI platforms, building with Klipfolio feels more like designing a web page than configuring a single chart at a time. [...] Variables are straightforward and can be made independent of the data, which makes room for creative solutions to a wide variety of UI requirements."
Graham H
Principal Consultant for SMBs"Klipfolio is data analytics software that is best suited for businesses of all sizes that are looking to get instant insights from their data"
Power BI vs Qlik Sense vs Klipfolio Pricing
$10 per user (Pro), $20 per user (Premium), $4,995 per capacity
Starts at $30 per user
Starts at $56/month (billed annually) for two users
Between Power BI and Qlik Sense, the former is more affordable at around $10 per user every month. Qlik Sense lets you add new users for $30, but it does offer an Enterprise solution that lets you negotiate a quoted price. Power BI also locks much of its data history functions behind a Premium—a thing Qlik Sense and other data visualization tools don’t do.
Compared to the two, however, Klipfolio PowerMetrics is even more affordable. Their starting package costs $56 per month (billed annually) and includes unlimited metrics and dashboards. The pricing can go up depending on the features and number of users that will need access to it.
For more comparisons of Power BI or Qlik Sense, check out our Power BI vs Tableau, Power BI vs Klipfolio and Klipfolio vs Qlik Sense comparisons.
Frequently Asked Questions
Klipfolio PowerMetrics offers comprehensive documentation, tutorials, and customer support resources to assist new users in quickly getting up to speed. These resources are designed to empower users to quickly grasp the platform's capabilities and minimize the learning curve associated with adopting a new tool. But more importantly: it has all the data visualization tools you need in an easy-to-read UI.
Additionally, if you have a good understanding of Excel, you will quickly find your way around Klipfolio. The platform builds upon the concepts and functionalities commonly used in the software.
PowerMetrics' metric-centric approach makes it easy to explore and analyze data, so you can spend more time understanding how your business is performing instead of trying to make sense out of the numbers.
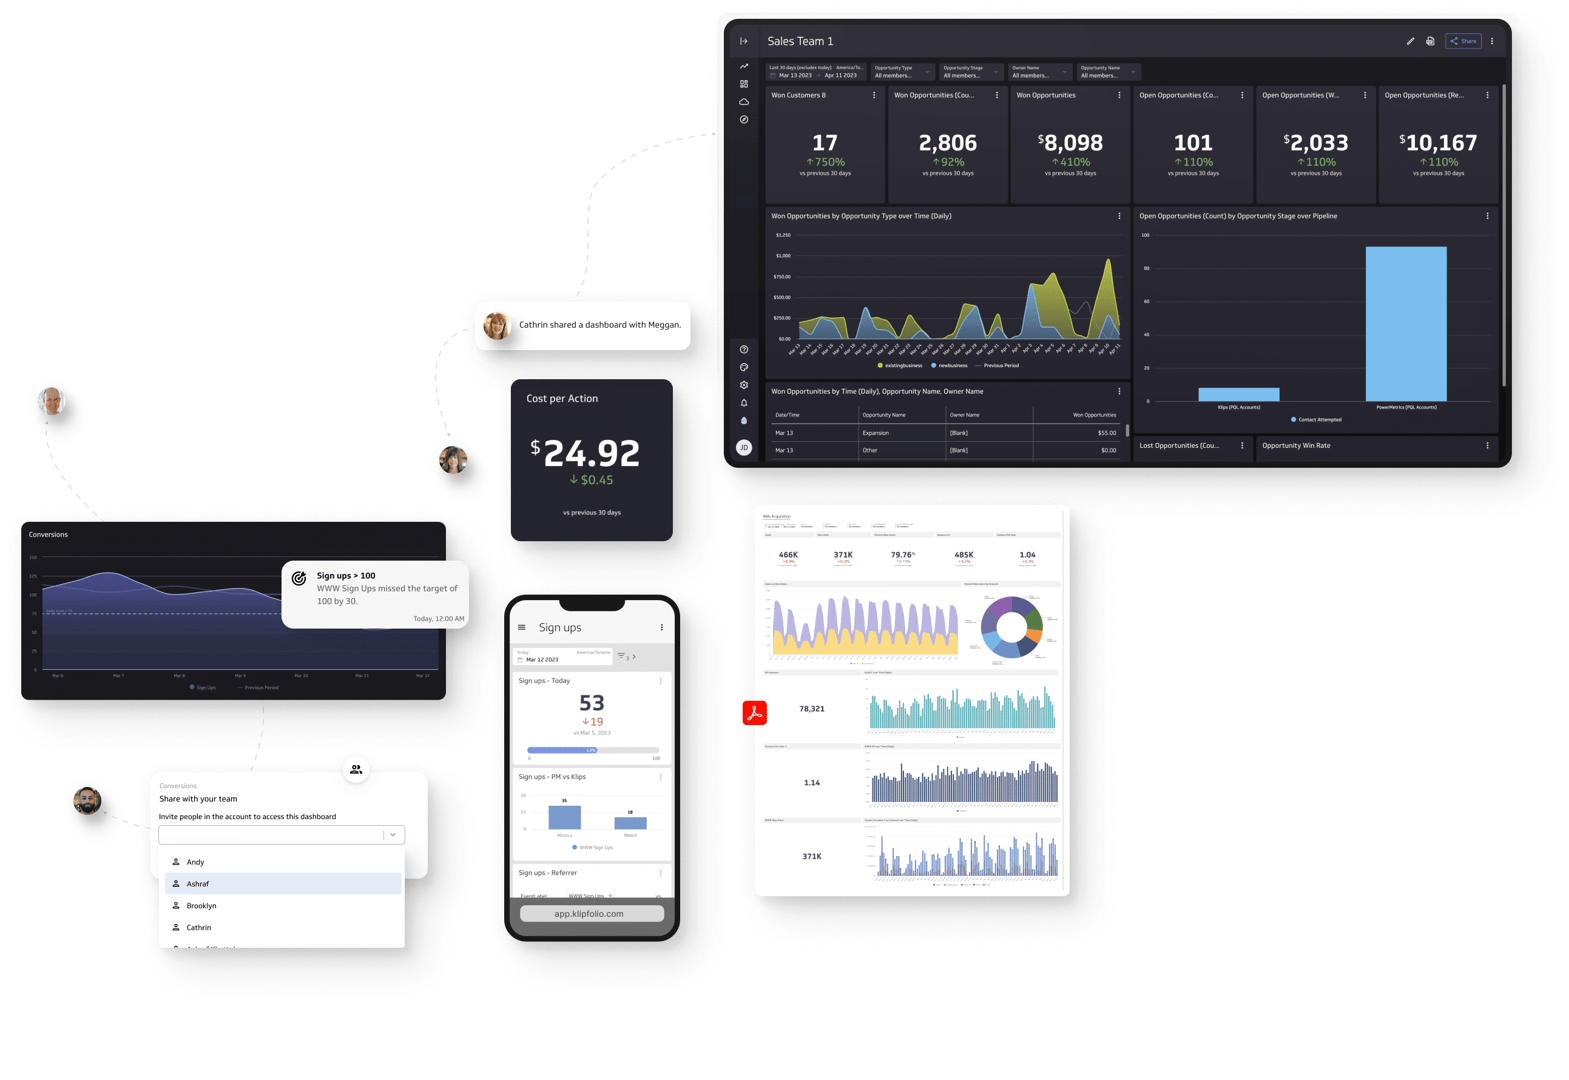
Klipfolio PowerMetrics is essentially a library of centrally-defined key metrics that can be shared with teams and individuals for further analysis. With its seamless compatibility across web browsers, TV monitors, and mobile devices, it can be used to create and distribute real-time business dashboards across multiple platforms. Our tools empower businesses and organizations in various industries, including healthcare, financial services, non-profit organizations, marketing, and sales, to monitor their KPIs and drive data-informed decisions.
Klipfolio also stores data on the cloud, so you can adjust your storage and processing capabilities to align with your evolving business needs.
PowerMetrics is perfectly suited for data-driven teams as it brings data teams and business teams together on one platform. It’s designed to be a single source of truth for the organization’s most important business metrics.
In fact, the main differentiator between Klipfolio PowerMetrics and competitors like Power BI and Qlik Sense is its metric-centric approach to BI.
- Data team handles connectivity, preparing data and building metrics.
- Business teams can also build metrics (either with their own business logic or with pre-built visualizations).
- Once metrics are set up and shared, there are no dependencies with the data team any more, freeing up a lot of time from everyone.
Our dashboard creation is completely code-free and therefore self-serve. Stop your teams from tracking down misaligned KPIs and using unreliable data sources. With PowerMetrics, you’ll get more accurate results with the added challenge of navigating a complicated dashboard.
PowerMetrics also directly integrates with MetricHQ, our community-based dictionary for metrics and KPIs. You can use it to share metrics information with just a few clicks! The user just needs to authenticate with the service and the metric is built in the background using custom data.
Klipfolio can run on Microsoft Edge, Safari, Firefox, and Google Chrome unless you’re in private or incognito mode, as the platform requires certain permissions and settings to function optimally.
What we don’t support are Smart TVs and their native browsers. However, this doesn't limit your ability to display Klipfolio dashboards on TV screens. Unlike Power BI and Qlik Sense, Klipfolio allows you to cast your dashboards onto Smart TVs, enabling you to showcase your data on larger displays for collaborative viewing.
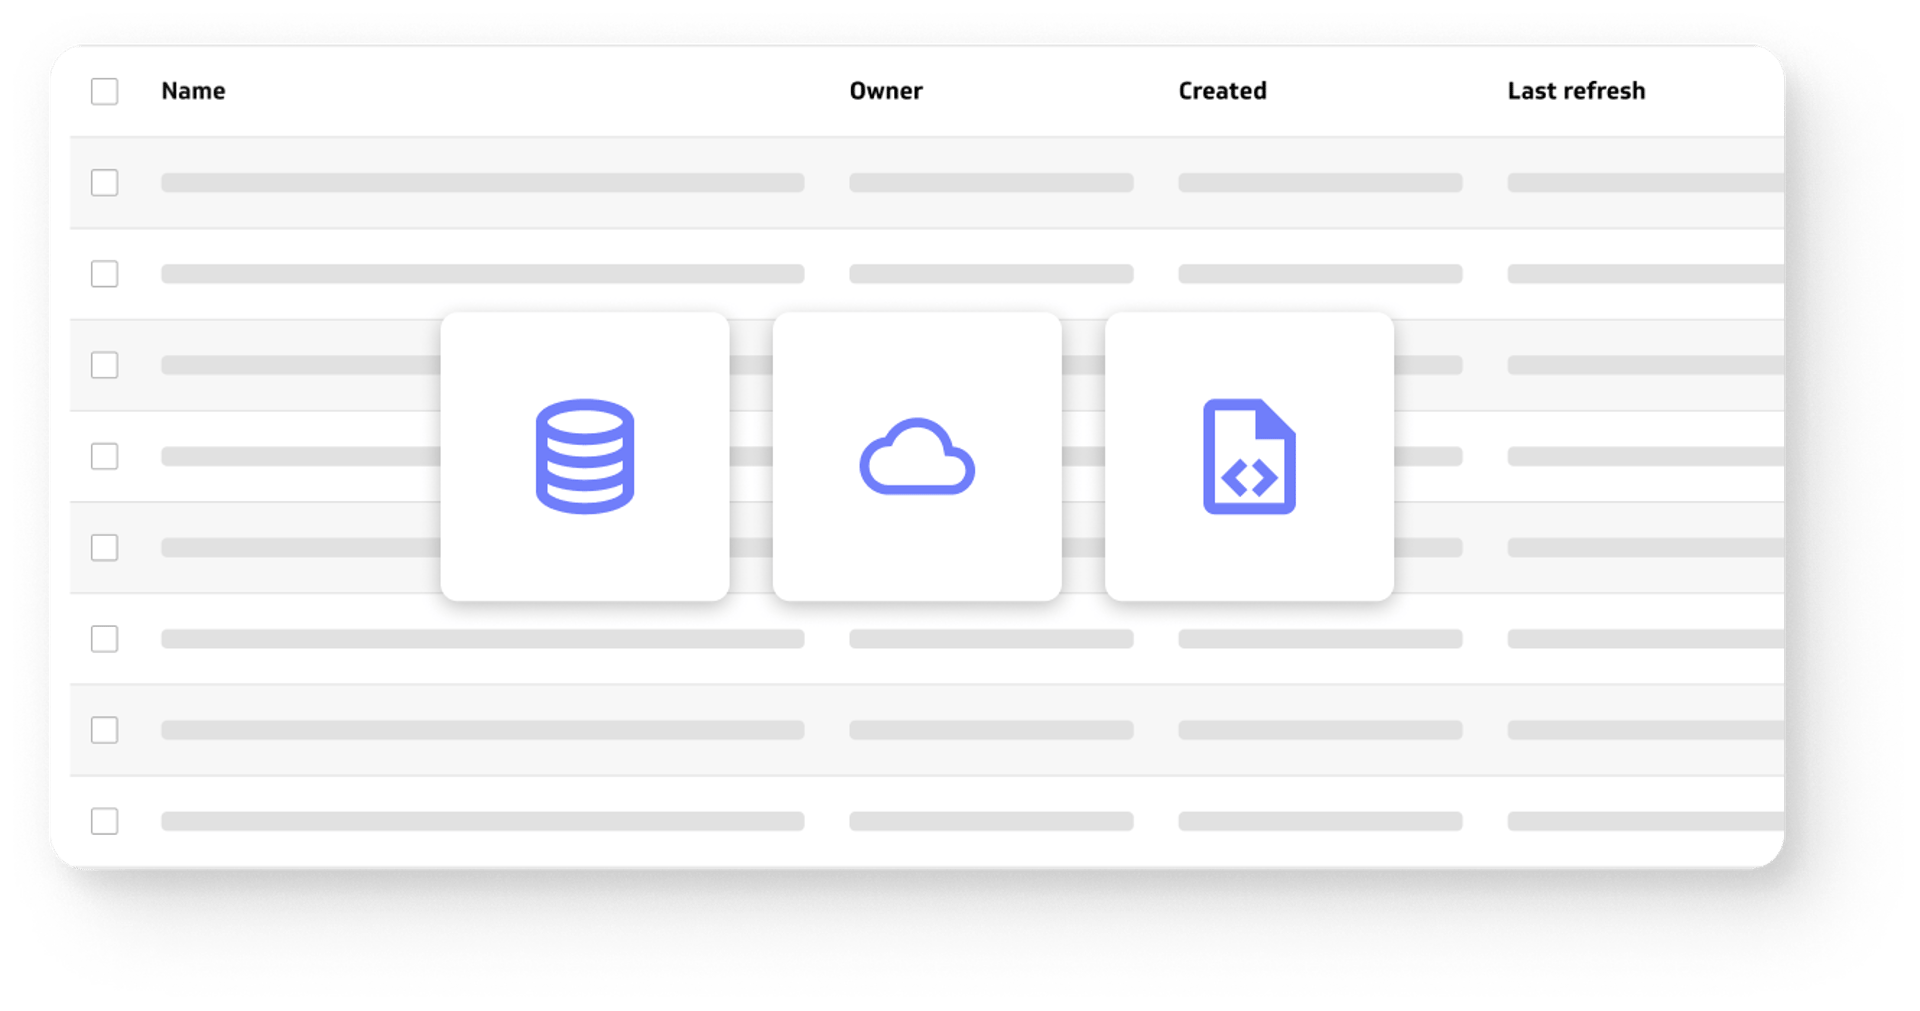
Yes! Klipfolio PowerMetrics is a central repository and stores your metric data. Klipfolio offers automatic storage of your data history, allowing you to track the evolution of your metrics over time or between specific moments. We even store your data in a structured format (including measures, dimensions, and time series), simplifying data handling and promoting a more streamlined visualization process for you and your teams.
When data from raw data sources is refreshed, the updates are automatically reflected in all associated modeled data sources and metrics. If you add instant metrics, Klipfolio PowerMetrics creates and models the data sources for you. You also have the flexibility to adjust the refresh rate frequency for these data sources, ensuring the reliability and accuracy of your metrics while allowing you to control the frequency of data updates.
Klipfolio is browser-based, so customers don't need to update software. We update and improve our software on a weekly or bi-weekly basis. This streamlined approach allows you to focus more on your data analysis, fully knowing that you’re always working with an up-to-date and optimized version of our services. For comparison, Power BI and Qlik Sense usually roll out updates for their platforms monthly.
Klipfolio PowerMetrics seamlessly integrates with cloud file sharing services like Dropbox or upload files allowing users to incorporate offline data into their dashboards. For instance, you can leverage targets stored in Excel, ensuring that your performance metrics align with predefined objectives. You can also integrate call center data exported in CSV files, enabling you to monitor and analyze customer interactions and support performance.
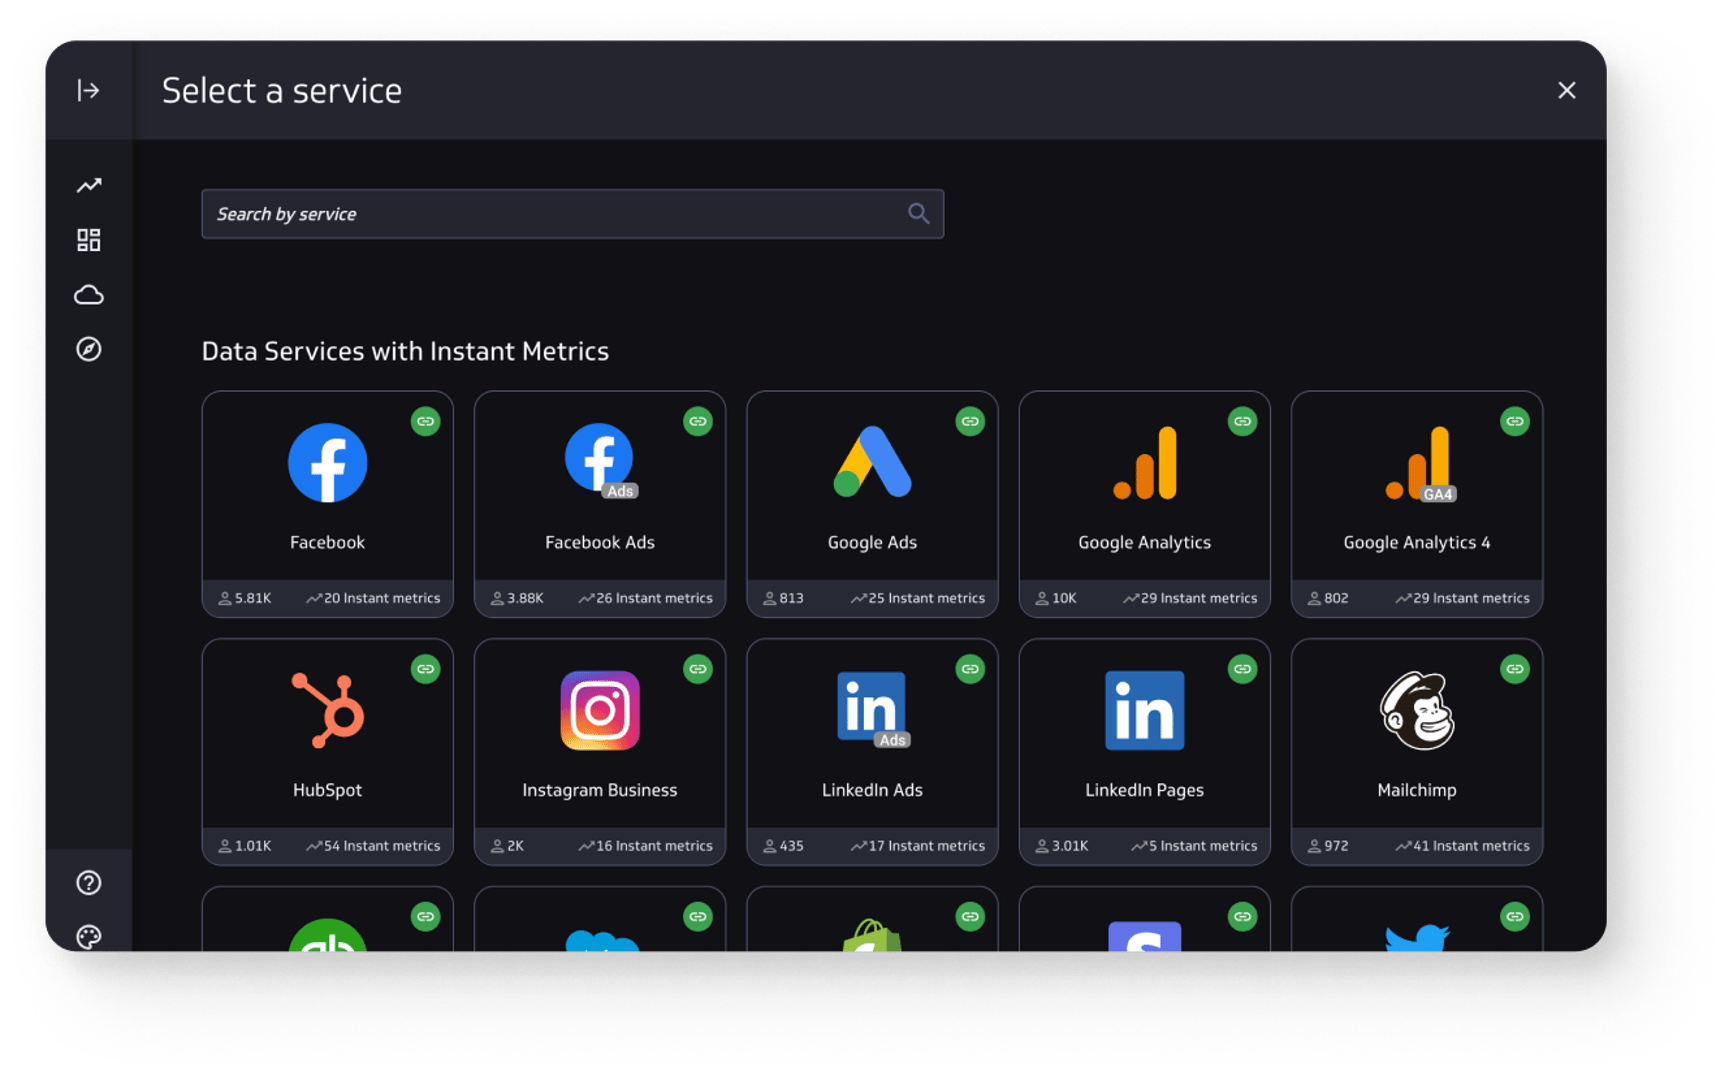
Klipfolio has an extensive library of applications it can integrate with, including Google Analytics 4, Google Ads, HubSpot, Instagram, Facebook Ads, Xero, Quickbooks and Salesforce. You can find more about our integrations here.
Don’t find the service integration you need? It’s easy to use RES/URL, SQL queries, spreadsheets, uploaded files, cloud file sharing services or FTP/SFTP to connect your data with PowerMetrics.
Our platform is fully responsive on mobile, so you don’t need an app. Both your metrics and dashboards can be viewed and edited on the go on any mobile device.
Klipfolio provides a flexible pricing model that caters to various user needs. For example, Klipfolio offers a freemium plan for two editor users, unlimited view-only users, unlimited metrics and a limited number of data services, and other features.
Our most popular plan is Klipfolio Pro ($225/month), which expands your user numbers, number of dashboards, faster data refresh and priority support. Large enterprises with more extensive requirements can enjoy Klipfolio Business as well. This plan offers near-unlimited features, allowing you to leverage the full potential of Klipfolio's capabilities.
Much like Power BI and Qlik Sense, Klipfolio is a cloud-based analytics platform. Just that it provides a comprehensive library of pre-built visualizations, formulas, and functions to facilitate data analysis and reporting. It offers a user-friendly interface and supports various data sources, including spreadsheets, databases, and web services. Users can set up alerts and notifications based on specified conditions to stay informed about important changes in their data.
With Klipfolio, users can build metric-centric dashboards and visualize data using a wide range of interactive visualizations. It’s a versatile and user-friendly tool for creating real-time business dashboards, providing data visualization, collaboration, and data manipulation features to help users make data-driven decisions effectively.
