

Looker vs Tableau
The main difference between Looker and Tableau is that Looker emphasizes centralized data modeling through its LookML language, providing consistent data definitions and governance across an organization. In contrast, Tableau specializes in powerful, user-friendly data visualization tools that allow users to create interactive dashboards and perform self-service analytics with ease.
In today's data-driven business landscape, having the right business intelligence (BI) software is crucial for organizations aiming to unlock valuable insights and make informed decisions. Data analysis and visualization tools like Looker and Tableau, the latter of which was acquired by Salesforce in 2019, are two premier business intelligence and data analytics applications that have become highly popular in this field. However, amidst the comparison of these two giants, a hidden contender is on the rise, an alternative that has begun to turn heads in the industry.
Imagine a solution that offers robust features and intuitive data visualization and takes a metric-centric approach to BI, revolutionizing how data and business teams collaborate. This alternative, which we will delve into later, introduces a central hub for governing and managing all of an organization’s most important metrics combined with easy-to-use code-free self-service capabilities that are transforming the BI landscape.
What is Looker?
Looker is a business intelligence and data analytics platform that provides a centralized hub for data exploration and analysis, empowering organizations to gain valuable insights and make data-driven decisions. It offers powerful features including intuitive data exploration and visualization, drag-and-drop dashboard creation, robust data modeling and SQL-based queries, collaborative, embedded analytics for seamless integration, and more. These features enable data teams to handle much of the heavy lifting and business users to easily explore and analyze data, create interactive dashboards and collaborate effectively.
What is Tableau?
Meanwhile, Tableau, backed by Salesforce’s resources and expertise, has enjoyed a strong reputation as a leader in data visualization, providing visually stunning and interactive dashboards that captivate users across various sectors. The acquisition has allowed Tableau to leverage Salesforce's CRM capabilities and integrate its powerful data visualization features into the broader Salesforce ecosystem. This integration enables users to seamlessly connect and analyze CRM data directly within Tableau, providing valuable insights for sales, marketing, and customer service teams.
The software’s main strength lies in its extensive range of visualization options and a user-friendly drag-and-drop interface, allowing users to explore data from multiple perspectives and easily uncover hidden insights and trends. With Tableau, users can effortlessly create dynamic and engaging reports that captivate stakeholders and facilitate data-driven discussions.
Looker vs Tableau vs Klipfolio PowerMetrics Comparison
When choosing the right BI software for your organization, Looker, Tableau, and Klipfolio PowerMetrics are three prominent names often discussed. Our comparison of these three platforms will provide a comprehensive overview of their key features, capabilities, and pricing. By examining these tables, you can decide which BI solution aligns best with your organization's needs and objectives.
Visualization and dashboards
Yes, automatically generated and customizable
Yes, automatically generated and customizable
79
24
25+
400+
Data connections
Data preparation
Data history and storage
Exploration
Yes (Labs)
Yes (Labs)
Yes (Labs)
Yes (Labs)
Yes (Labs)
Sharing and distribution
Pro
Pro
Privacy and security
Support and resources
API
Why Klipfolio
PowerMetrics is the best alternative to
Looker & Tableau
At Klipfolio, we prioritize the needs and requirements of our clients above all else. Thanks to continuous upgrades, we improve our software every day to ensure that you're getting all the features you want without the added premiums.
Data modeling and exploration capabilities
Looker and Tableau offer robust modeling and exploration features suitable for data-driven organizations. Looker is highly regarded for its powerful data modeling capabilities, allowing users to create sophisticated data models and perform complex transformations. On the other hand, Tableau excels in data exploration tools, providing a visually rich and interactive experience. Its drag-and-drop interface enables users to effortlessly explore and analyze data through charts, graphs, and maps.
However, it is important to consider Tableau's reported issues in this area, particularly limitations in customization options. Some users find certain design elements or advanced visualizations challenging to implement. Additionally, some users have expressed concerns about the platform's difficulty for non-coders to learn, potentially impacting the efficiency of data modeling and exploration for users without strong technical backgrounds.
Meanwhile, Klipfolio PowerMetrics introduces a unique approach to data modeling and exploration. The software puts a strong focus on defined business metrics as opposed to raw data. It ensures that each metric has a clear meaning to get everyone on the same page. Additionally, Klipfolio PowerMetrics accompanies each metric with a description that specifies how it is calculated, how the data is aggregated, and over which time grain.
Its metric-centric methodology simplifies the process of building metrics and empowers data and business teams to collaborate seamlessly. By bridging the gap between data and business teams, the software enhances the overall data modeling and exploration capabilities, facilitating a more efficient and collaborative data analysis process.
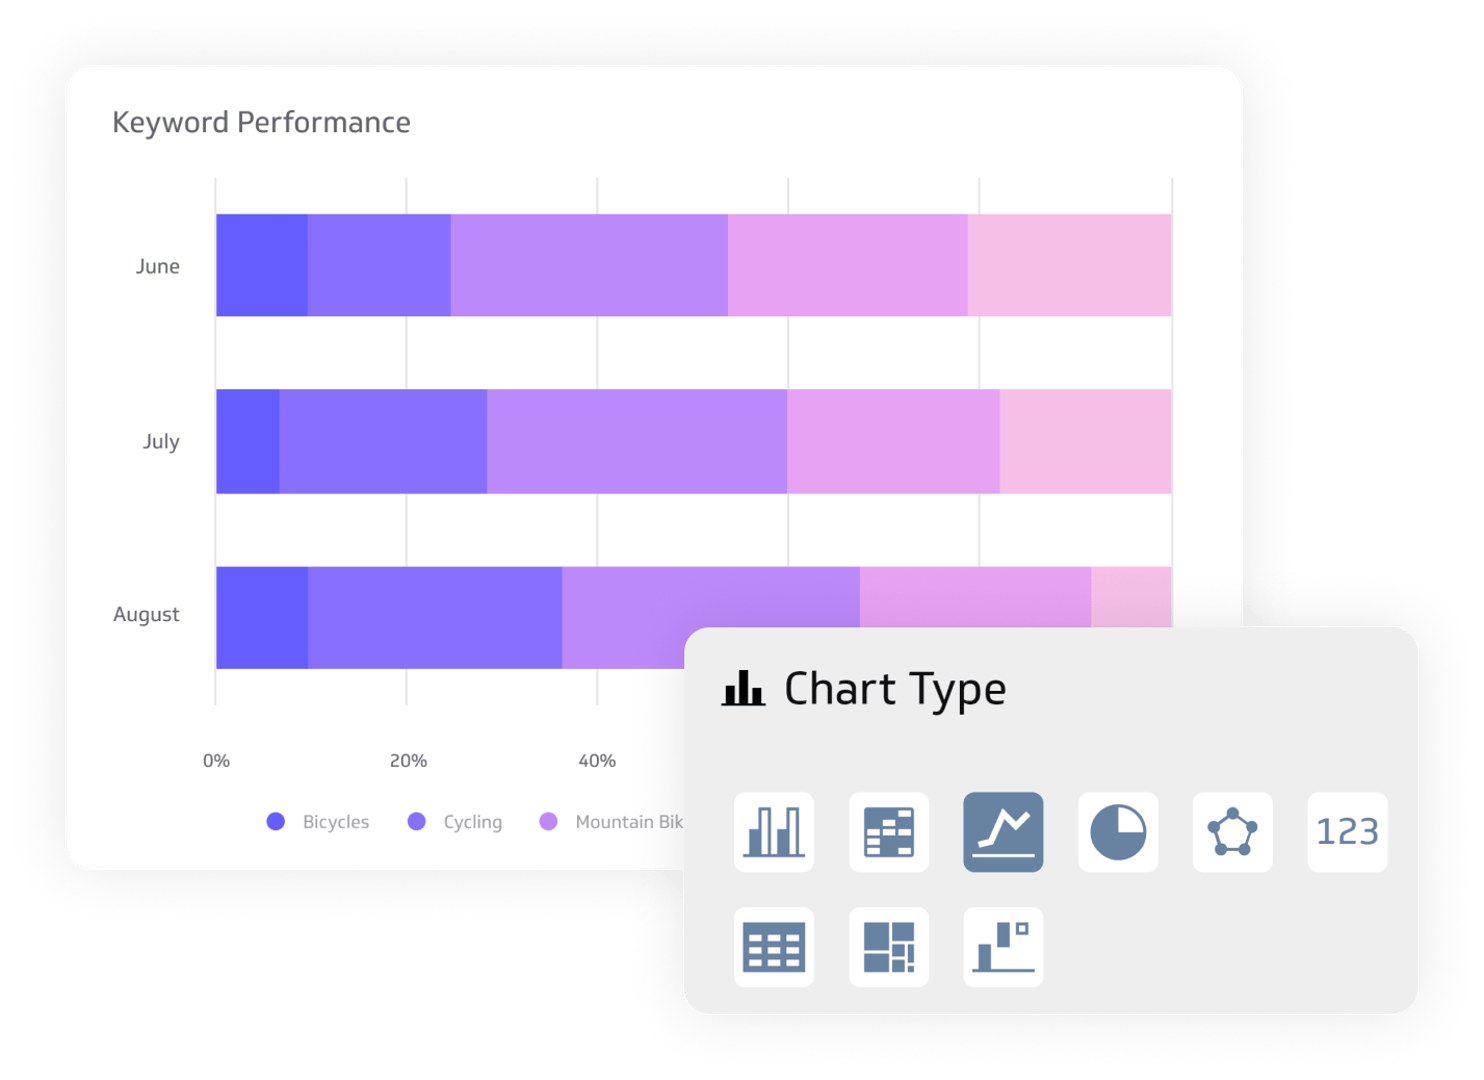
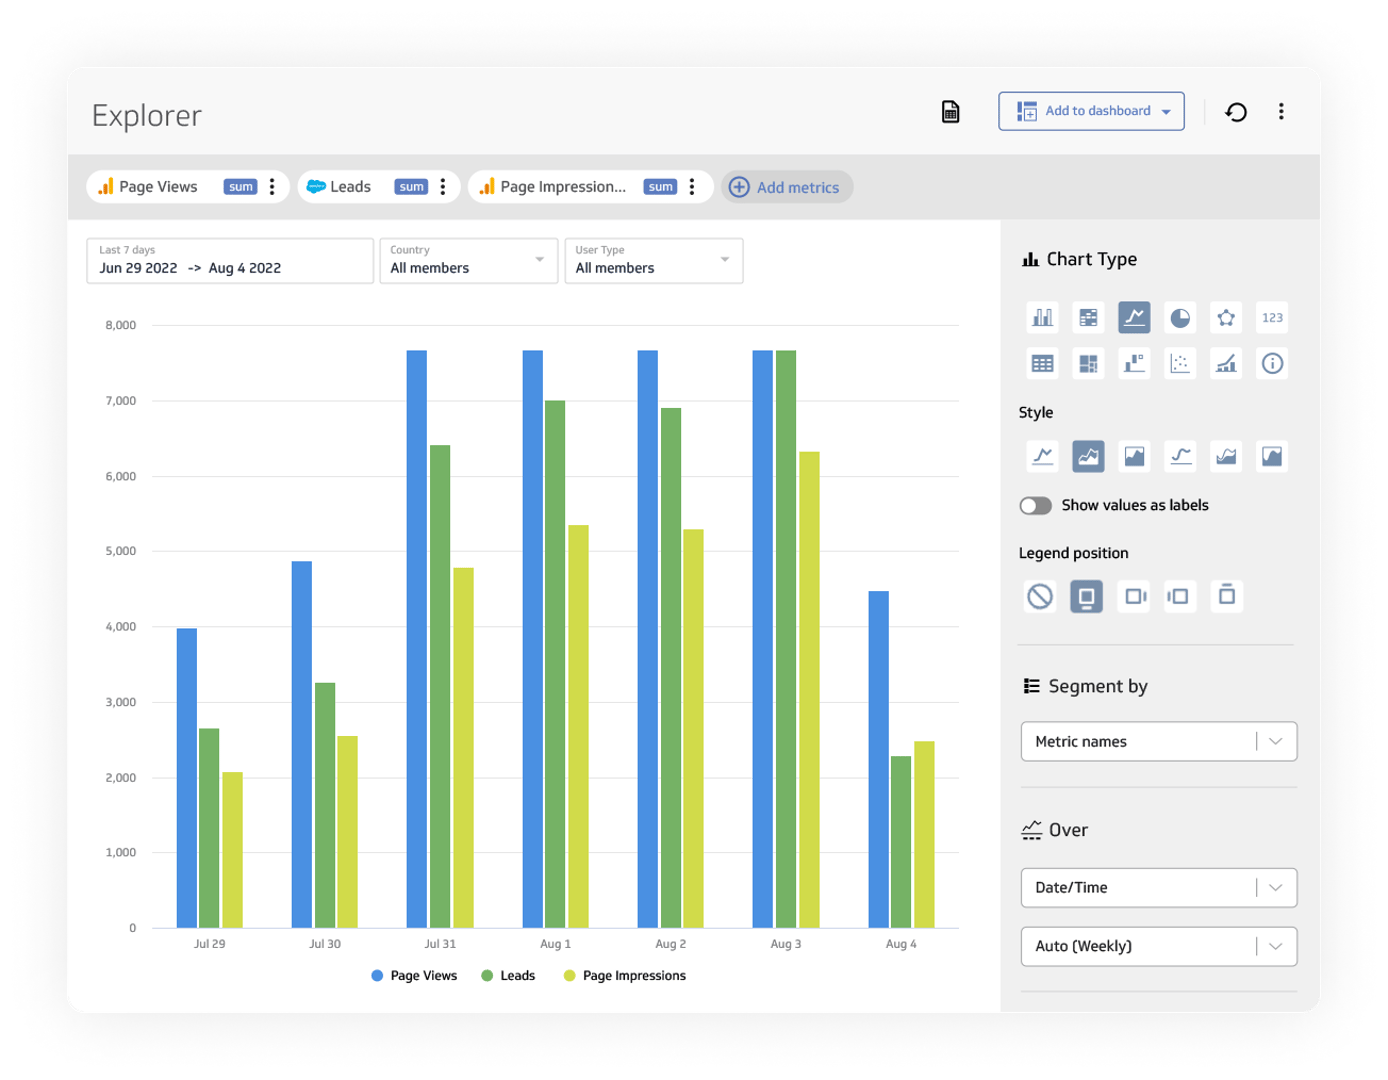
Data visualization options
Regarding data visualization, Looker and Tableau offer distinct strengths that cater to different user preferences and needs. Looker’s platform provides a solid foundation for data visualization with its extensive library of charts, graphs, and visualizations. It offers flexibility in creating custom visualizations and allows for interactive data exploration.
On the other hand, Tableau is renowned for its exceptional data visualization capabilities. It offers a wide range of visually stunning charts, dashboards, and interactive visualizations allowing users to communicate data insights effectively. Tableau's drag-and-drop interface makes it easy to create engaging visualizations, and its extensive array of pre-built templates and visual elements provides a rich and customizable visualization experience.
However, as mentioned, many Tableau users have expressed frustration over how users without technical backgrounds may face challenges in effectively using Tableau. Sometimes, the dashboards also load slowly, which can significantly impact the user experience. Users may face longer waiting times when accessing critical information, which can lead to frustration and reduced productivity. For time-sensitive tasks or on-the-go decision-making, the platform may actually impede quick insights and informed actions.
In comparison, Klipfolio PowerMetrics provides a unique perspective on data visualization. While it may not offer the same breadth of options as Tableau, it delivers a visualization layer that consistently works with any metric. This means that any metric can be easily visualized over time, filtered, and segmented. By organizing metrics and visualizations in a metrics catalog, users can self-serve and choose the specific metrics they need to build their own dashboards and reports. Klipfolio PowerMetrics enables users to create interactive dashboards and visualizations tailored to their unique business goals, ensuring the monitoring and tracking of key performance indicators becomes even more effective.
Self-service analytics and creation features
Looker and Tableau both excel in providing self-service analytics and empowering users to create interactive dashboards. Looker’s user-friendly interface allows business users to explore data, build reports, and develop dashboards without heavy reliance on IT or data teams. Meanwhile, Tableau is a desktop-based platform more widely recognized for its intuitive drag-and-drop interface, making it easy for users to build interactive dashboards and reports. With Salesforce's resources, Tableau has been able to invest in improving its self-service analytics capabilities, ensuring that users have the tools they need to explore and analyze data effectively.
Despite the benefits of Tableau's self-service analytics, though, the prevalent issues reported by users can, to some extent, cancel out these advantages: For one, the inability to achieve highly customized visualizations may lead to less impactful data presentations, making it challenging to effectively communicate complex insights or highlight key trends. In turn, this can hinder the decision-making process, as stakeholders may struggle to derive actionable insights from data that are not presented in a format that resonates with their specific context or objectives.
Both platforms' visual discovery capabilities allow users to explore data from different angles and uncover meaningful insights. However, Looker outshines Tableau when it comes to self-service analytics just because users need less training to use the platform compared to Tableau.
Klipfolio PowerMetrics takes a distinct approach to self-service analytics and dashboard creation. Users, regardless of their technical expertise, can leverage the code-free environment to build and customize metrics specific to their needs. This empowers data and business teams to collaborate effectively in creating self-serve dashboards with real-time data. Klipfolio PowerMetrics enables decision-makers at all levels of the organization to access insights and make informed decisions based on the metrics that matter most to them.
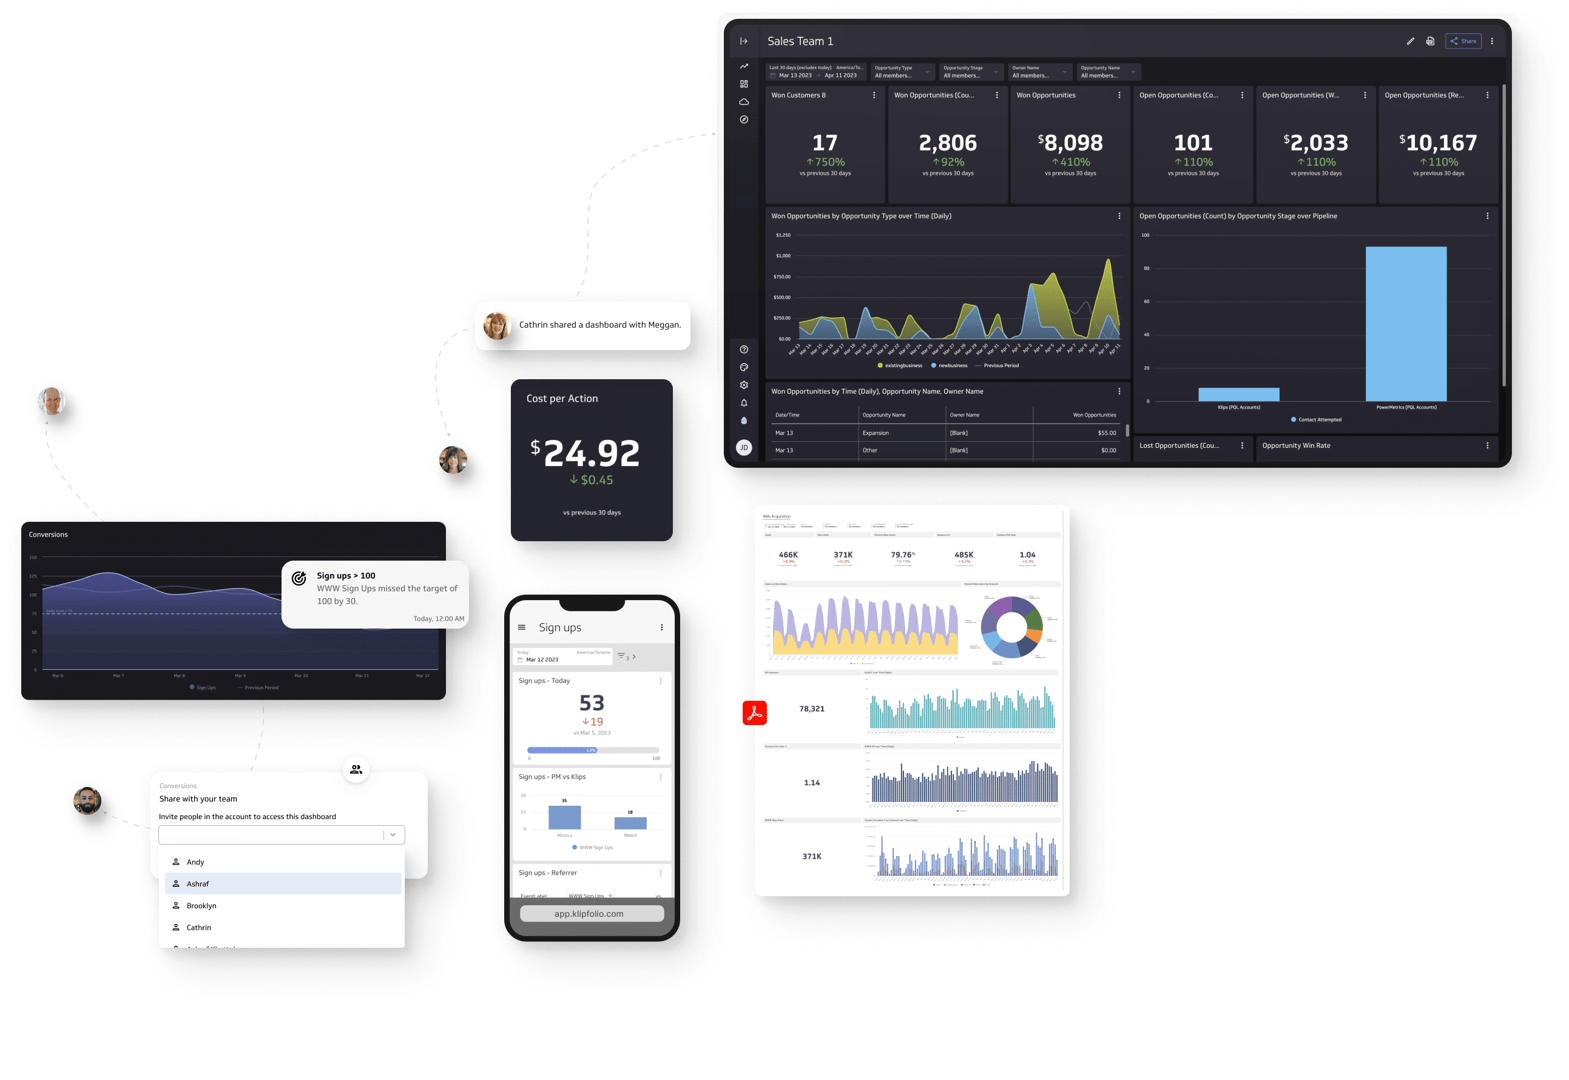
Collaboration and sharing features
Collaboration and sharing features are essential for fostering a data-driven culture within organizations. Both Looker and Tableau offer robust capabilities, allowing users to collaborate, share insights, and facilitate knowledge exchange. For example, Looker’s dashboard provides a collaborative environment where users can annotate reports, share dashboards, and collaborate on data analysis.
Tableau, similarly, emphasizes collaboration through its interactive and shareable dashboards. It has been able to enhance its collaboration capabilities by leveraging Salesforce's expertise in this area. Users can now collaborate more effectively within Tableau's interactive and shareable dashboards, benefiting from features like commenting and annotation, which allow for direct feedback and collaboration within the platform Tableau is beneficial for businesses that use features like commenting and annotation, allowing users to provide feedback and collaborate directly within the dashboards.
Klipfolio PowerMetrics enhances collaboration and sharing by providing a centralized platform for teams to access real-time data and insights. With Klipfolio PowerMetrics, users can create shared dashboards that multiple organizational stakeholders can access. This promotes transparency and ensures everyone works with the same key metrics. The platform also offers the ability to schedule automated email reports and notifications, keeping team members informed and engaged.

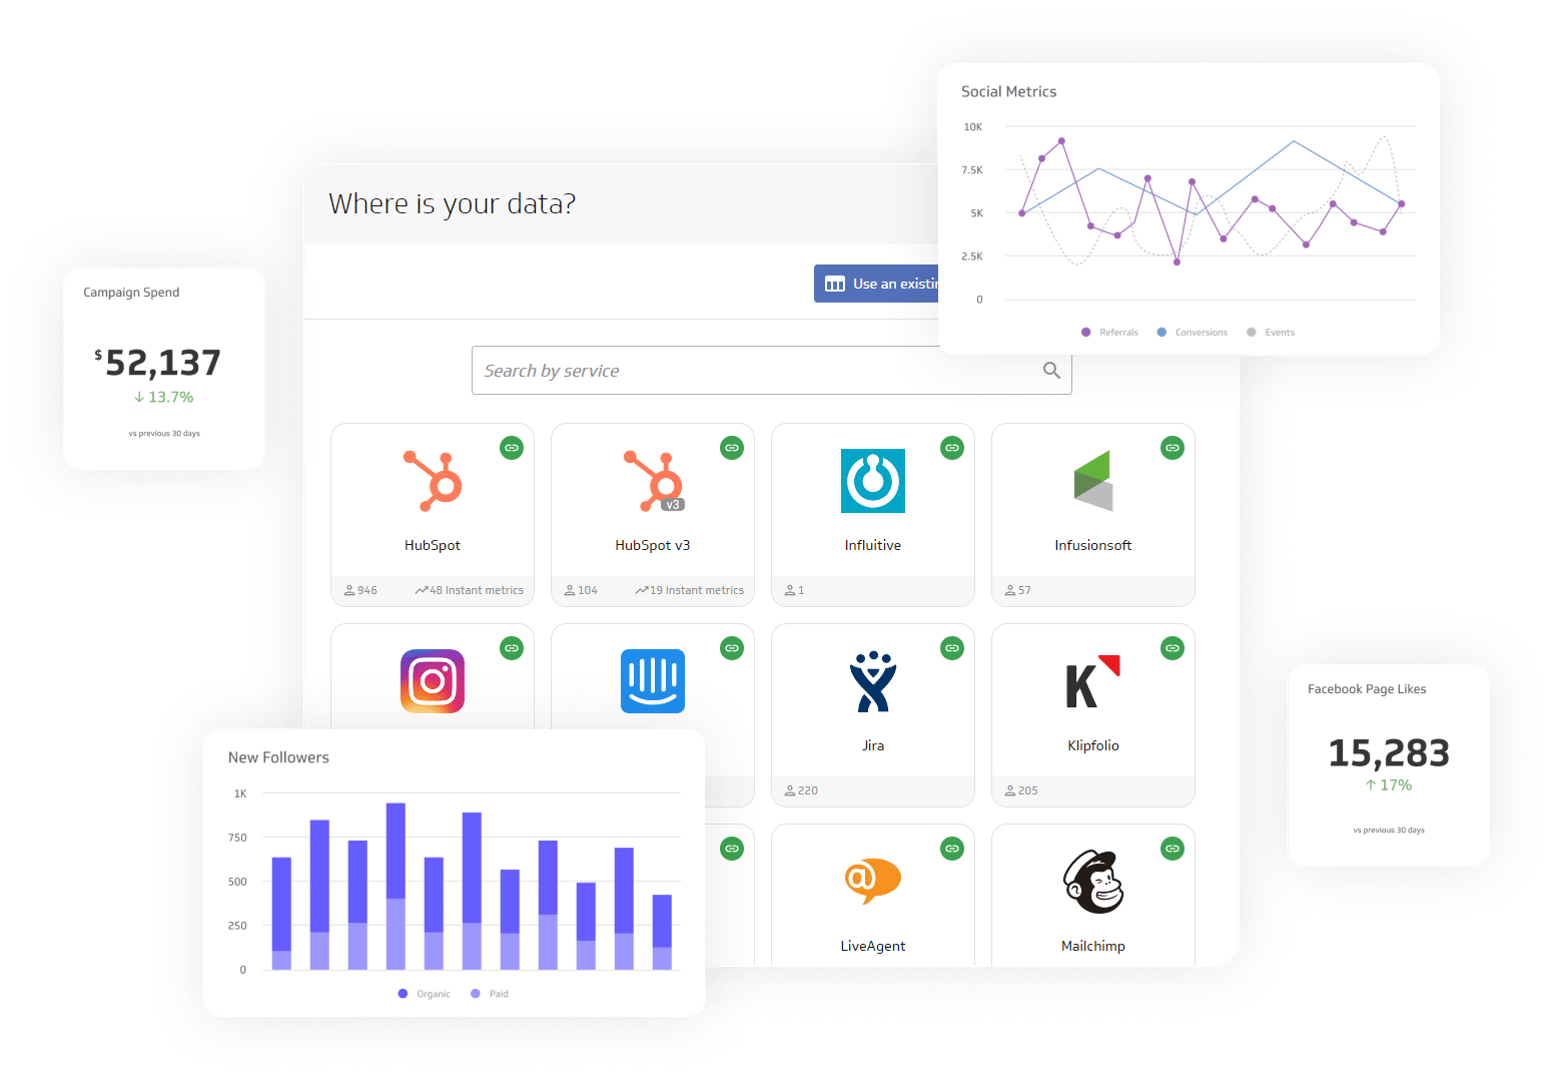
Integration with data sources and platforms
Seamless integration with various data sources and platforms is crucial for a comprehensive business intelligence solution. Looker and Tableau offer capabilities to connect and integrate with different data sources, providing users with a holistic view of their data, though Tableau is more effective with extensive data sets.
Connectivity options offered by Looker allow users to connect to various data warehouses, databases, and cloud platforms. It supports popular data sources such as Google BigQuery, Amazon Redshift, and Snowflake, enabling users to access and analyze data from different systems within a unified interface. Aside from all that, however, Tableau's integration capabilities have been further strengthened since joining forces with Salesforce. Since the acquisition, Tableau has expanded its connectivity options, seamlessly connecting to various data sources, cloud platforms, and popular services within the Salesforce ecosystem, including Google Analytics and Microsoft Excel. Users can now access and analyze data from diverse sources within a unified interface, enabling a more comprehensive analysis.
Klipfolio PowerMetrics focuses on simplifying the integration process by providing pre-built connectors to popular data sources and platforms. It offers seamless connections to services like Google Analytics, Facebook Ads, and Salesforce, allowing users to access and integrate their data quickly. Klipfolio PowerMetrics also provides a user-friendly interface for setting up data connections, ensuring users can easily connect to their desired data sources without extensive technical knowledge.
Real-time data connectivity and updates
Unleashing the power of real-time data is crucial for making timely and informed business decisions. Looker, Tableau, and Klipfolio PowerMetrics offer real-time data connectivity and updates to ensure users have access to the most current information. By connecting to live data sources, Looker’s dashboard provides its users with up-to-the-minute insights based on real-time data. This real-time connectivity empowers users to monitor key metrics and make data-driven decisions. Tableau also allows users to connect to their data in real-time as part of its live connection feature. Users can establish direct connections to data sources, ensuring their visualizations and dashboards reflect the most recent data.
With Klipfolio PowerMetrics, you can access real-time metrics instantly. Users can connect to live data sources and visualize real-time data on their dashboards without delays. Klipfolio PowerMetrics ensures that users always have a pulse on their most critical metrics, enabling proactive decision-making based on up-to-the-second insights.

Klipfolio is trusted
across industries.
PowerMetrics has been helping teams just like yours organize, visualize, and share metrics since 2019. With extensive docs, an AI-powered help UI, friendly support staff, a free tier, and low pricing plans, now's the time to give us a try.
"We've grown by over 300% since using Klipfolio, and the decisions that led to this growth have come from data displayed on Klipfolio."
Marcus Taylor
Founder and CEO of Venture Harbour"Our leadership team is making smarter decisions and were on target to grow by 40 - 50% this year thanks to our insights from Klipfolio."
Brian Dainis
Founder and CEO of Curotec"I love the full range of capabilities that are possible when building a Klipfolio dashboard (specifically with their Klips product). Unlike the majority of BI platforms, building with Klipfolio feels more like designing a web page than configuring a single chart at a time. [...] Variables are straightforward and can be made independent of the data, which makes room for creative solutions to a wide variety of UI requirements."
Graham H
Principal Consultant for SMBs"Klipfolio is data analytics software that is best suited for businesses of all sizes that are looking to get instant insights from their data"
Looker vs Tableau vs Klipfolio Pricing
Free for analyzing data from Google platforms
$70/u/m (Creator), $42/u/m (Explorer), $15/u/m (Viewer), $250/m (Resource
Starts at $56/m (billed annually)
Pricing plays a significant role when considering a business intelligence solution. Let's delve into the pricing structures of Looker, Tableau, and Klipfolio PowerMetrics to assess their affordability and value for money.
Klipfolio PowerMetrics offers a freemium model, allowing users to access a limited platform version for free. Klipfolio provides a range of paid pricing plans for expanded capabilities. The pricing for Klipfolio PowerMetrics starts at $56 per month (billed annually), depending on the features, functionality, and support required. This pricing structure provides flexibility and scalability for organizations of different sizes and needs.
When considering the affordability and value for money of these solutions, it is crucial to assess your organization's specific needs and budget. Tableau's pricing plans cater to different user roles and levels of functionality, allowing for greater customization. Klipfolio PowerMetrics offers a range of pricing plans with flexible options, including a freemium offering. Looker's pricing details for their paid plans are not readily available, requiring direct communication for further exploration.
Careful consideration of each solution's features, scalability, and support in relation to their respective pricing structures will help determine the best fit for your organization's unique requirements and financial considerations.
Looking for more comparisons of Tableau vs other products? Read out other comparisons here: Power BI vs Tableau, Domo vs Tableau and Tableau vs Klipfolio.
Frequently Asked Questions
Klipfolio PowerMetrics prioritizes data security and implements industry-standard measures to protect user information. This includes data encryption, secure data transmission, and compliance with privacy regulations. Klipfolio also offers role-based access controls and user permissions to ensure that data is only accessible to authorized individuals.
Klipfolio PowerMetrics is a single source of truth for key business metrics, ensuring consistency and alignment across the organization. It offers robust features for real-time data sharing and collaboration. Users can share interactive dashboards, metrics, and reports with stakeholders, ensuring everyone can access the latest information. The platform enables collaboration through features like commenting, real-time notifications, and data-driven discussions, promoting effective teamwork and informed decision-making.
Klipfolio PowerMetrics offers seamless integration capabilities with a wide range of data sources and platforms. It supports connections to popular databases, cloud services, spreadsheets, and APIs, allowing users to consolidate and analyze data from multiple sources within a unified interface. This metric-centric integration flexibility empowers organizations to leverage their existing data infrastructure and maximize the value of their data assets.
