QuickBooks
QuickBooks is a top-quality accounting solution for businesses. The service categorizes all your transactions and gives you instant access to your profit and loss wherever you are.
Track all your QuickBooks KPIs in one place
Sign up for free and start making decisions for your business with confidence.


Building QuickBooks dashboards
QuickBooks is an ideal accounting software for freelancers and small businesses. QuickBooks is used primarily by small business owners, bookkeepers, accountants, finance officers, and solopreneurs.
Integrating QuickBooks with Klipfolio allows you to develop custom dashboards that give you and your team insight into your performance. Pull key metrics from your QuickBooks account into a dashboard that's up-to-date and easy to share with the whole team. Take your dashboard to the next level by combining your QuickBooks data with services like Salesforce, Excel, and hundreds more.
Building a dashboard with QuickBooks
Ready to start building your custom dashboard using QuickBooks? Before you get started, take the time to read this blog. You'll learn all about:
- Connecting to QuickBooks Online
- Best practices for building finance metrics
- Top finance KPIs you should be tracking
- And more
Use pre-built QuickBooks metrics
Assemble a QuickBooks dashboard by selecting pre-built metrics from the Klip Gallery.
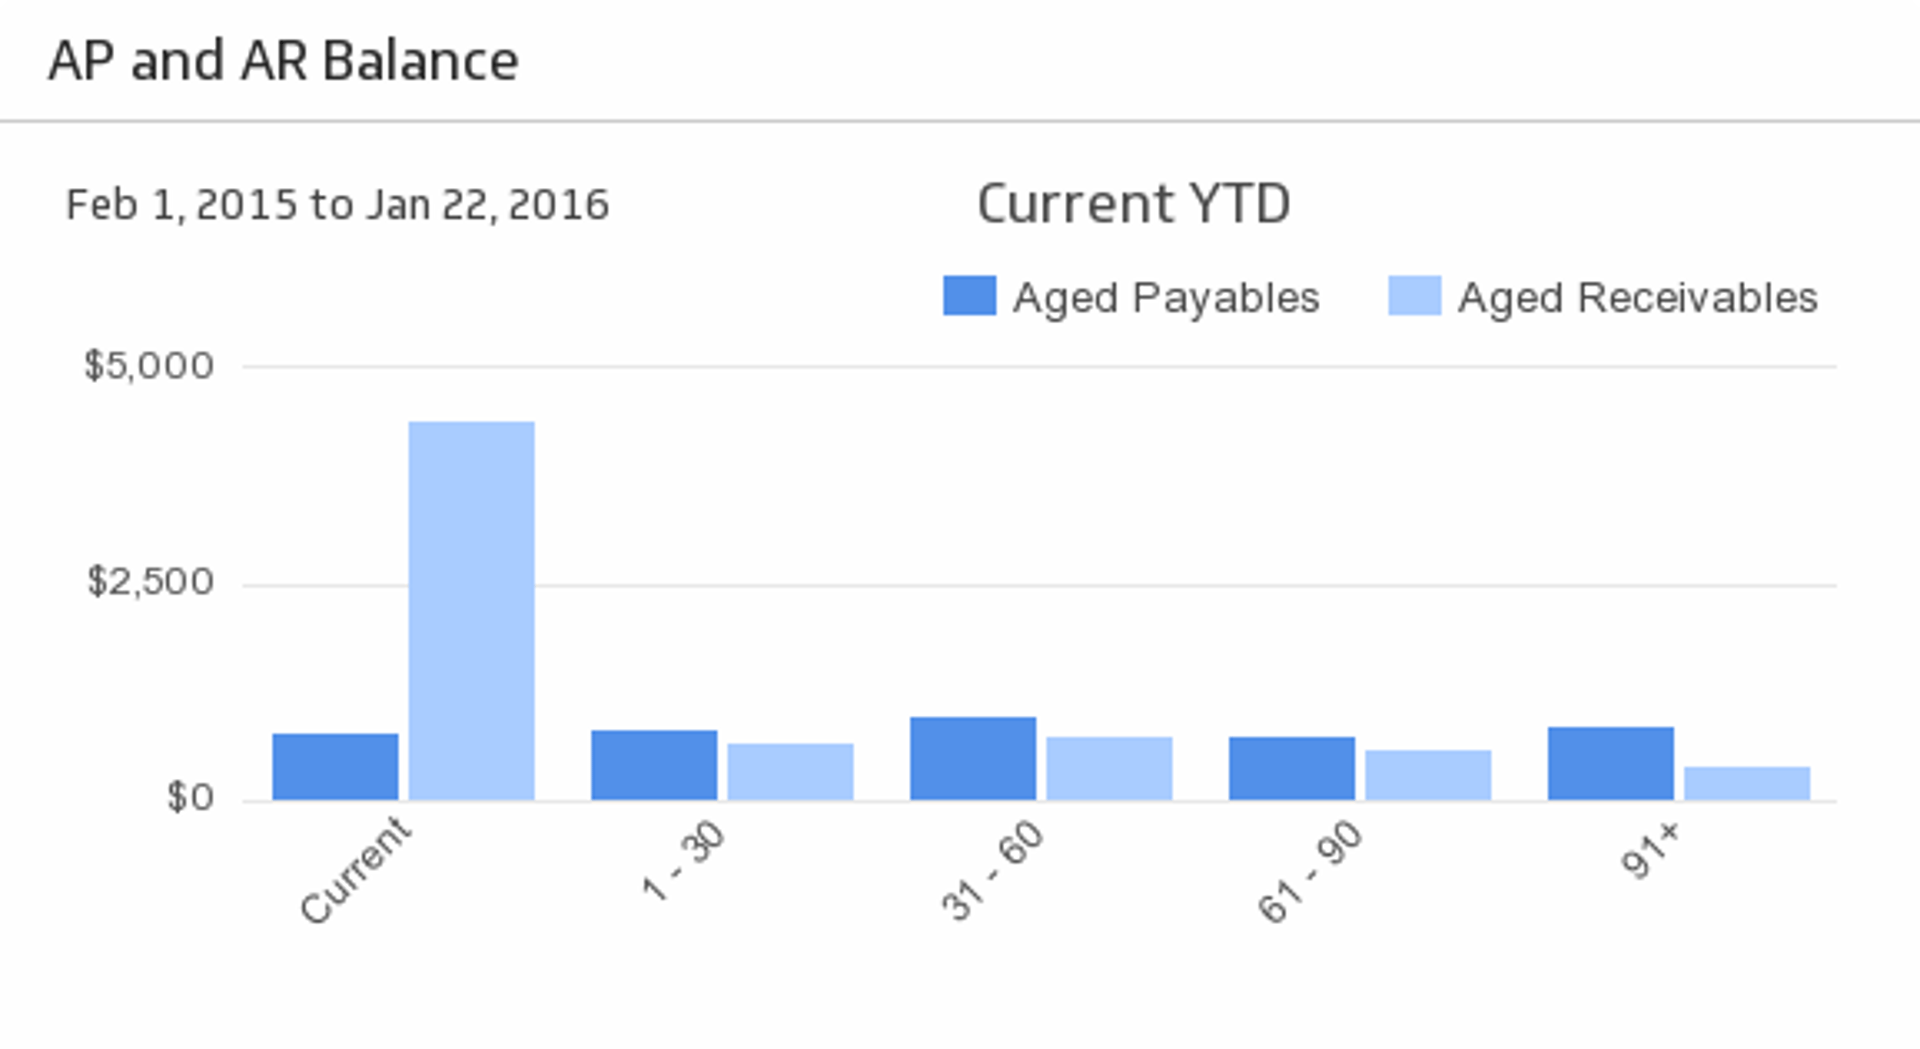
AP and AR Balance
See your Accounts Payable and Accounts Receivable at-a-glance during the time period of your choice.
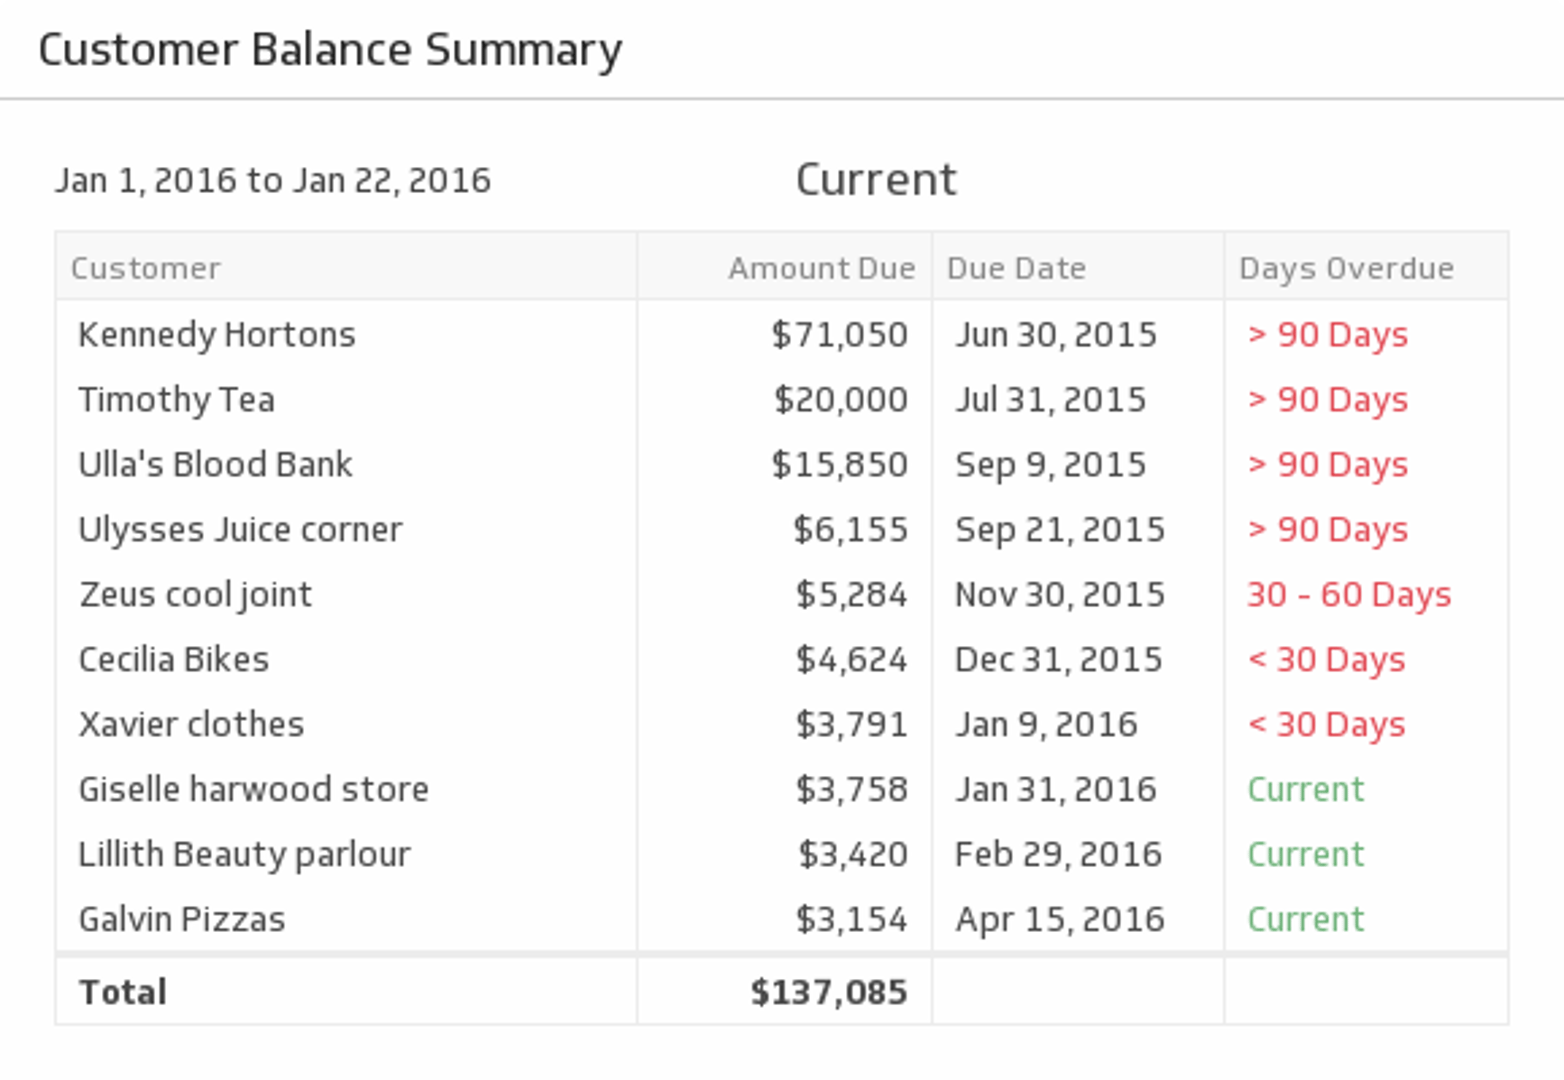
Customer Balance Summary
Cash-flow can make or break a venture. See which customers are current and which ones owe you money during the time period of your choice.
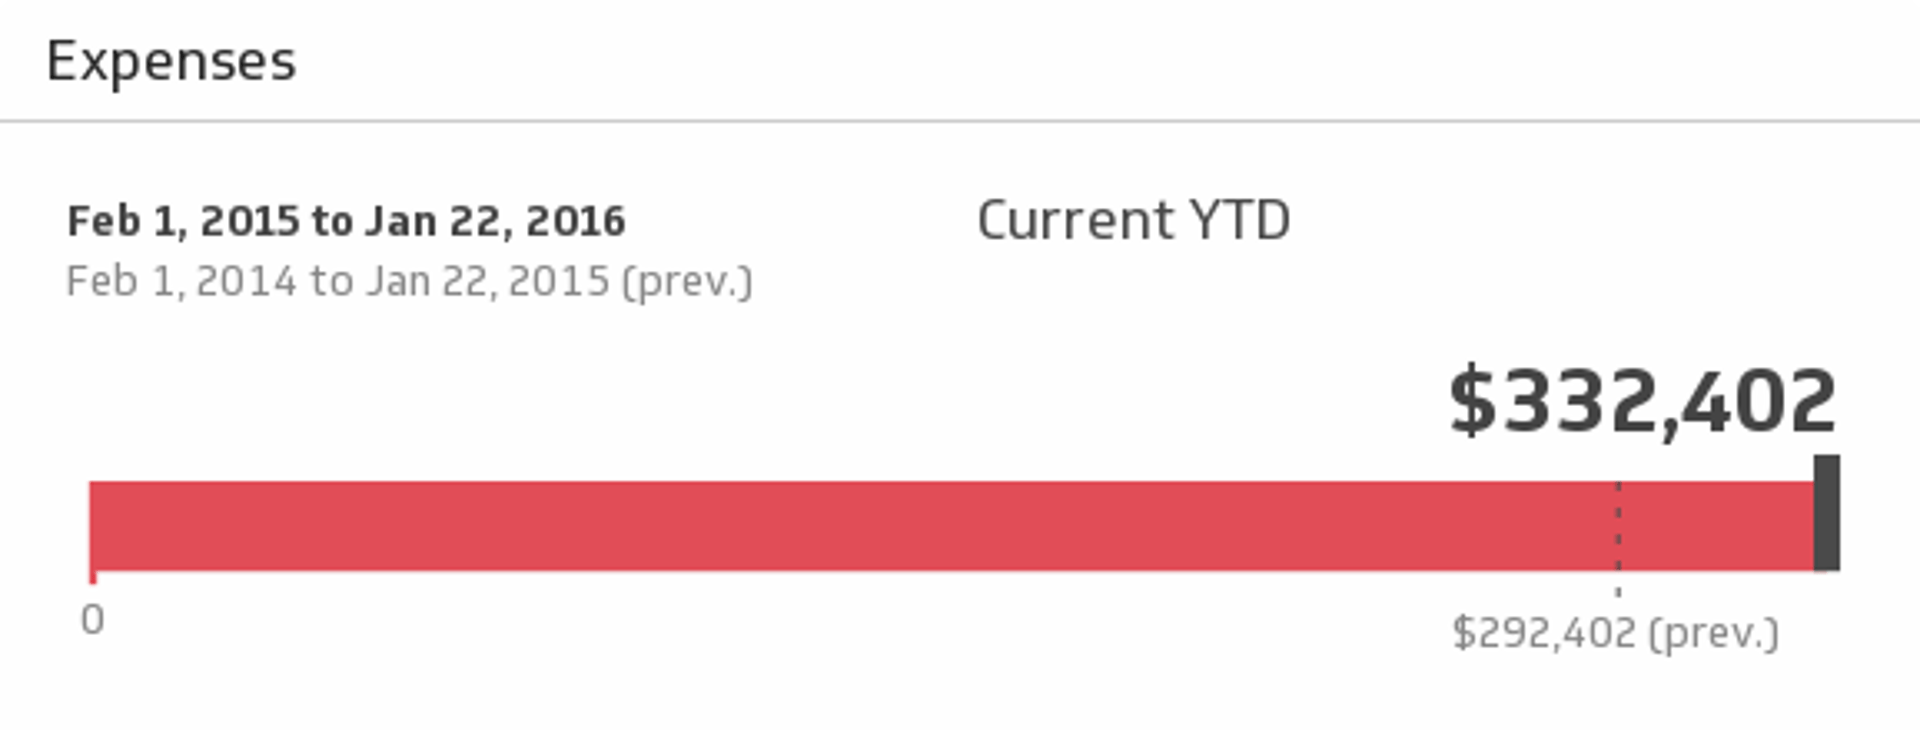
QuickBooks Expenses
You have to spend money to make money! Monitor your expenses for the time period of your choice and compare it to the previous period.
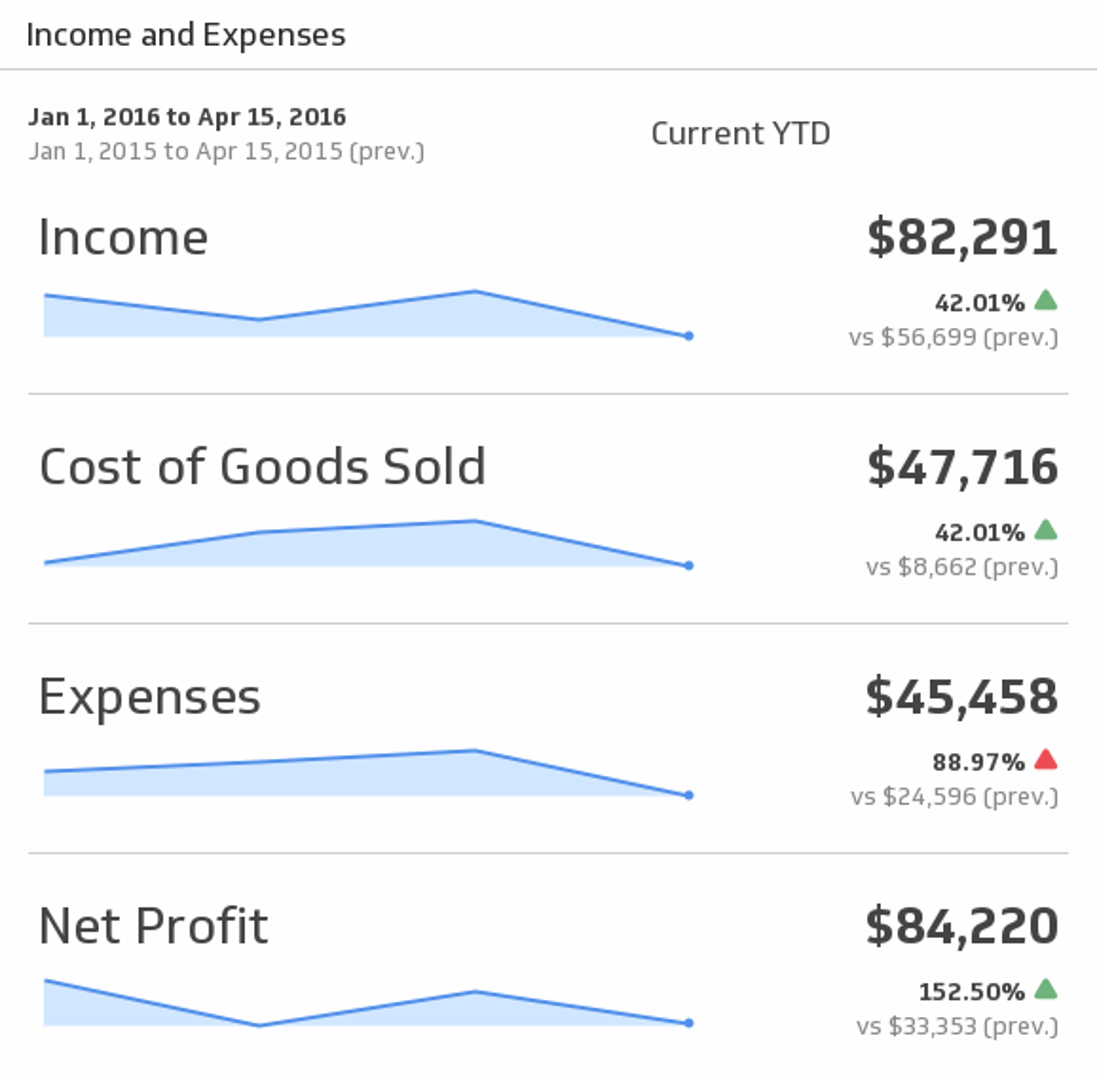
QuickBooks Income and Expenses
Bring your key accounting puzzle pieces - Income, Expenses, and Profit - together to help you make actionable decisions. Choose the time period of your choice from the drop-down menu, and compare to the previous period.
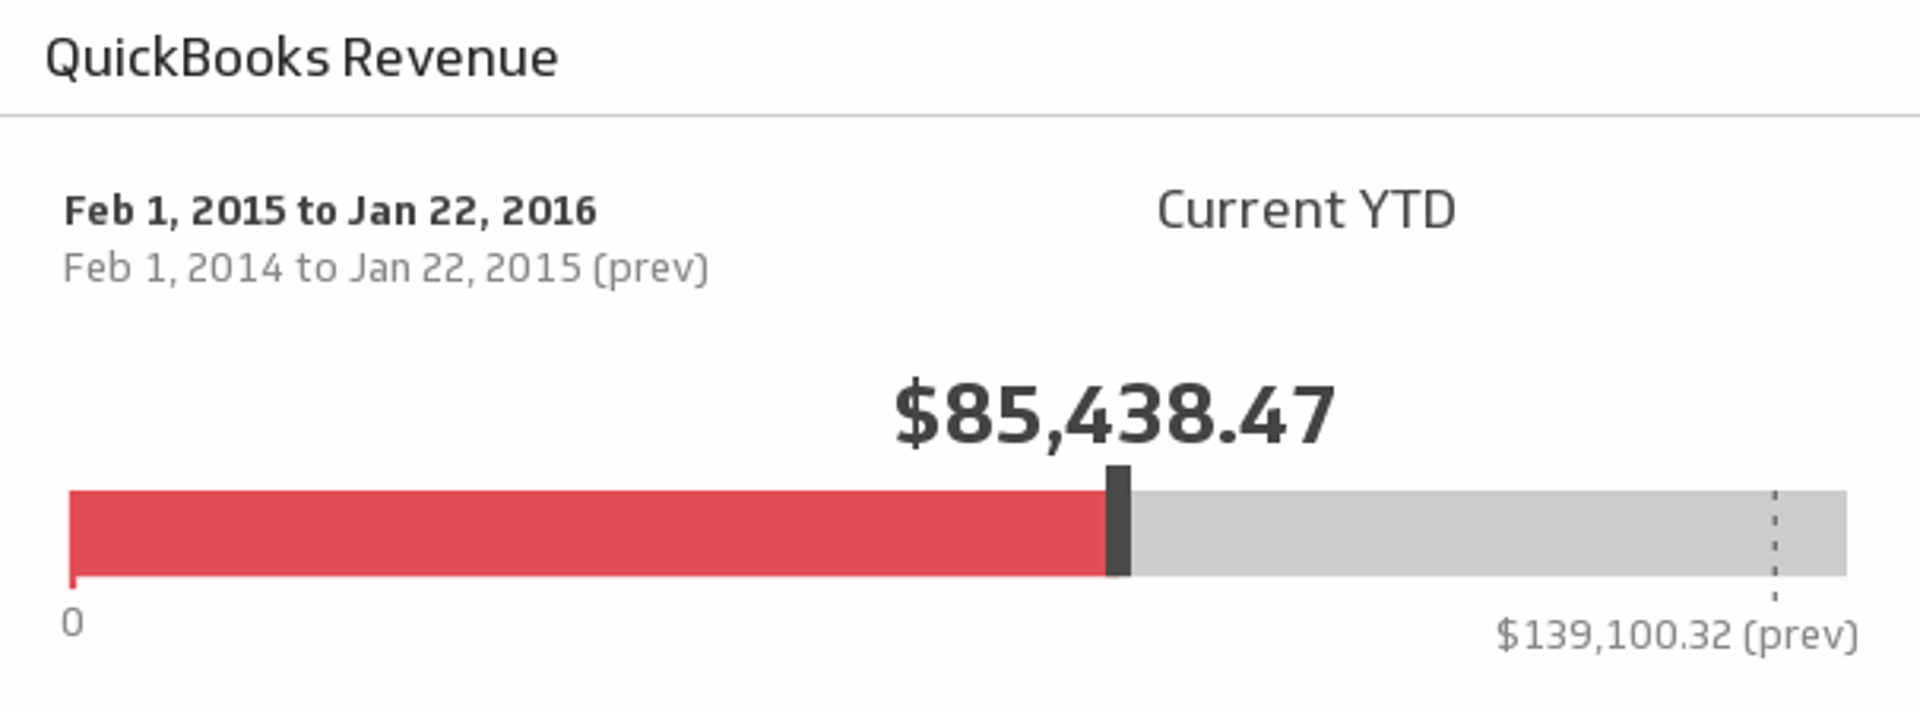
QuickBooks Revenue
Ensure the financial health of your business is in tip-top shape with this simple, real-time report on revenue for the time period of your choice.
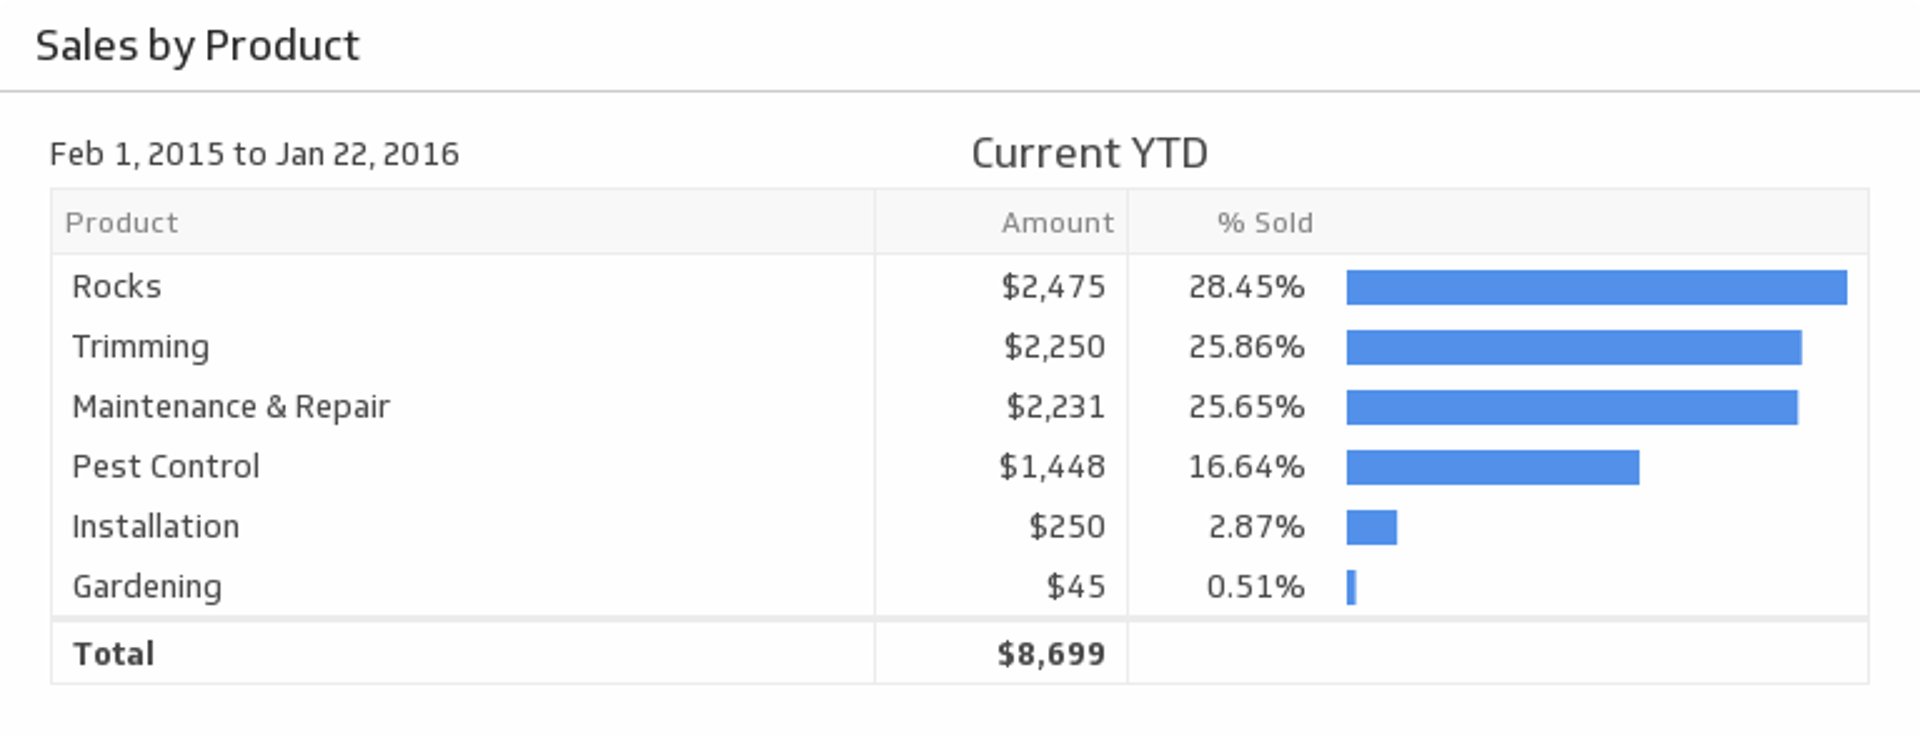
Sales by Product
Make sure your products are profitable by monitoring each of their sales metrics during the time period of your choice.

Marketing Expenses and Sales
Mash up your QuickBooks and Shopify data to see your Marketing Expenses and Sales for the last 30 days.
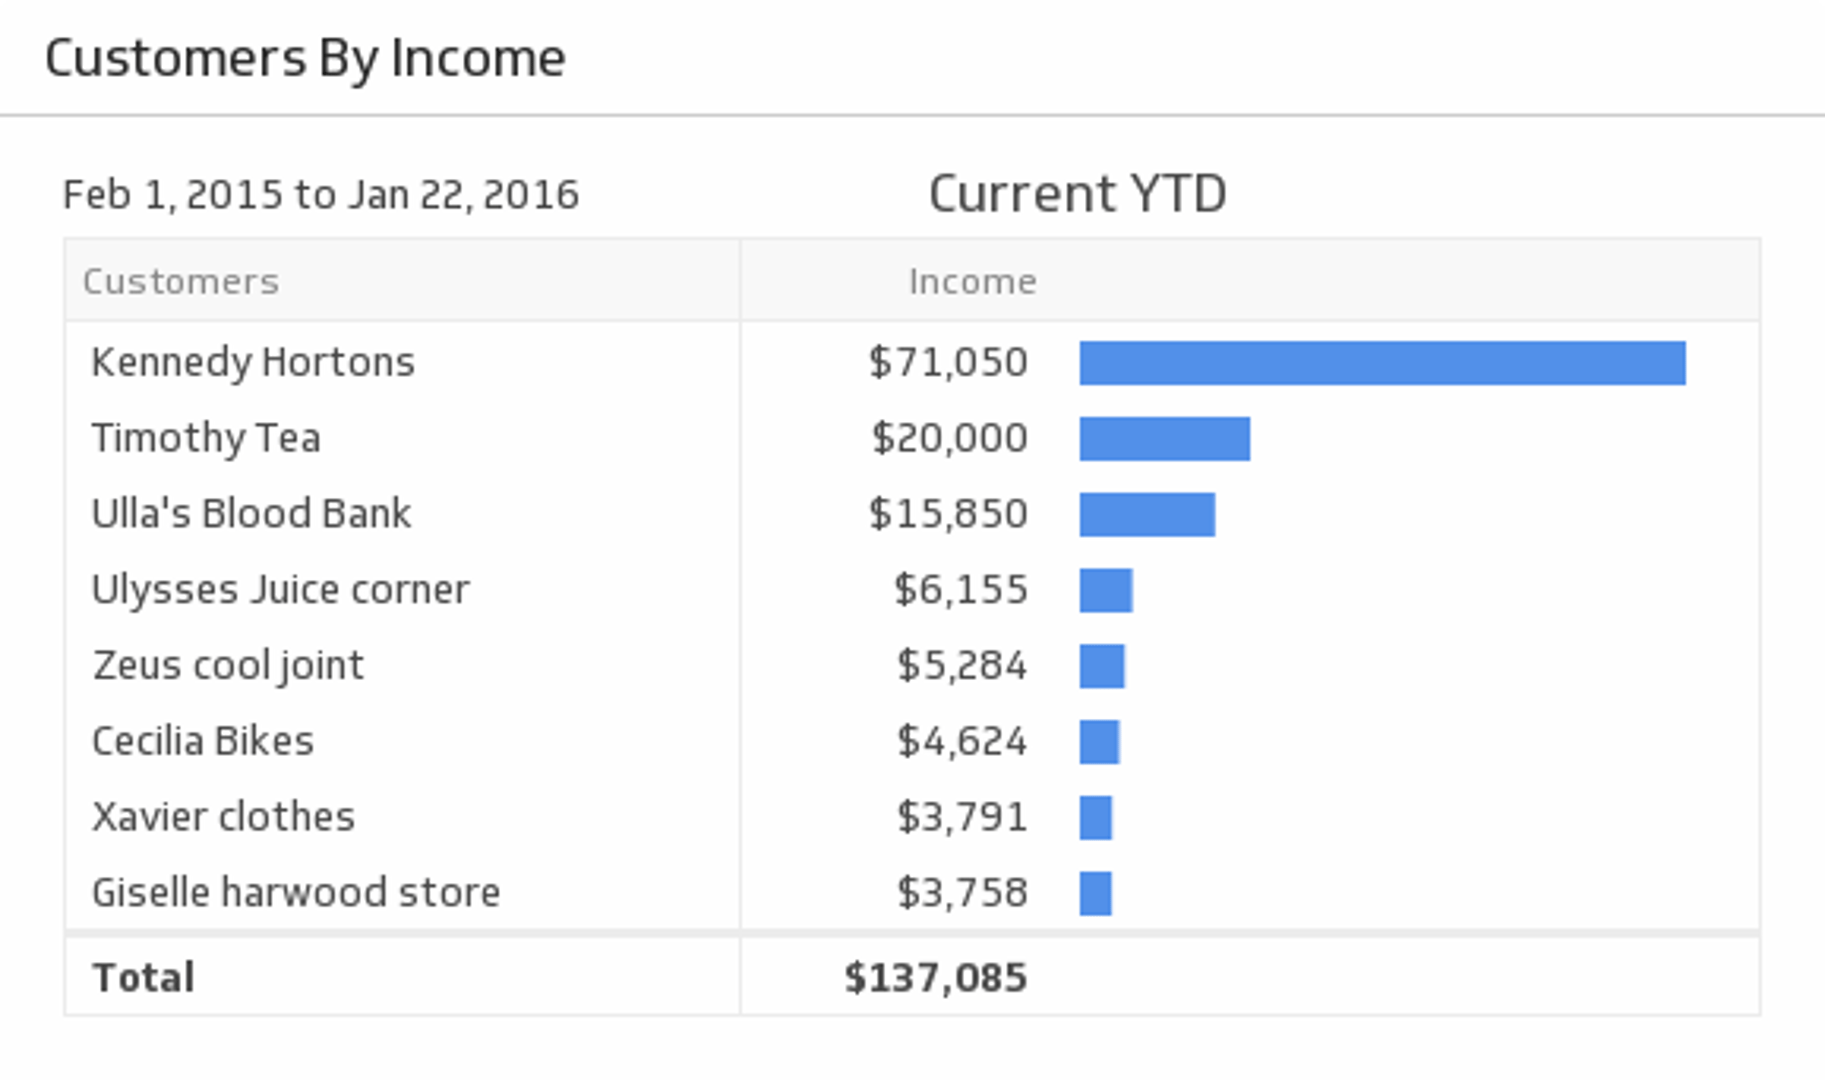
Top 10 Customers by Income
Gain a steady flow of profitable clients by monitoring your top 10 income-earning customers during the time period of your choice.
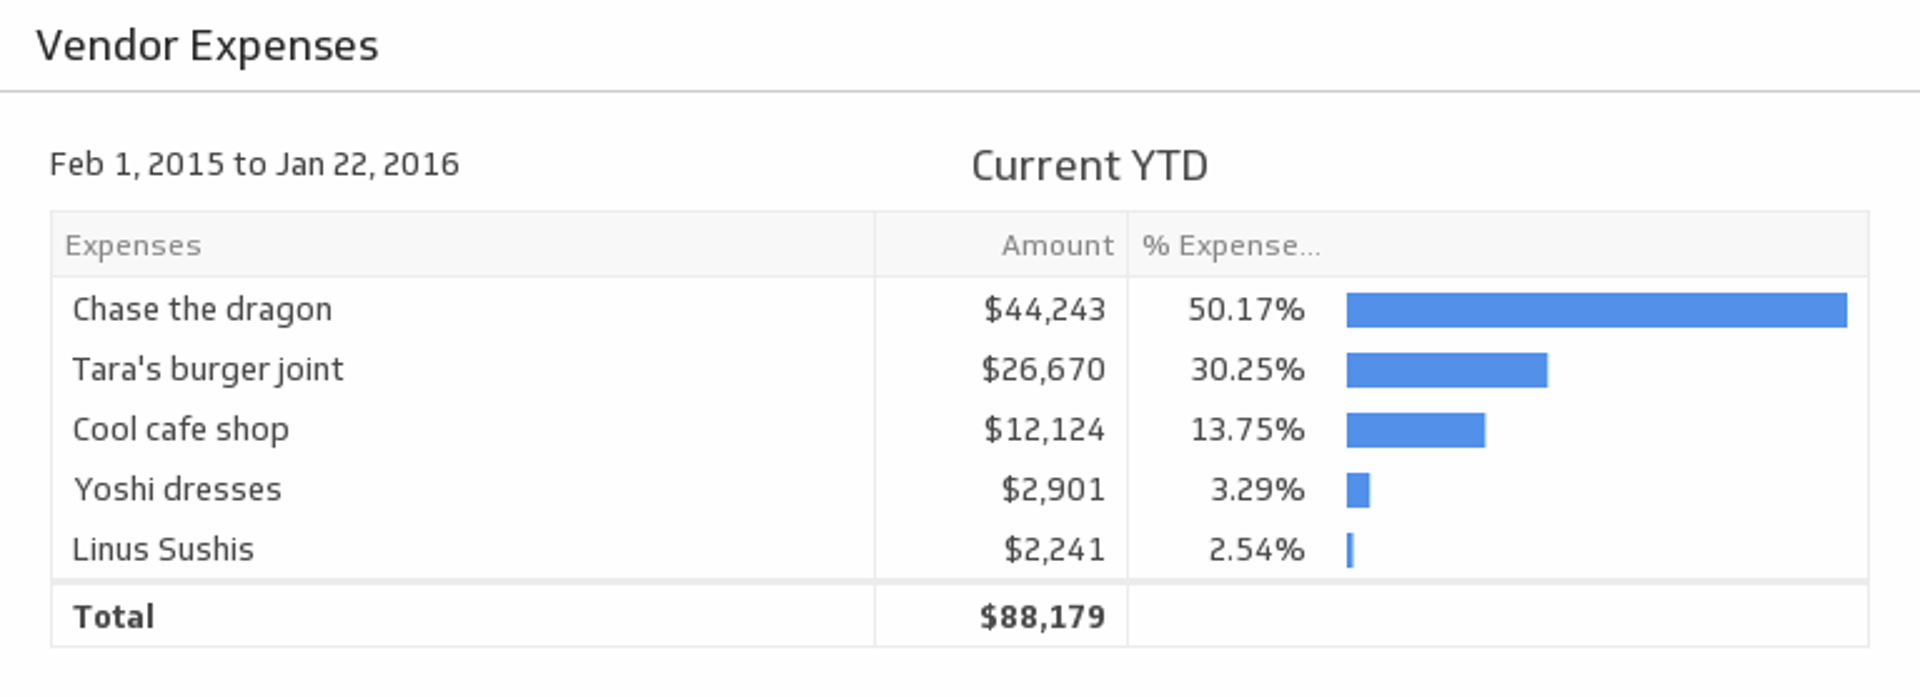
Vendor Expenses
Monitor your vendor expenses on an ongoing basis. Delve into individual vendor expenses and see the total for the time period of your choice.
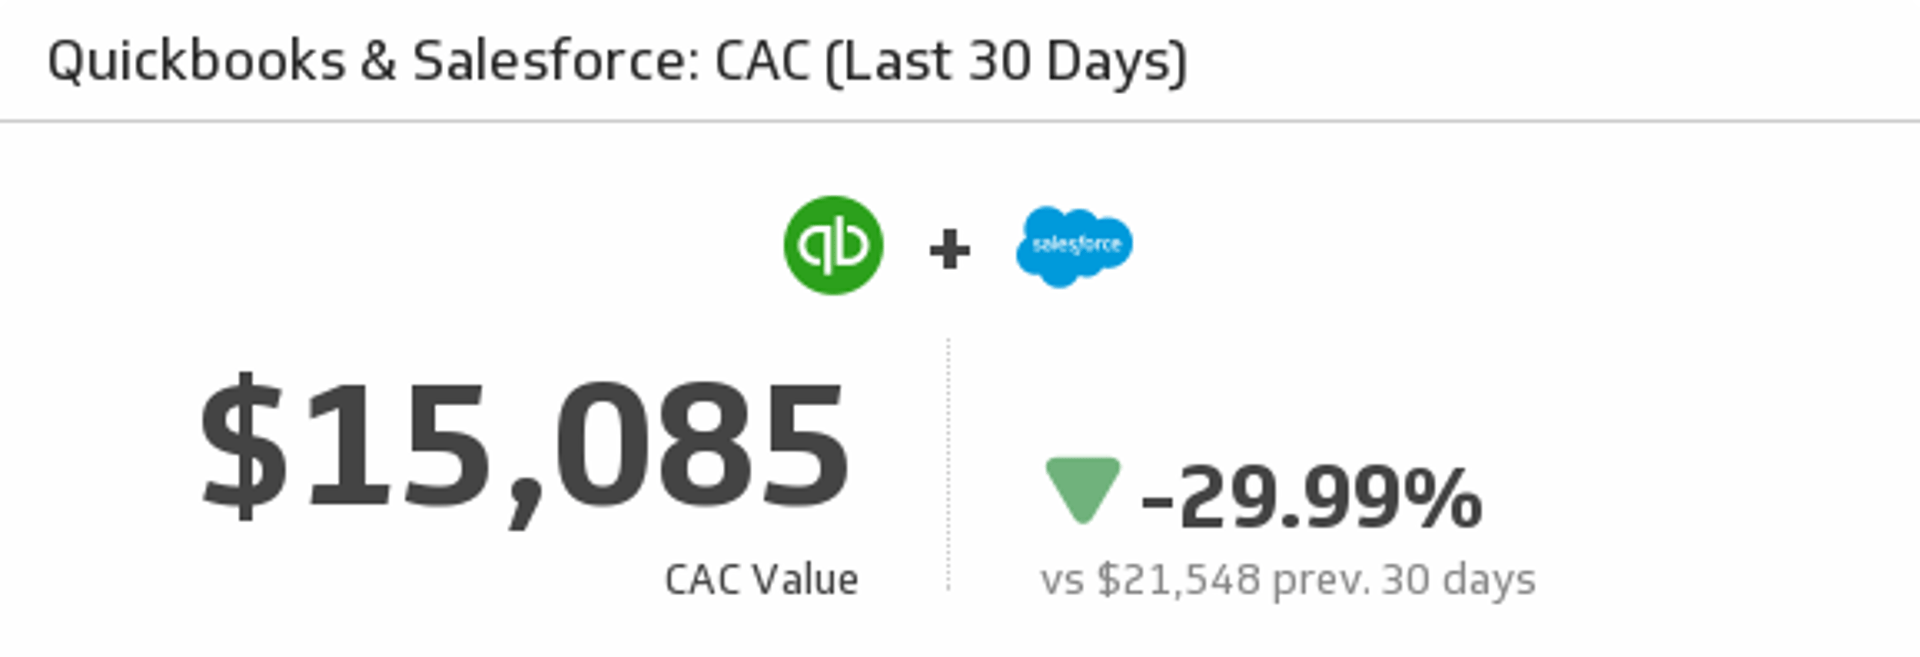
QuickBooks and Salesforce CAC (Last 30 Days)
Mash up your QuickBooks and Salesforce data to measure your Customer Acquisition Cost over the last 30 days.
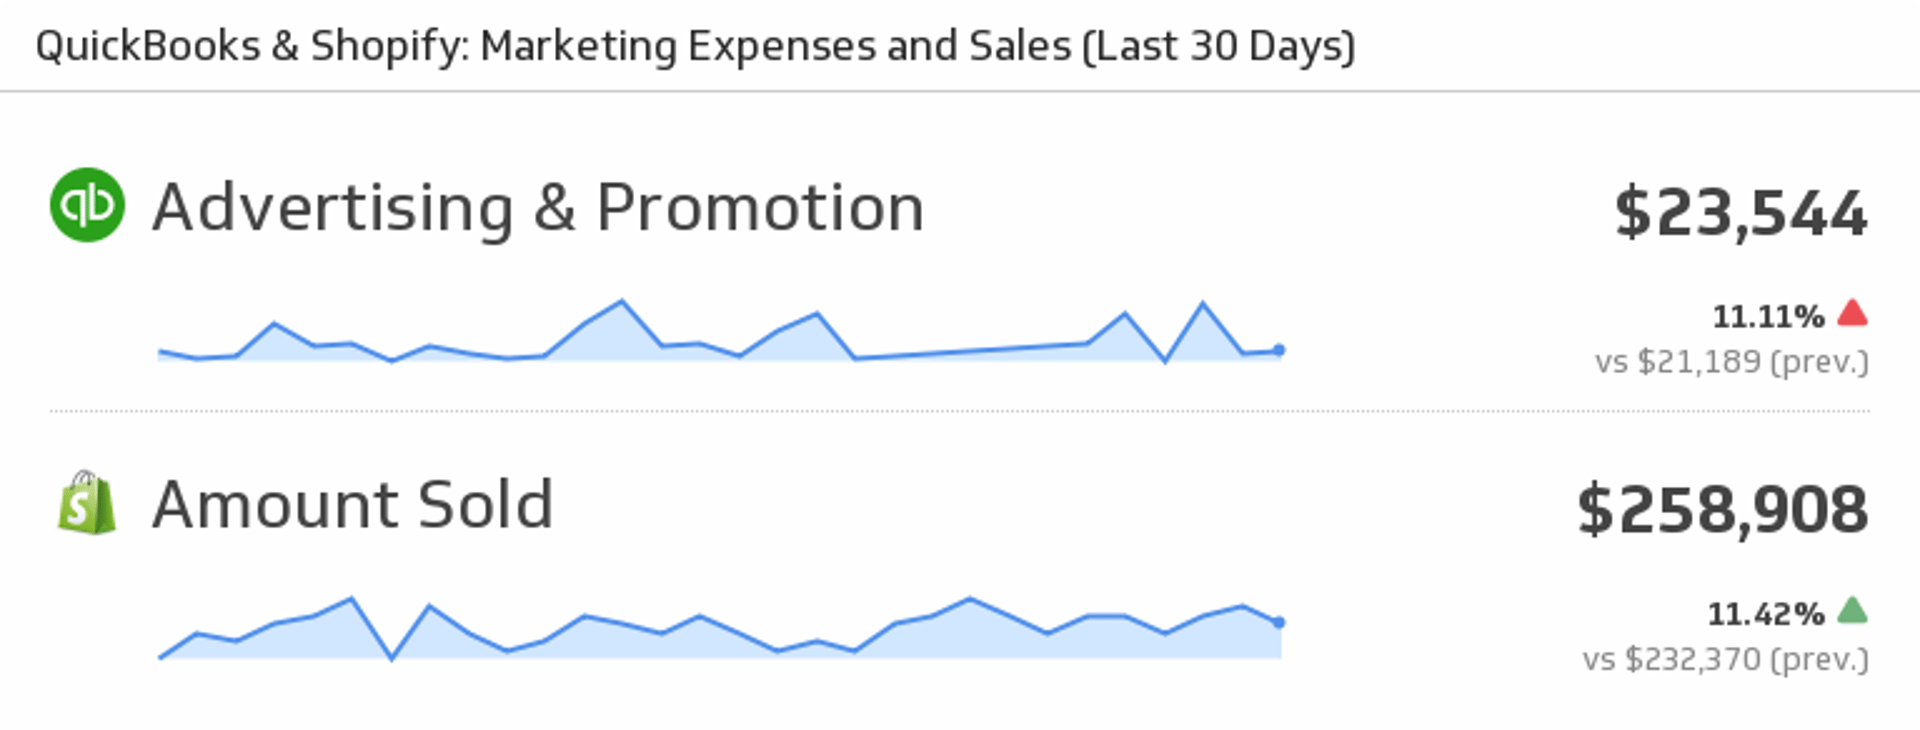
Shopify and QuickBooks Marketing Expenses and Sales
Mash up your QuickBooks and Shopify data to see your Marketing Expenses and Sales for the last 30 days.


Use the Connector Gallery to create a custom QuickBooks dashboard
With our Connector Gallery, you can create custom API queries to pull in data from your QuickBooks account. Building custom queries allows you to specify the metrics and time periods that you want to track.
You can use custom queries to build out visualizations in Klipfolio. You can also combine your QuickBooks data with other relevant data to create your custom dashboard.
Learn more about working with the QuickBooks API and how you can start building your own QuickBooks queries in Klipfolio.
