

6 QuickBooks metrics every growing business needs to track on their accounting dashboard
An accounting dashboard connects your QuickBooks data to a single, automatically updated view of revenue, expenses, profit, customer balances, and more. Instead of waiting for someone to pull a report, you see where your business stands right now and can act with confidence.
If you run a growing business, you already know the numbers matter. The harder question is which numbers, and whether you can trust them when it counts.
QuickBooks keeps your books in order. But raw accounting data sitting in a software tab is not the same as knowing where your business stands. An accounting dashboard pulls those numbers out of QuickBooks and puts them in front of you, updated automatically, without anyone having to pull a report or explain a spreadsheet.
QuickBooks small business accounting dashboard example
Most business owners make financial decisions on instinct. That works until it doesn't. When cash gets tight, a customer goes quiet, or a product line quietly stops pulling its weight, gut feel is the last thing you want to rely on.
Connect your QuickBooks data to a financial dashboard and you stop guessing. Revenue, expenses, profit, customer balances, and sales by product are all visible in one place, current as of your last data refresh. You see the full picture without waiting for someone to compile it.
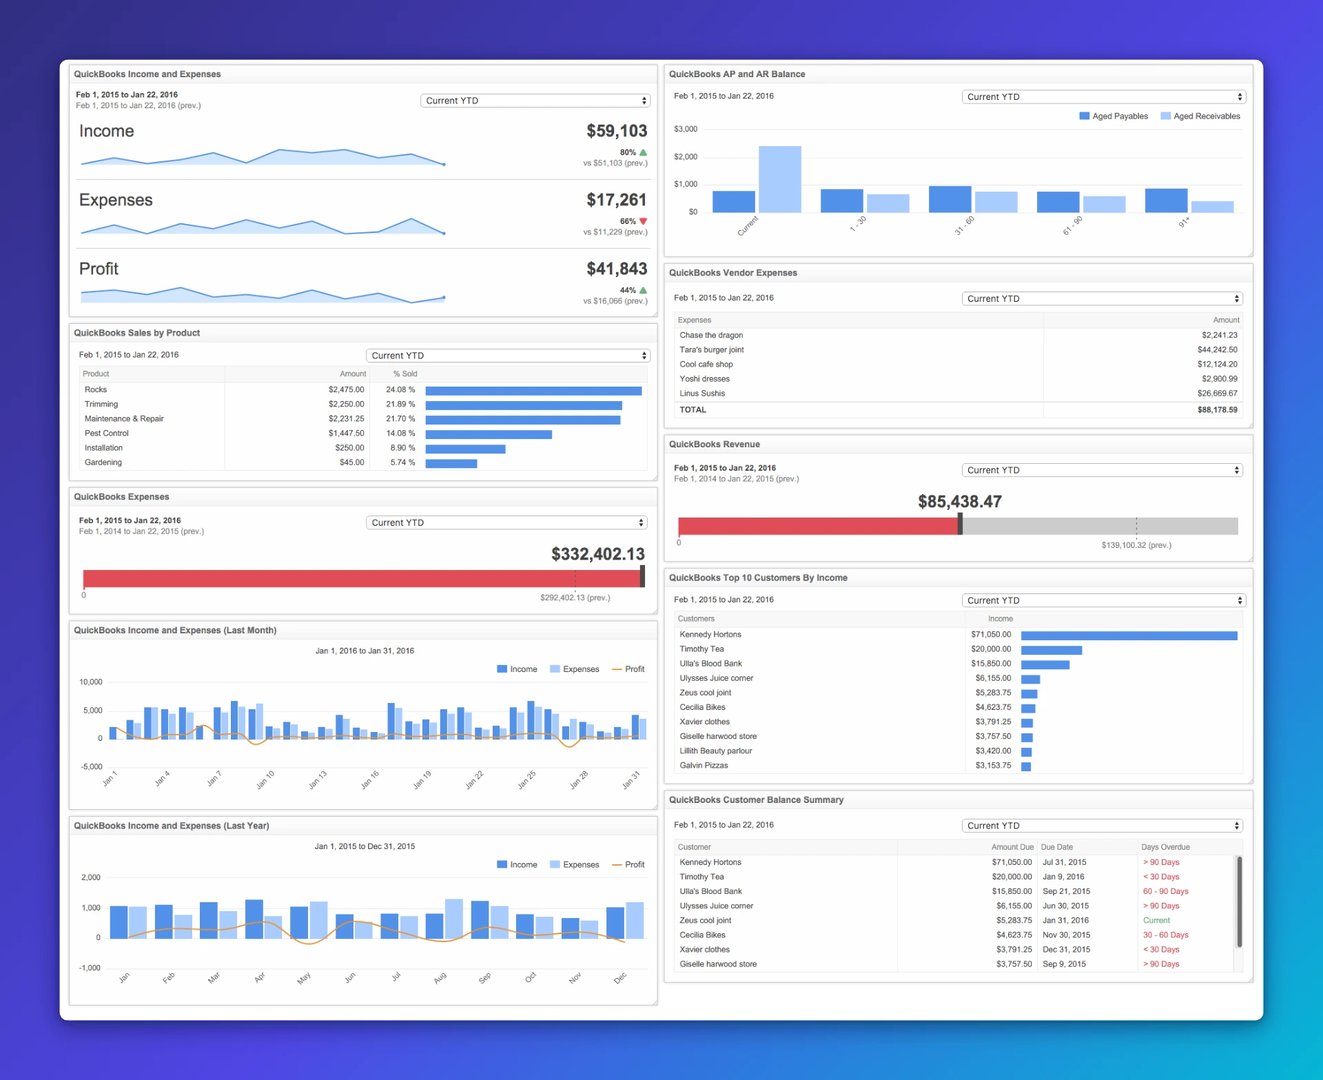
6 QuickBooks metrics to track on your accounting dashboard
Define your organization's KPIs before you build anything. Then use pre-built Klips to connect QuickBooks directly to your dashboard. Each metric below is ready to add in one click.
Sales by product
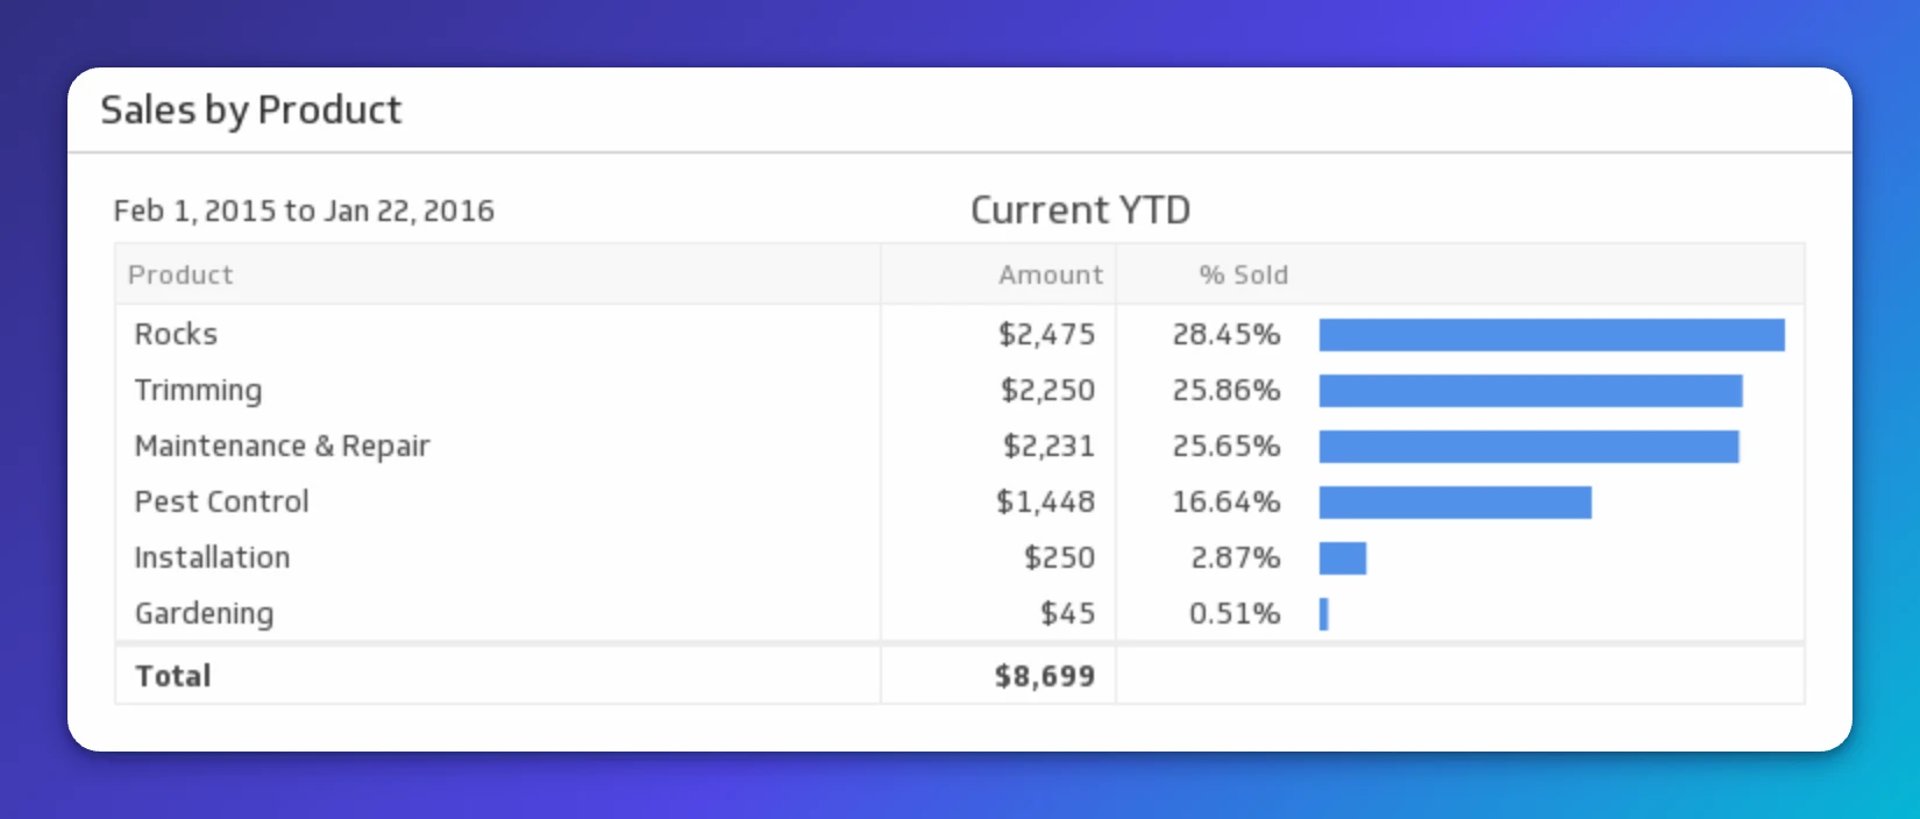
Not every product earns its keep. This Klip ranks your products by sales so you can see what's driving revenue and what's dragging on margins. If one line is quietly underperforming, you'll know before it becomes a problem.
Income and expenses
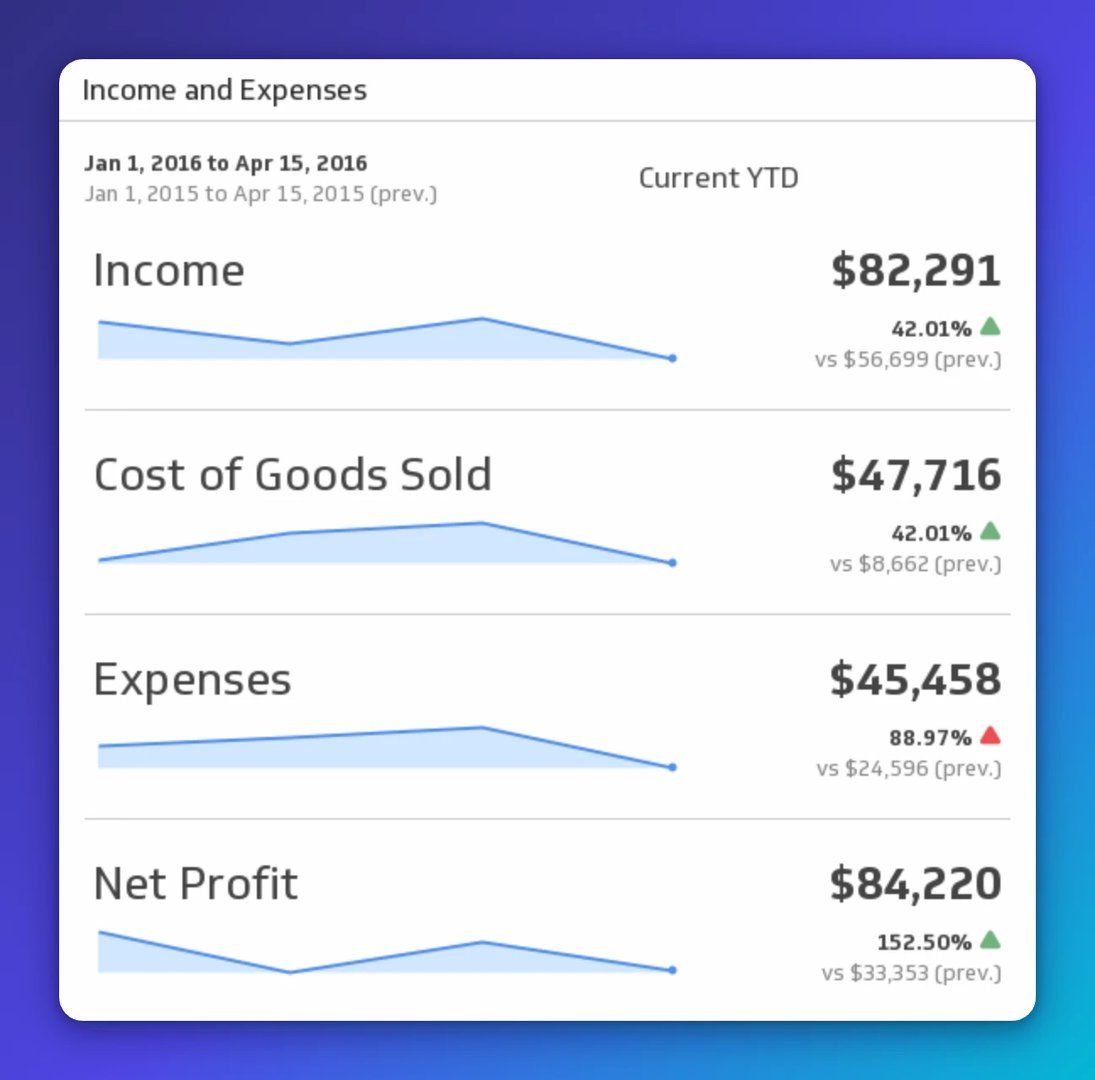
Income, expenses, and profit in one view, with period-over-period comparison built in. Select any time range from the drop-down and see immediately whether your margins are holding or shifting. This is the Klip that tells you whether the business is healthy right now, not just at year-end.
Revenue
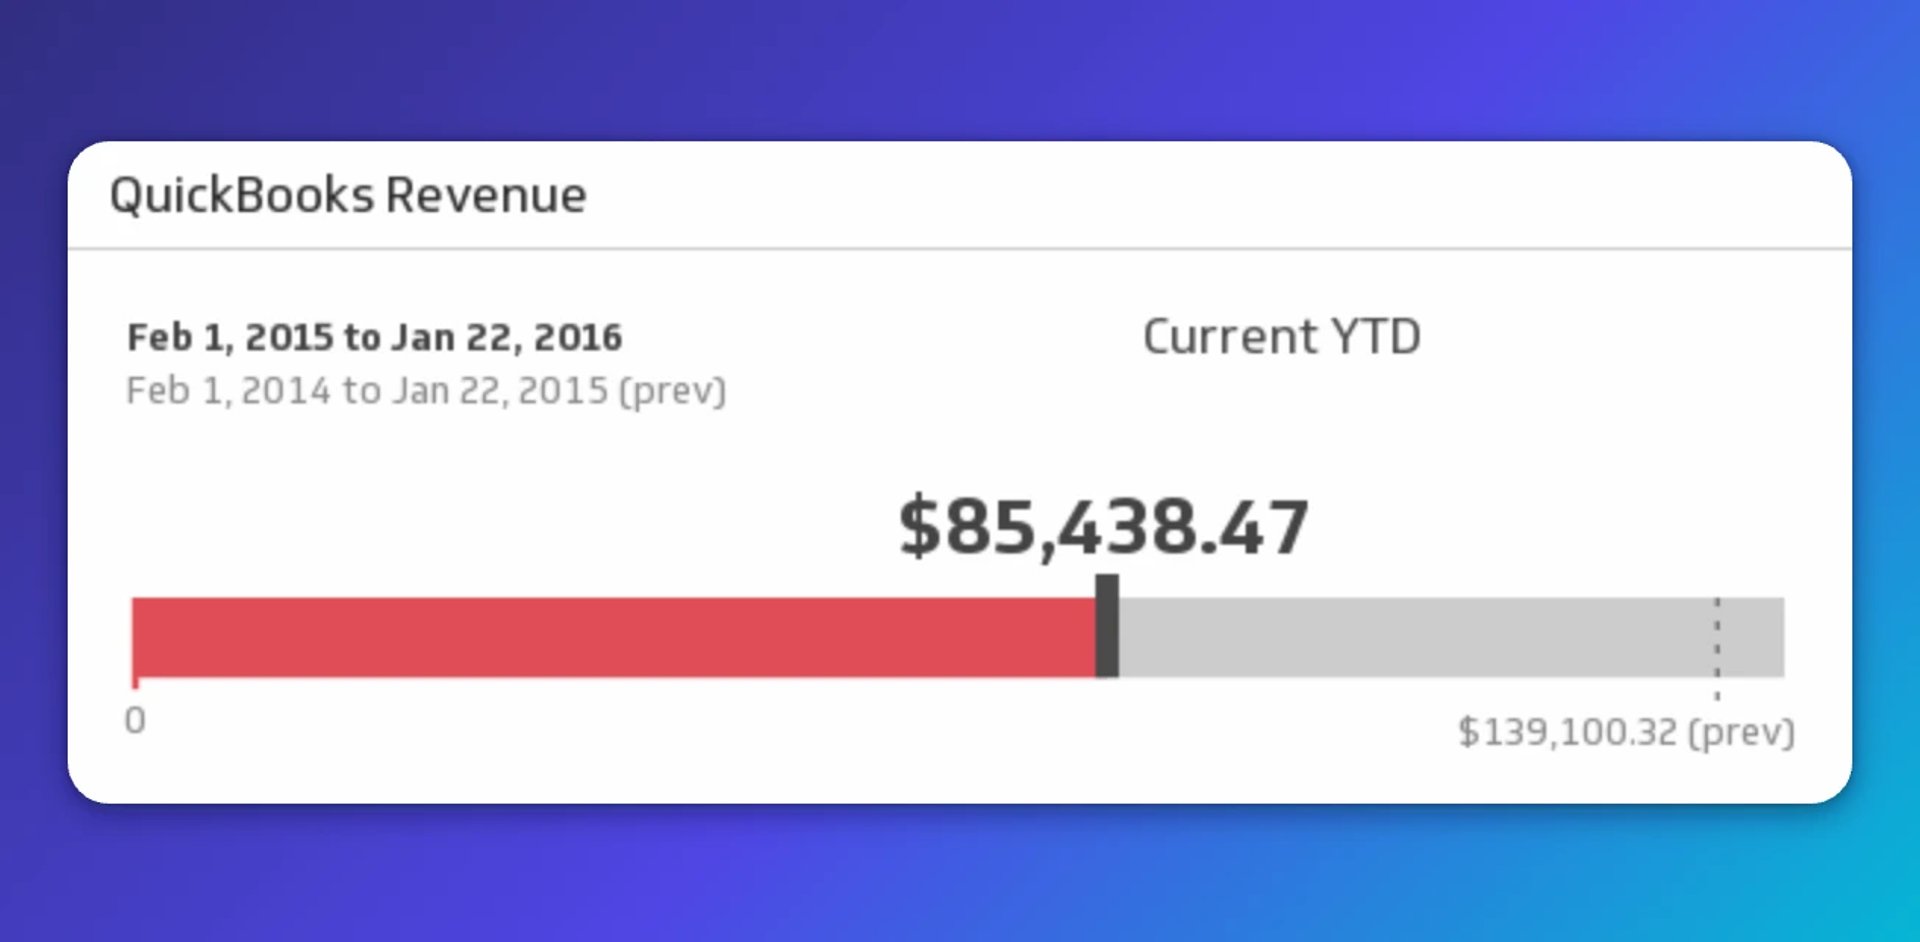
A clean, real-time revenue number for any period you choose. Simple by design. If someone asks how the business is doing, this is the number you point to with confidence.
Customer balance summary
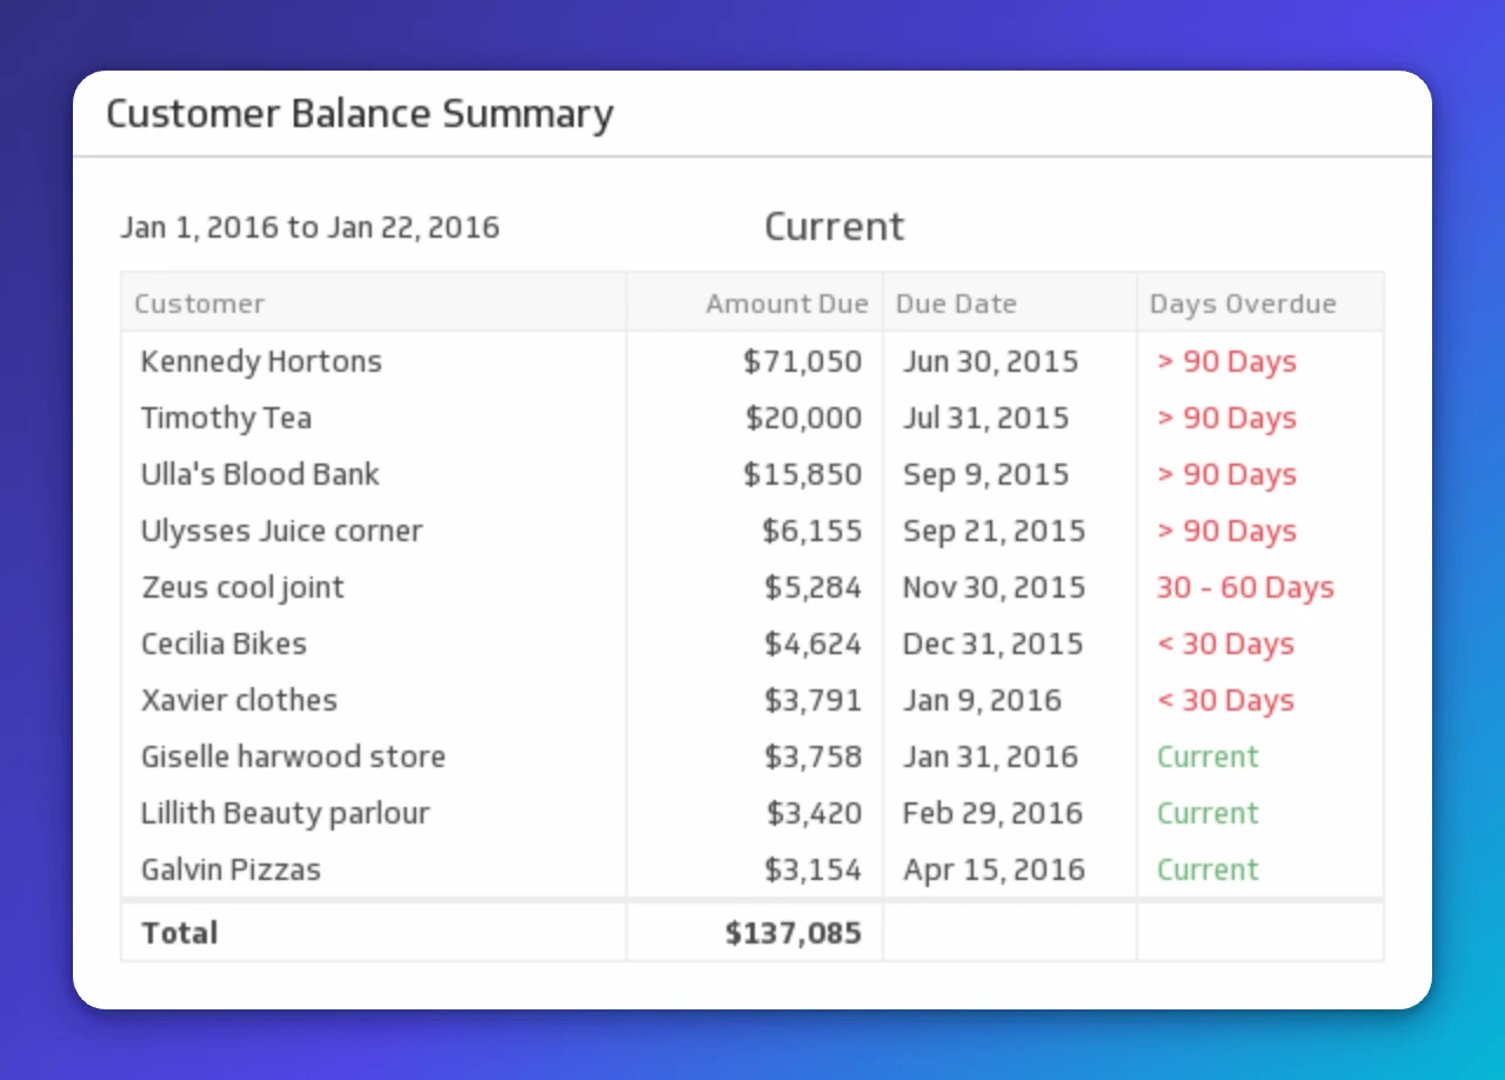
Cash flow is what keeps the doors open. This table shows which customers are current (green) and which are overdue (red), so you can act on collections before a gap becomes a crisis. You should not have to dig through invoices to know who owes you money.
Top 10 customers by income
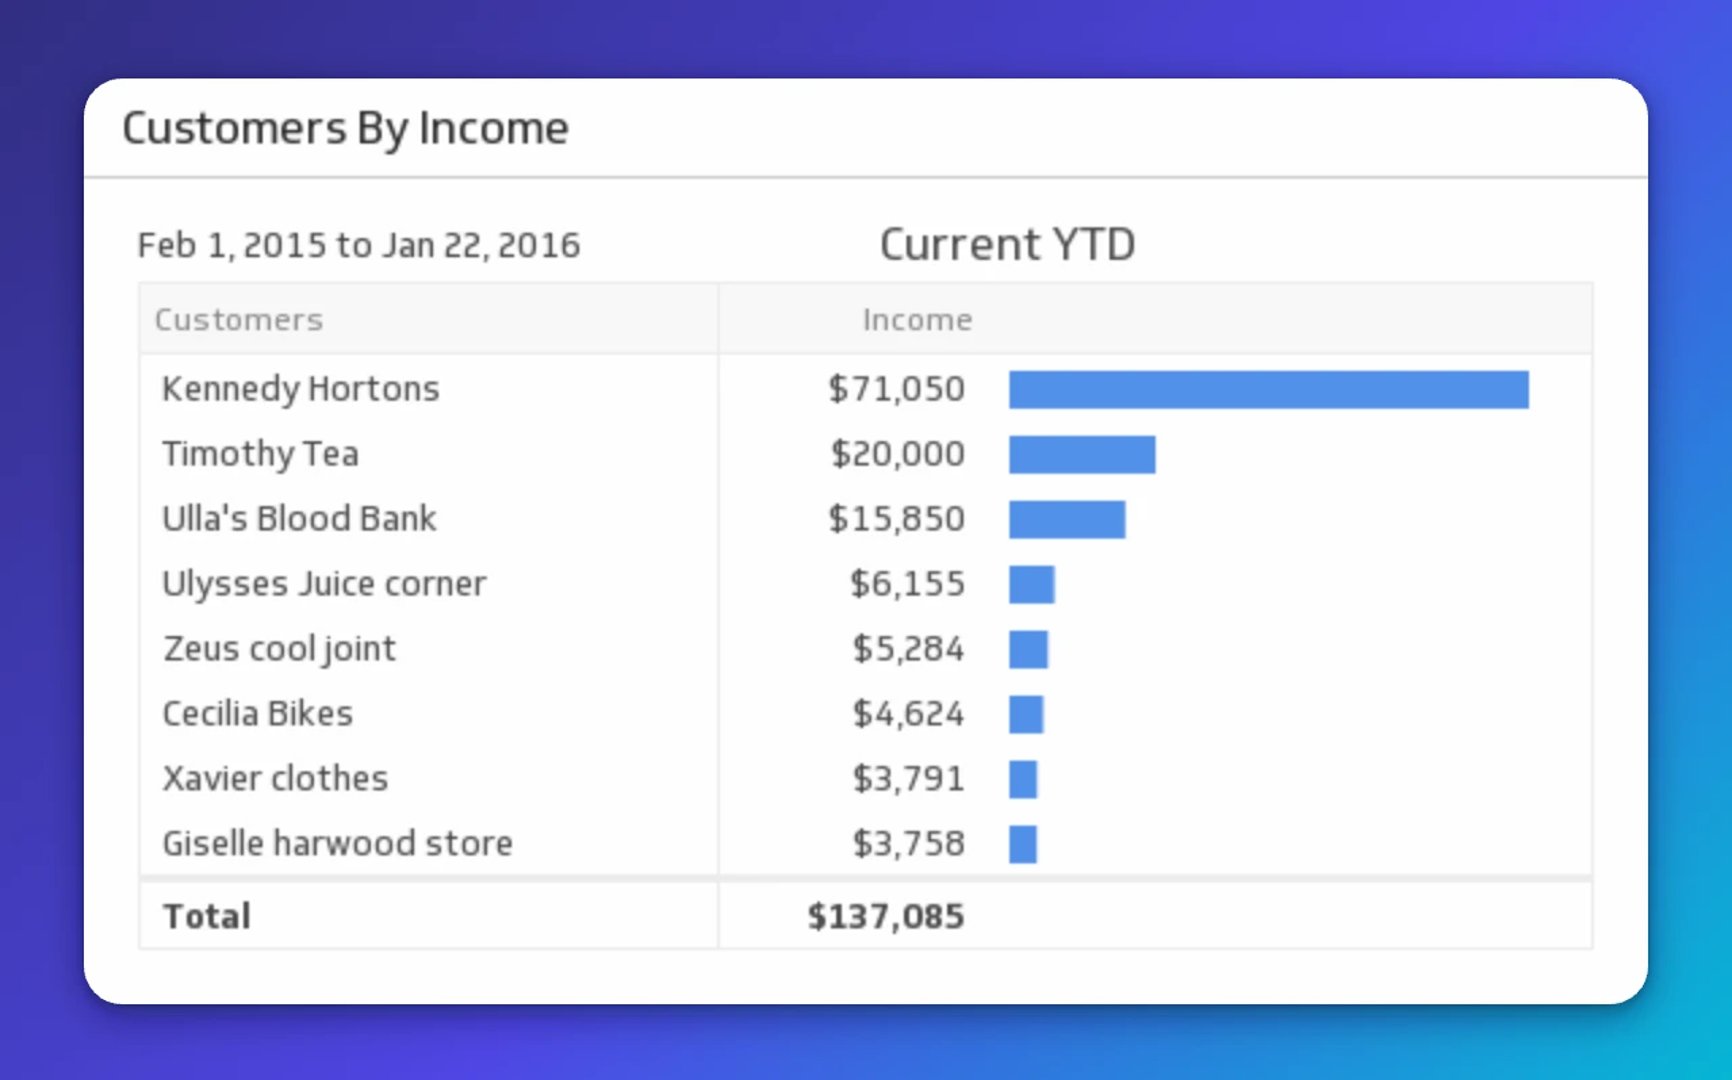
Know which clients drive the most revenue and how that changes over time. If a top customer starts pulling back, you want to see it in the numbers before you feel it in the bank account.
Vendor expenses
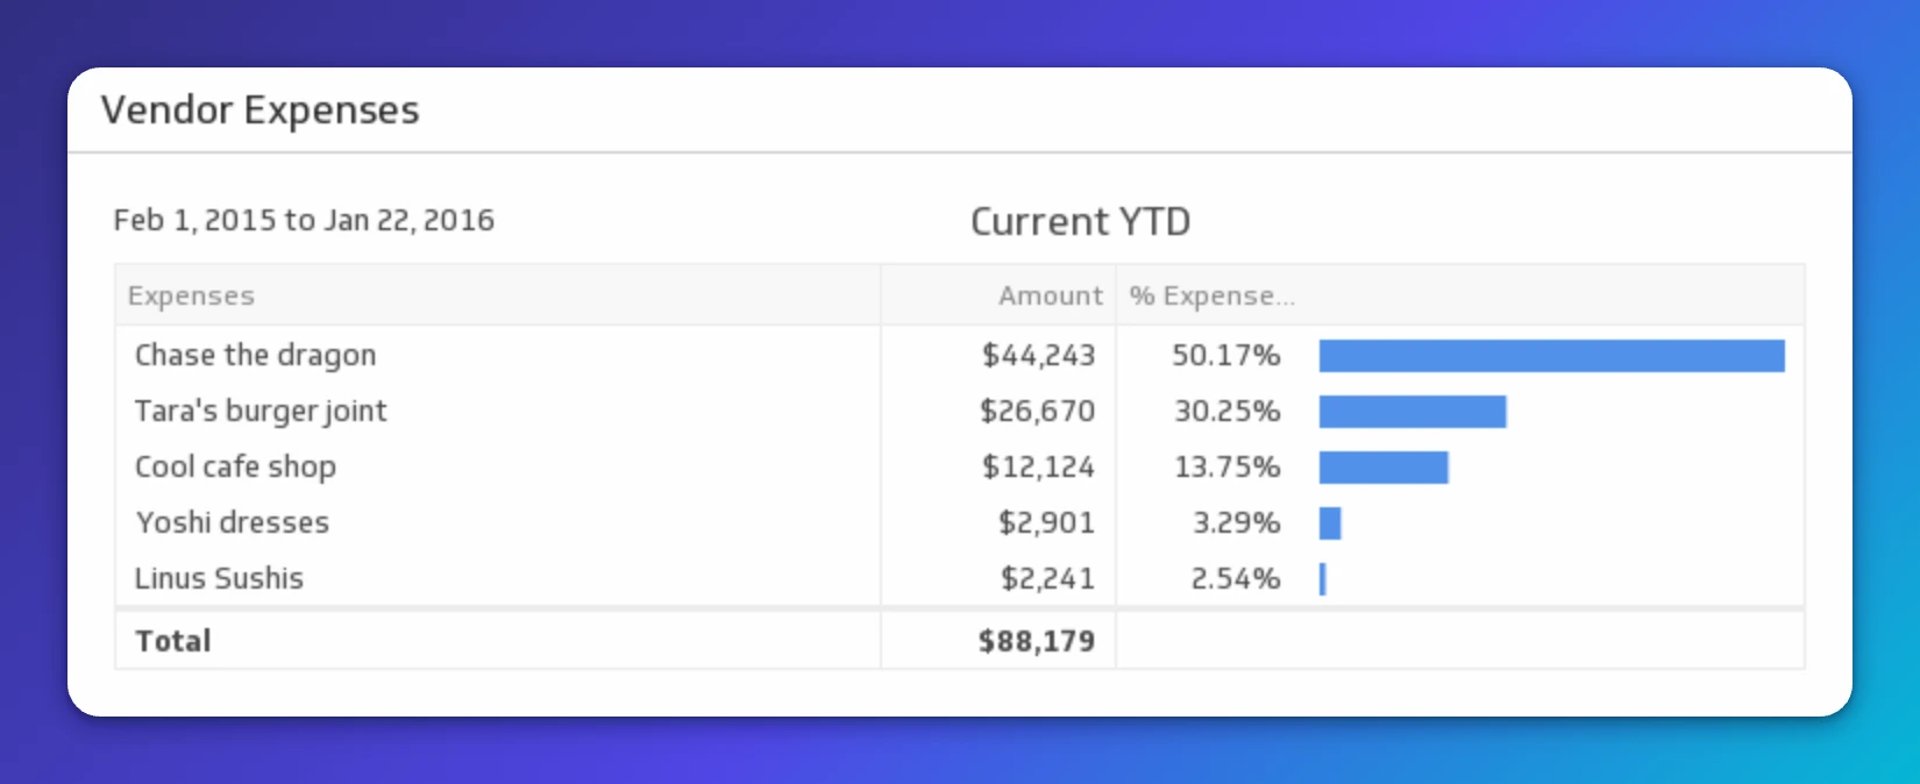
See what you're spending by vendor, broken down and totalled. Concentration risk is easy to miss when expenses are spread across invoices. This view makes it visible so you can make better sourcing and negotiation decisions.
Create custom dashboards for you and your team.
Get started with KlipsMore than just QuickBooks
Klipfolio connects to 130+ data sources, including the financial and business tools your team already uses. If your numbers live in more than one place, your dashboard can bring them together. Visit the Integrations Page to see what's available.
Updated 2026-09-02
More in Accounting & Finance
3 key financial reports to understand as your business grows

Best budgeting and accounting software list

Become a better CFO with these three metrics
SMB dashboarding in 2026: Trends shaping reporting

How to build an accounts receivable dashboard that improves business performance

22 expert-informed metrics for SaaS heads of finance
Most recent
- SEP 25What SOC 2 taught a small team about trust
- SEP 15The AI race: progress, humanity, and trust
- SEP 9The good advisor
- AUG 11Beyond simple sign-ups: how True Trials and Activation predict growth
- JUL 7Why business leaders miss important trends in their dashboards
- JUN 19The best chart for the job: Visualizing data for non-technical users