Payroll to Revenue Ratio
A financial metric that expresses total payroll expenses as a percentage of revenue, helping leaders assess whether labour costs are aligned with business output.
Track all your Financial KPIs in one place
Sign up for free and start making decisions for your business with confidence.
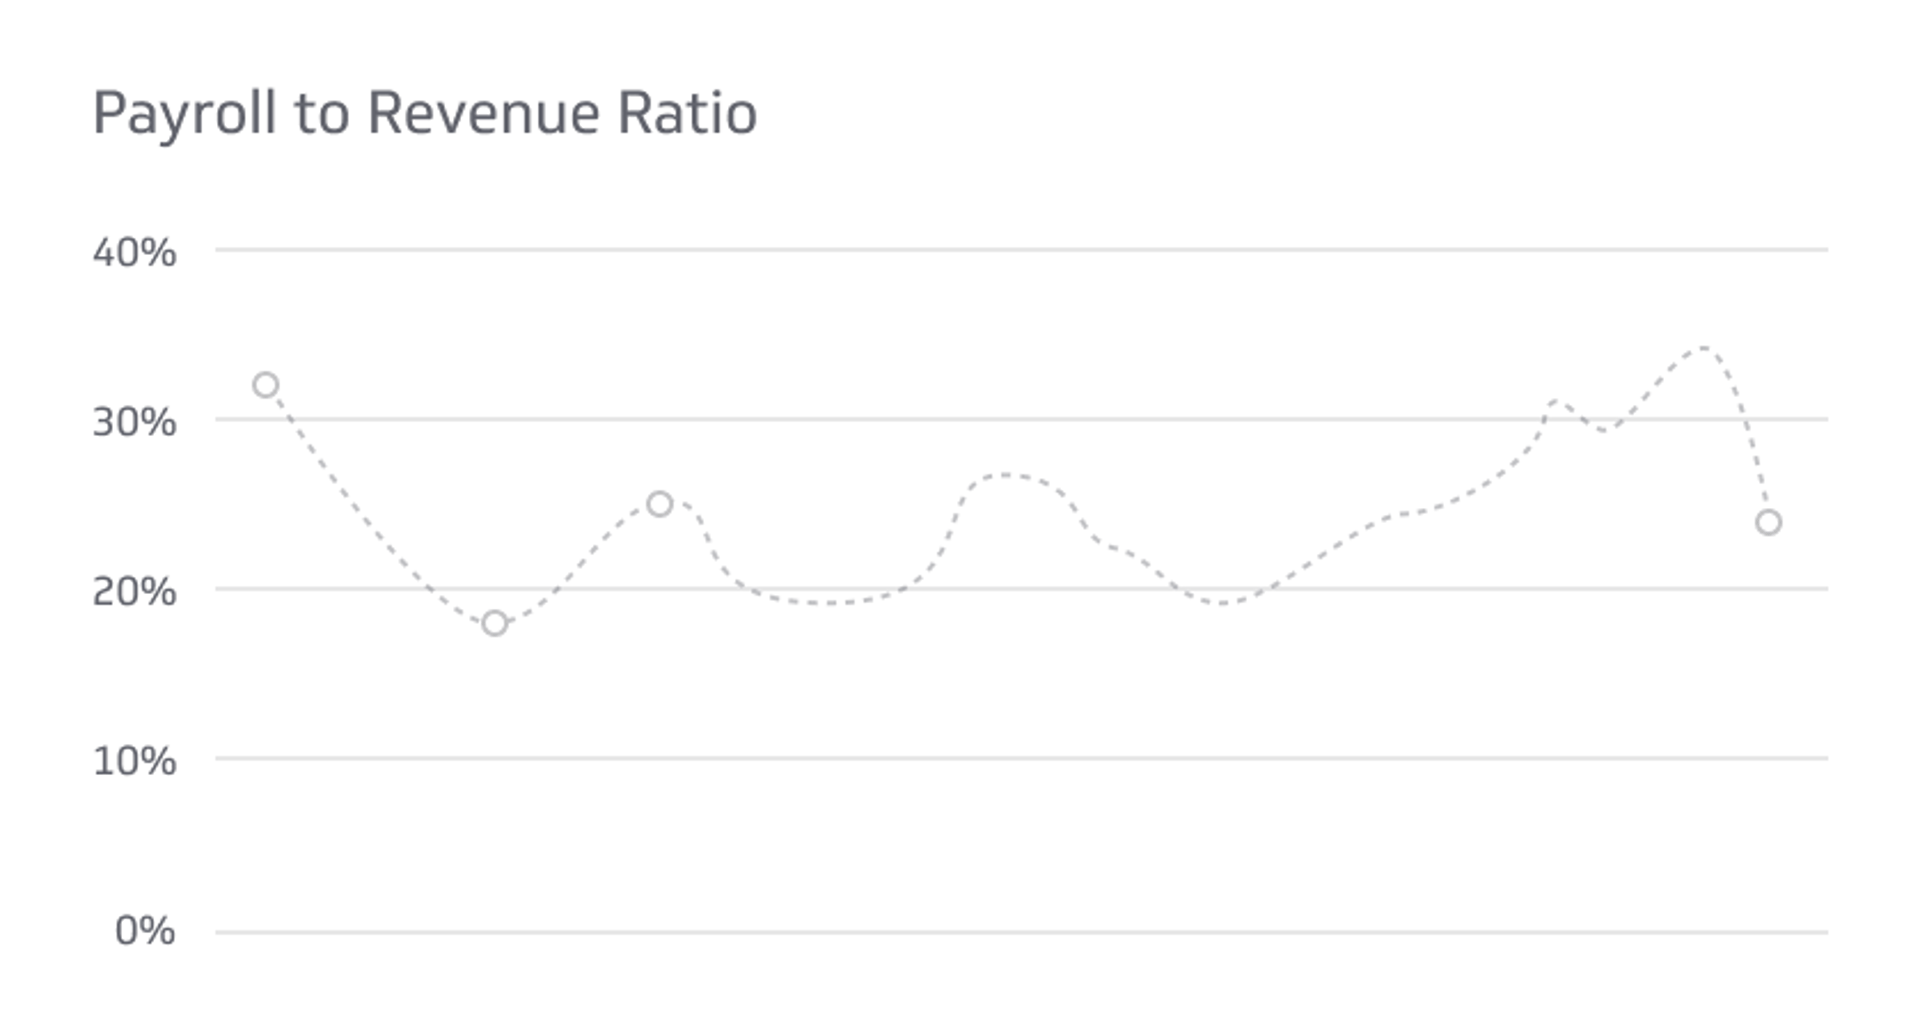
The Payroll to Revenue Ratio measures the share of a company's revenue spent on employee wages and benefits.
Leaders use this ratio to understand whether labour costs are aligned with business output, and to decide where to adjust before profitability takes a hit.
What is the Payroll to Revenue Ratio?
The Payroll to Revenue Ratio is a financial metric that expresses total payroll expenses as a percentage of total revenue over a given period. It tells you how much of every dollar earned goes to compensating your workforce.
The ratio varies by industry, company size, and business model, so context matters when interpreting it.
How to calculate the Payroll to Revenue Ratio
Divide total payroll expenses by total revenue, then multiply by 100:
Payroll to Revenue Ratio = (Total Payroll Expenses / Total Revenue) × 100
Example: If annual payroll expenses are $1,000,000 and total revenue is $5,000,000:
($1,000,000 / $5,000,000) × 100 = 20%
Twenty cents of every dollar earned goes to payroll.
What data do you need?
To calculate this ratio accurately, pull together the following records:
- Payroll records: Employee wages, salaries, bonuses, commissions, benefits, and all other compensation. This includes individual records and summaries of total payroll expenses.
- Revenue records: All sources of income, including sales invoices, service fees, and other operating revenues captured in your financial statements.
- Payroll tax reports: Filed payroll tax documents (such as Form 941 in the United States) that verify the accuracy of reported payroll expenses.
- Employee contracts and agreements: Offer letters and compensation agreements confirming salary, benefits, and commission structures.
- Benefits and deduction records: Health insurance, retirement contributions, and other payroll deductions that form part of total payroll expenses.
- Timekeeping records: Hours worked, overtime, and attendance data that feed into payroll calculations.
- General ledger and financial statements: Income statement and balance sheet entries that validate both payroll and revenue figures.
Confirm documentation requirements with your finance or accounting team, particularly if you operate across multiple jurisdictions.
What the ratio tells you
Labour cost efficiency
A lower ratio means less of your revenue is consumed by payroll, which generally points to tighter cost control and stronger margins. A higher ratio signals that labour is a significant cost driver, which warrants closer attention.
Labour intensity by industry
Some businesses are inherently labour-intensive. Healthcare, hospitality, and professional services tend to carry higher ratios because human effort is central to delivering value. Technology and manufacturing businesses with high automation often run lower. Comparing your ratio to industry peers gives you a meaningful baseline.
Profitability impact
Every percentage point of the ratio represents a direct claim on revenue. If the ratio climbs without a corresponding increase in output or revenue, margins compress. Tracking this over time helps you catch the drift before it becomes a problem.
Cost management signals
A rising ratio can mean payroll is growing faster than revenue, or that revenue has softened. A declining ratio can reflect successful cost management or strong revenue growth. Either way, the trend matters as much as the number itself.
What ratio should businesses aim for?
There is no universal benchmark, but a commonly cited range is 15–30% of total revenue. Where your business should sit within that range depends on your industry, growth stage, and operating model.
A high ratio, above 30%, means labour costs are consuming a substantial share of company's earnings, which can limit investment in other areas. A low ratio indicates the company retains more revenue after covering labour, but an unusually low number may also signal underinvestment in people.
Use the range as a prompt for conversation, not a hard pass/fail threshold.
Frequently asked questions
What percentage of payroll should a company have?
Most guidance points to a ceiling around 30% of revenue, though the right number depends on industry norms and business model. Labour-intensive businesses may operate above this range by design.
What is the payroll ratio to employees?
The payroll ratio to employees is the average labour cost per person. Divide total payroll expenses by the number of employees. This gives a useful view of workforce cost at the individual level.
What is the employee vs. revenue ratio?
The revenue per employee ratio is the inverse perspective: it measures how much revenue each employee generates. Where the Payroll to Revenue Ratio tracks cost, Revenue per Employee tracks productivity.
Tracking the Payroll to Revenue Ratio
Calculating this ratio once is useful. Tracking it over time is where the real value shows up. When your numbers are connected to a live financial dashboard, you can spot a rising ratio before it erodes margin, and act with confidence rather than scrambling to reconstruct a spreadsheet.
Klipfolio connects to your payroll and financial data sources so the ratio updates automatically. You stay focused on the decision, not the data pull. Explore financial metrics and KPIs to see what else belongs on your finance dashboard.
Related Metrics & KPIs