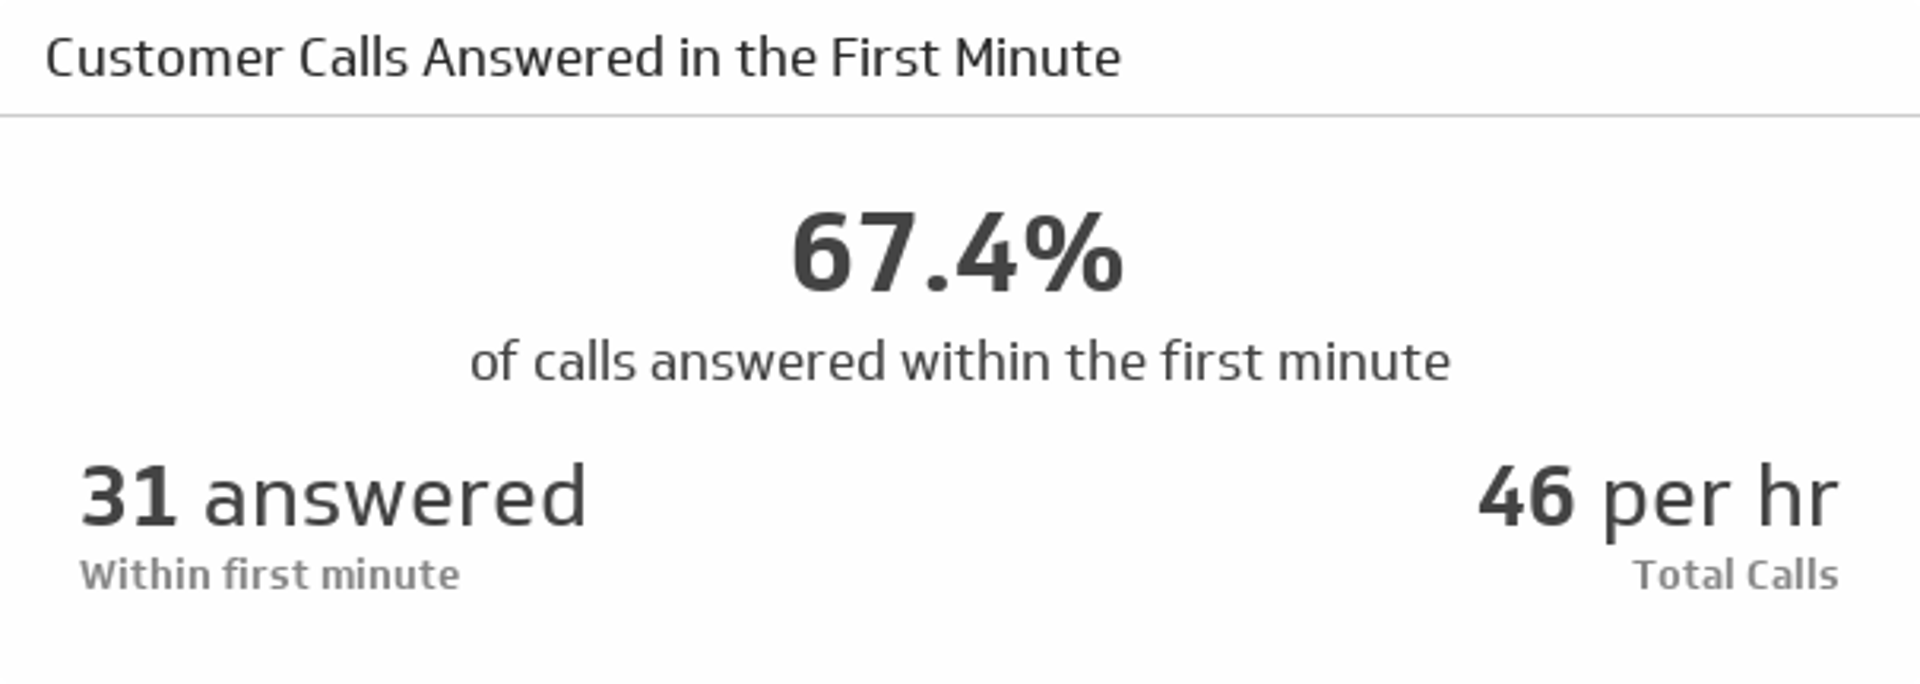
Customer Calls Answered in the First Minute Metric
Measure the rate at which calls are being answering within the first minute of being placed.
Track all your Call Center KPIs in one place
Sign up for free and start making decisions for your business with confidence.
What is Customer Calls Answered in the First Minute?
Customer Calls Answered in the First Minute measures the percentage of inbound calls your team answers within 60 seconds. It captures the moment a call is offered to your contact centre queue through to the moment an agent connects with the caller. The metric reflects how quickly customers get to a human, which shapes first impressions and sets the tone for the rest of the interaction.
How to calculate this KPI
Formula
Calls Answered in First Minute (%) = (Number of calls answered in 60 seconds or less ÷ Total offered calls) × 100
Define each term so reporting stays consistent across queues and sites:
- Offered calls: All inbound calls that enter the queue during the period. Decide if you exclude short abandons, internal transfers, or voicemails.
- Answered in 60 seconds: Calls where the time from queue entry to agent answer is 60 seconds or less. Clarify whether IVR time counts toward the 60 seconds or if you start the clock once the caller joins the queue.
- Multi-skill routing: When a call hunts across skills, use the time from first eligible queue entry to answer. Document this so your operations and analytics teams compare like for like.
Many centres also track additional thresholds such as 30 seconds and 90 seconds. That profile shows how callers experience the queue, not just a single cut-off.
Example calculation
In a week, your centre received 5,400 offered calls. Of those, 4,770 were answered within 60 seconds, 360 were answered after 60 seconds, and 270 were abandoned.
- Calls Answered in First Minute: 4,770 ÷ 5,400 × 100 = 88.3 percent
- Answered after 60 seconds: 360 ÷ 5,400 × 100 = 6.7 percent
- Abandonment: 270 ÷ 5,400 × 100 = 5.0 percent
Segment by queue to learn where callers wait longest. You might find that Billing achieves 93 percent within 60 seconds, while Technical Support sits at 78 percent during peak hours. That points to staffing, training, or routing adjustments.
What is a good benchmark?
Targets vary by industry, call intent, and staffing model. Use these ranges as a starting point, then tune by queue and time of day:
- General inbound service queues: 80 to 90 percent of calls answered within 60 seconds is a common target when you run a stable schedule and publish clear hours.
- Sales and high-value queues: 90 to 95 percent within 60 seconds keeps conversion risk low and reduces call-backs.
- After-hours or overflow queues: 60 to 80 percent may be acceptable if callers expect longer waits and you offer a call-back option.
Benchmarks are helpful, but trend and consistency matter more. A steady 85 percent with low abandonment and healthy satisfaction usually beats a spiky 95 percent that collapses during promotions or month-end.
Why this KPI matters
- Customer patience is limited: Long waits drive frustration and call abandonment, which can turn into repeat contacts or lost revenue.
- Sets up first contact resolution: When callers reach the right agent quickly, first contact resolution rates improve.
- Protects satisfaction: Fast answers reduce pre-call anxiety and support higher Customer Satisfaction scores.
- Exposes staffing gaps: Consistent misses by hour or day usually trace to forecasting, adherence, or skill mix.
- Improves team focus: A clear, visible target aligns workforce management, team leads, and agents around the same outcome.
How to improve your First Minute Answer rate
Speed is a system outcome. It depends on forecasting accuracy, schedule coverage, routing, and agent readiness. Start with these levers:
- Forecast more precisely: Use recent intraday patterns and seasonality to set interval-level volume and handle time expectations.
- Tighten schedule adherence: Publish simple rules for breaks, meetings, and after-call work. Small gains in adherence compound into large reductions in queue time.
- Route with intent: Simplify IVR menus, enable skills-based routing, and send known issues to targeted micro-queues.
- Offer call-backs: Virtual hold reduces perceived wait, protects satisfaction, and flattens spikes.
- Reduce handle time variation: Standardise greetings, verification, and common resolution steps. Shorten wrap by improving note templates.
- Staff the peaks, not the average: Add micro-shifts for predictable rushes, for example lunch hours or billing cut-offs.
- Cross-train carefully: Broader skills create flexibility, but only when knowledge is current and quality stays high.
Guardrails matter. Chasing speed without quality can create rushed conversations and repeat contacts. Balance this KPI with First Call Resolution, Average Handle Time, and Abandonment Rate.
How to monitor this KPI in Klips
Klips lets you centralise your telephony data, calculate timing thresholds, and share live dashboards on TVs, browsers, and email.
- Connect your data: Import queue-level and call-level records from your platform exports or API. Include offered time, answer time, queue name, agent, skill, and call outcome.
- Define the 60-second flag: Create a calculated field that marks 1 if time from queue entry to answer is 60 seconds or less, else 0. Adjust for IVR time based on your agreed rule.
- Calculate the KPI: Sum the 60-second flags and divide by total offered calls over the selected period, then multiply by 100.
- Visualise clearly: Use a gauge for the current percentage, a 13?month line for trend, and an interval chart to show performance by hour and day. Add a target line so gaps stand out.
- Segment for action: Filter by queue, skill, and campaign. Add a table of the bottom-performing intervals and the team leads responsible.
- Distribute with control: Schedule weekly PDFs for managers, keep a wallboard for the floor, and share secure links with executives so everyone sees the same number.
Pair this metric with related operational KPIs like Service Level, Speed of Answer, and Abandonment Rate. That mix keeps speed, access, and experience in balance.
Reporting frequency
Review this KPI daily for operations and weekly in team meetings. Keep a monthly and quarterly roll-up to track seasonality and the impact of staffing or process changes. When you launch a new campaign or change hours, monitor hourly for the first few days to catch surprises early.
Similar KPIs
Related Metrics & KPIs