Sales per Agent Metric
Measure the total number of sales closed by each individual agent to assess productivity and identify coaching opportunities.
Track all your Call Center KPIs in one place
Sign up for free and start making decisions for your business with confidence.
Overview
The Sales per Agent metric measures the total number of sales closed by each individual agent over a specific period. This KPI reveals how effectively each agent converts opportunities into revenue and helps you identify top performers, training needs, and realistic performance benchmarks across your team.
Sales totals naturally vary by agent based on experience, territory, customer base, and seniousness. Rather than applying a single target across your team, use this metric to set individualized goals and track progress over time.
Why Sales per Agent matters
Tracking sales per agent serves several critical functions:
- Performance visibility: See who is closing deals and who may need coaching or support.
- Fair accountability: Compare agents against their own baseline, not just a blanket company target.
- Coaching opportunities: Identify patterns—top performers can mentor others, and underperformers can receive targeted training.
- Compensation alignment: Use actual performance data to justify commission structures and bonuses.
- Staffing decisions: Understand whether gaps are due to agent capability, territory size, or market conditions.
How to calculate Sales per Agent
The formula is straightforward:
Total Sales from Agent N = Sum of all sales closed by that agent during the reporting period
For example, if Agent Sarah closed 18 deals in a month while Agent Marcus closed 12, their respective sales per agent figures are 18 and 12.
If you want to account for deal value, you can also track Revenue per Agent:
Revenue per Agent = Total revenue from all deals closed by Agent N
This variation is useful in industries where deal sizes vary significantly (e.g., enterprise sales vs. SMB sales).
Reporting frequency and targets
Recommended reporting frequency: Daily or weekly, depending on your sales cycle length. Daily updates work well for high-volume, short-cycle sales (e.g., call center outbound). Weekly or monthly reporting suits longer sales cycles.
Setting realistic targets: Avoid one-size-fits-all goals. Instead:
- Benchmark against historical performance for each agent.
- Account for tenure (new hires typically close fewer sales initially).
- Factor in territory or segment size.
- Adjust for seasonal trends or market conditions.
An example target might be "15 sales per week" for an experienced outbound agent, or "3 deals per month" for a complex B2B sales representative.
Who should monitor this metric
- Sales managers: Track team performance, identify coaching needs, and forecast pipeline.
- Individual agents: Monitor personal progress and stay motivated.
- Sales leadership: Assess team capacity, hiring needs, and overall revenue health.
- Finance/operations: Use data for forecasting, commission calculations, and resource planning.
Related metrics and variations
To get a fuller picture of agent performance, pair Sales per Agent with:
- Sales per capita: Average sales per agent across the entire team (useful for comparing team performance over time).
- Average deal size: Revenue per deal, which reveals whether agents are closing high-value or low-value opportunities.
- Conversion rate: Percentage of opportunities that close, which shows quality of pipeline work.
- Sales cycle length: Time from first contact to close, which indicates efficiency.
- Customer acquisition cost (CAC): Cost per new customer acquired, which determines profitability.
How to track and visualize Sales per Agent
Use a dashboard or reporting tool to monitor this metric in real time. Effective visualizations include:
- Leaderboard: Rank agents by sales closed (motivates top performers, highlights underperformers).
- Trend chart: Plot each agent's sales over weeks or months to spot improvement or decline.
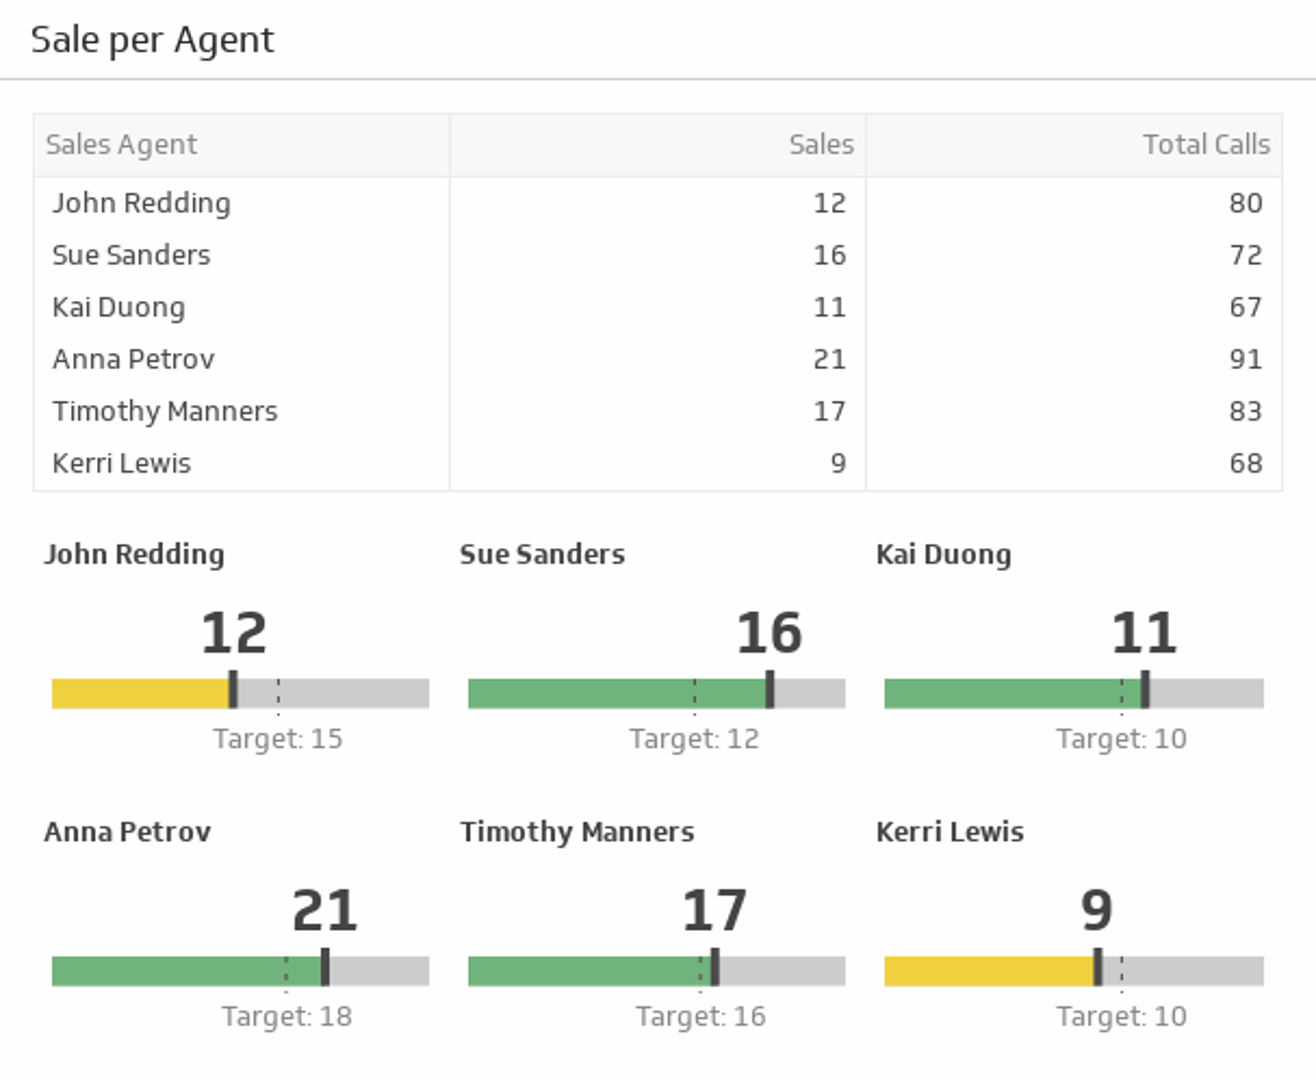
- Target vs. actual: Show how each agent performs against their individual goal.
- Heatmap: Display sales volume by agent and time period to identify patterns.
A centralized dashboard ensures your entire team stays aligned on performance and makes it easy to spot trends at a glance.
Key takeaways
Sales per Agent is a foundational metric for any sales-driven organization. It reveals individual productivity, enables fair performance evaluation, and highlights where coaching or support is needed. By combining this metric with related KPIs like conversion rate and average deal size, you gain a complete picture of agent effectiveness and can make data-driven decisions about training, compensation, and hiring.
Related Metrics & KPIs