Email marketing statistics
Metrics to gain insight into your email marketing campaigns.
Email Open Rate
Why monitor email marketing statistics?
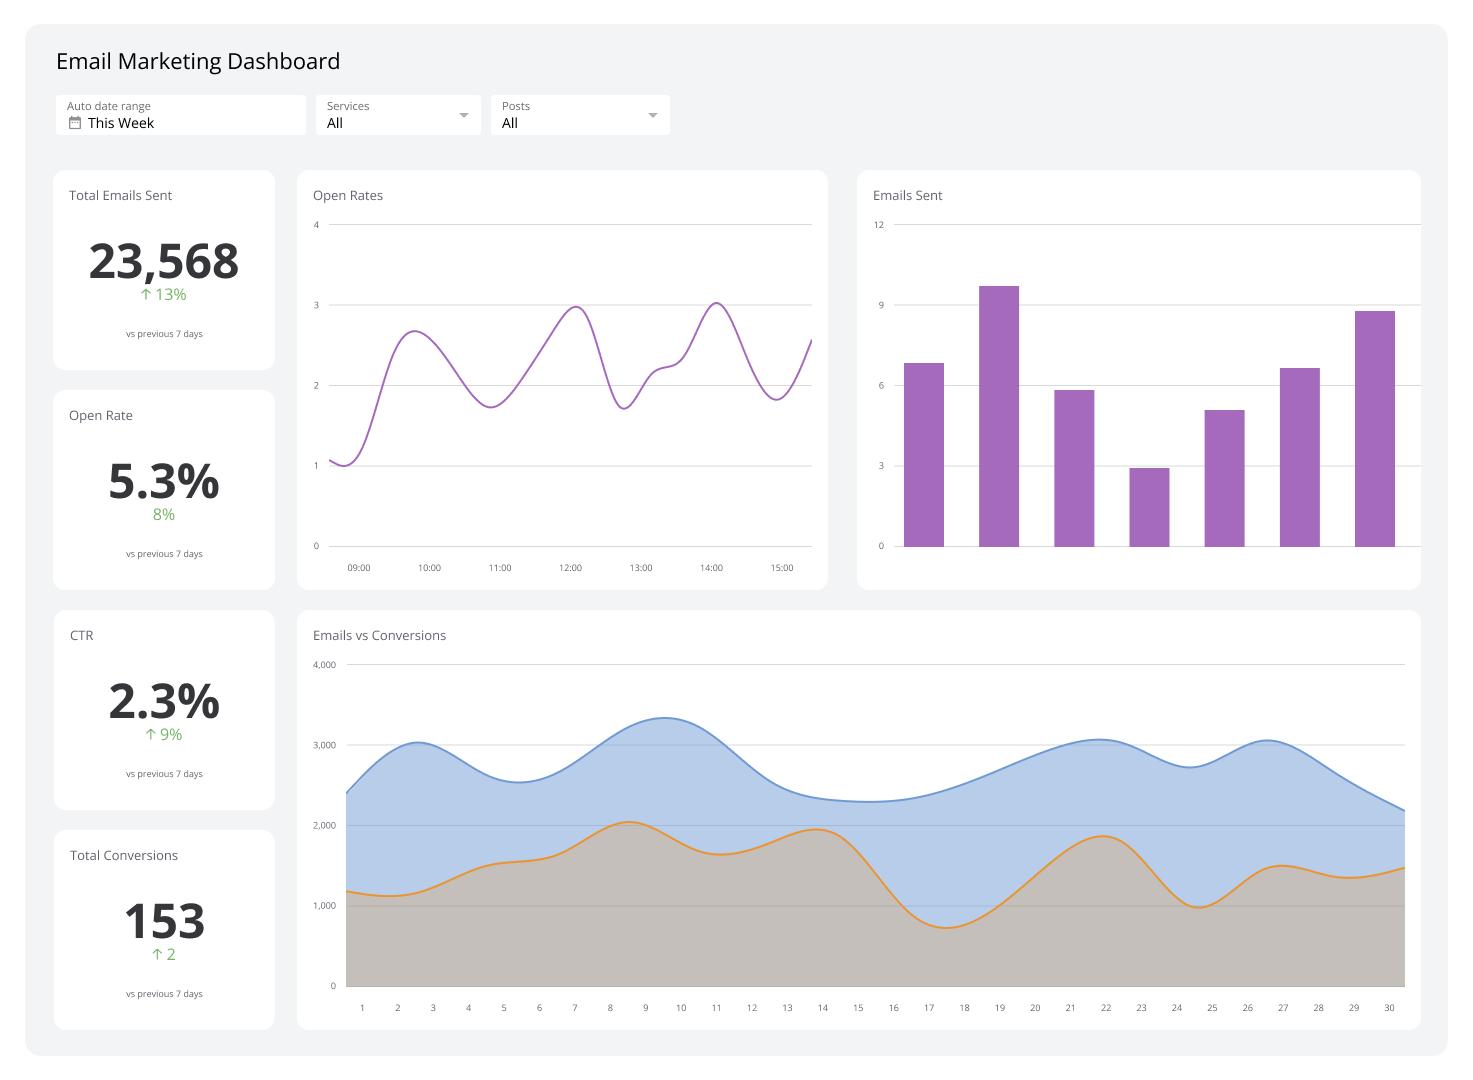
Email marketing remains one of the most effective channels available to marketing teams. Tracking the right email marketing statistics gives you clear insight into how campaigns are performing and where you can improve ROI. By monitoring engagement signals like opens, clicks, unsubscribes, and bounces, you can create targeted content that consistently meets your marketing goals, without guessing what's working.
How to choose the right email marketing metrics
With so many available metrics, narrowing your focus is essential. The data you track should be high-level, actionable, and easy to read, and it should support direct comparison across campaigns. Here are the email marketing KPIs and metrics every digital marketer should monitor.
Email marketing statistics KPIs
Campaign performance
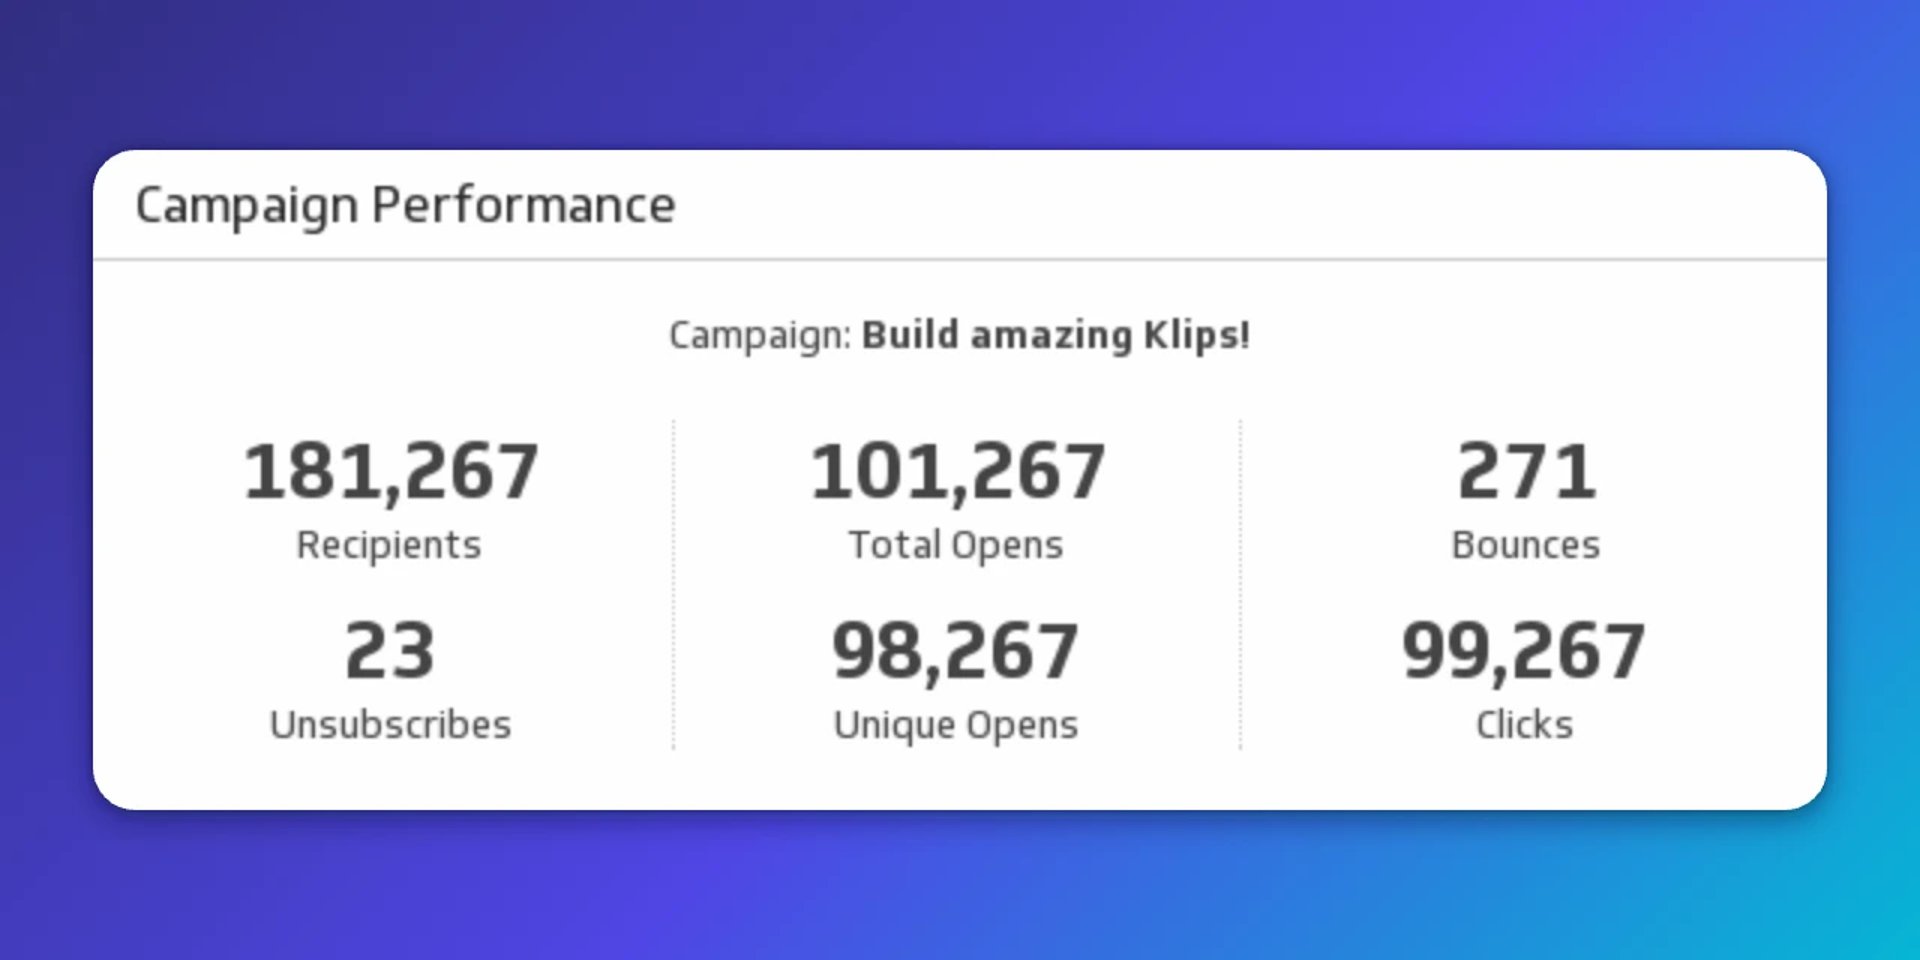
Campaign Performance tells you whether an email campaign is working, and what to do next: improve the email and its landing pages, replicate what worked, or move on.
Why this metric?
Campaign Performance gives you a clear view of how each email campaign is performing. It captures reach, subject line effectiveness, in-email actions, and unsubscribes in one place. That makes it easier to compare campaigns and make a call without waiting for someone to pull the numbers. You can explore a ready-made campaign performance dashboard to see these results at a glance.
Delivery and engagement statistics
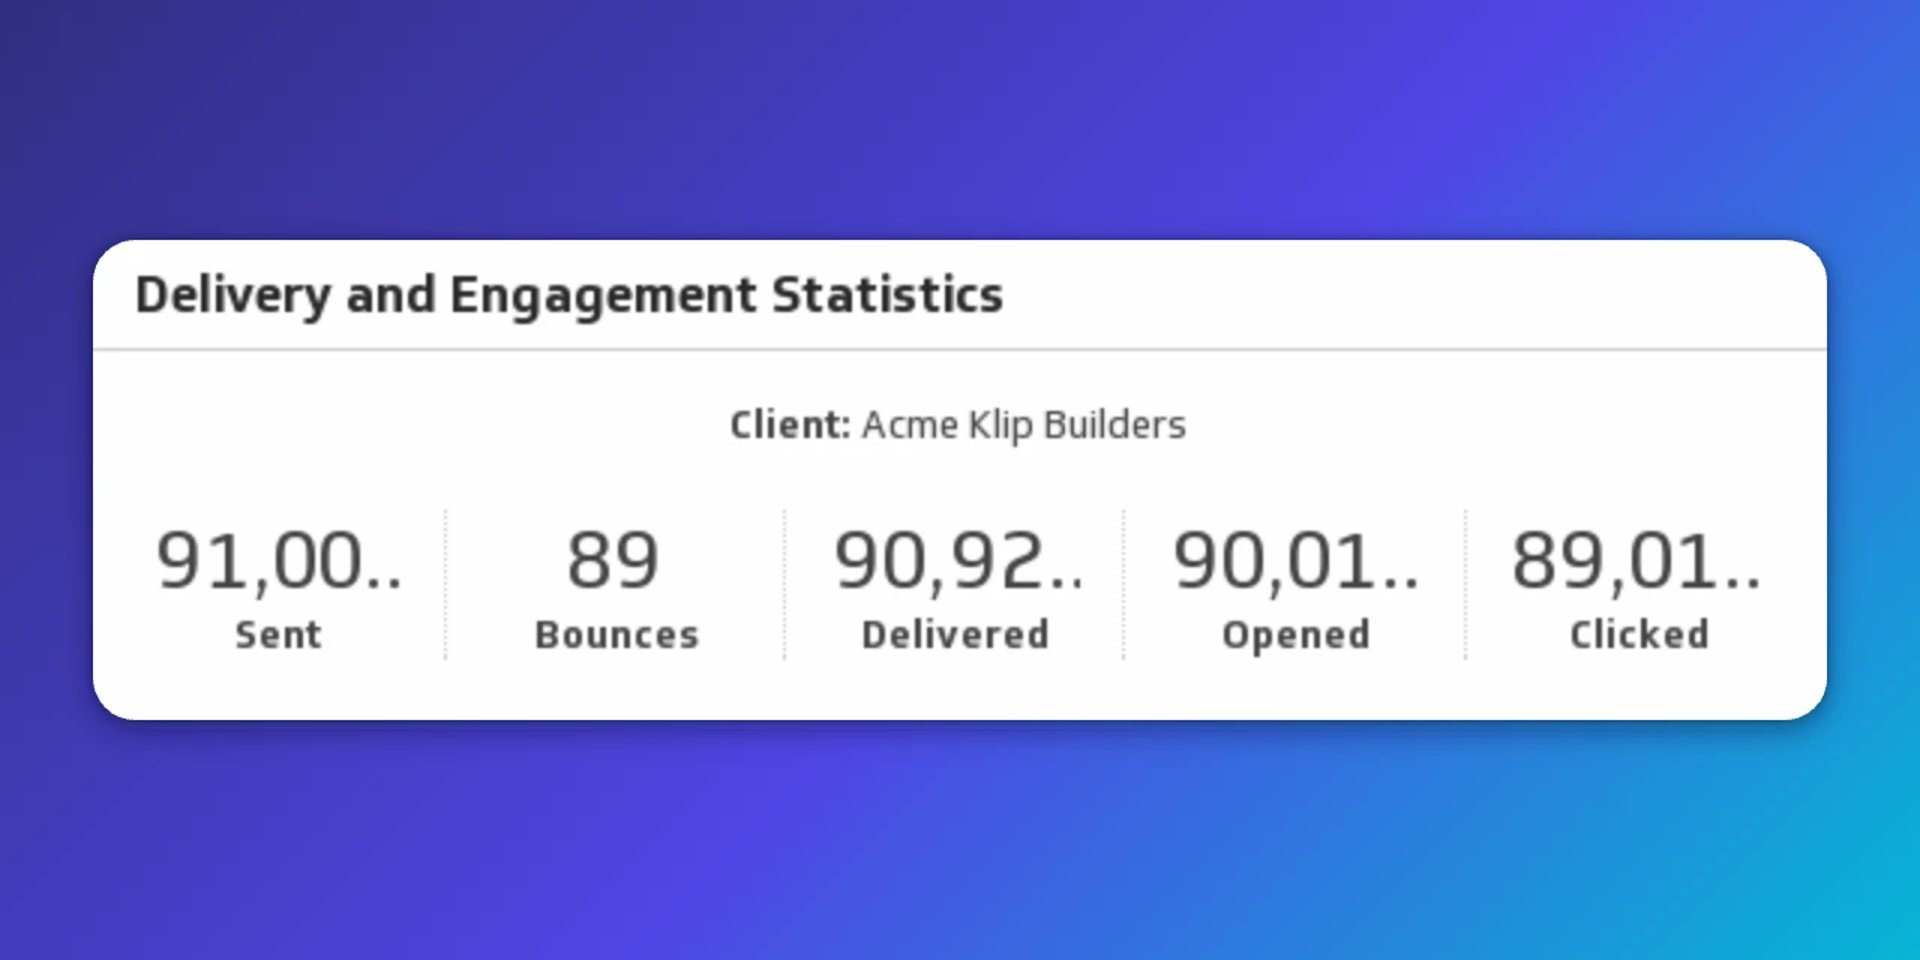
The Delivery and Engagement Statistics metric gives you a high-level view of campaign performance. It shows how many leads received the email, how many opened it, and how those who opened it interacted with the content.
Why this metric?
Delivery and engagement statistics reveal whether your subject line and content are compelling enough to drive action. Beyond open rate, this metric shows how recipients behave once inside the email. Reviewing these numbers alongside the actual campaign structure helps you refine what's running and build stronger campaigns going forward, without having to piece together data from multiple sources.
Opens by country
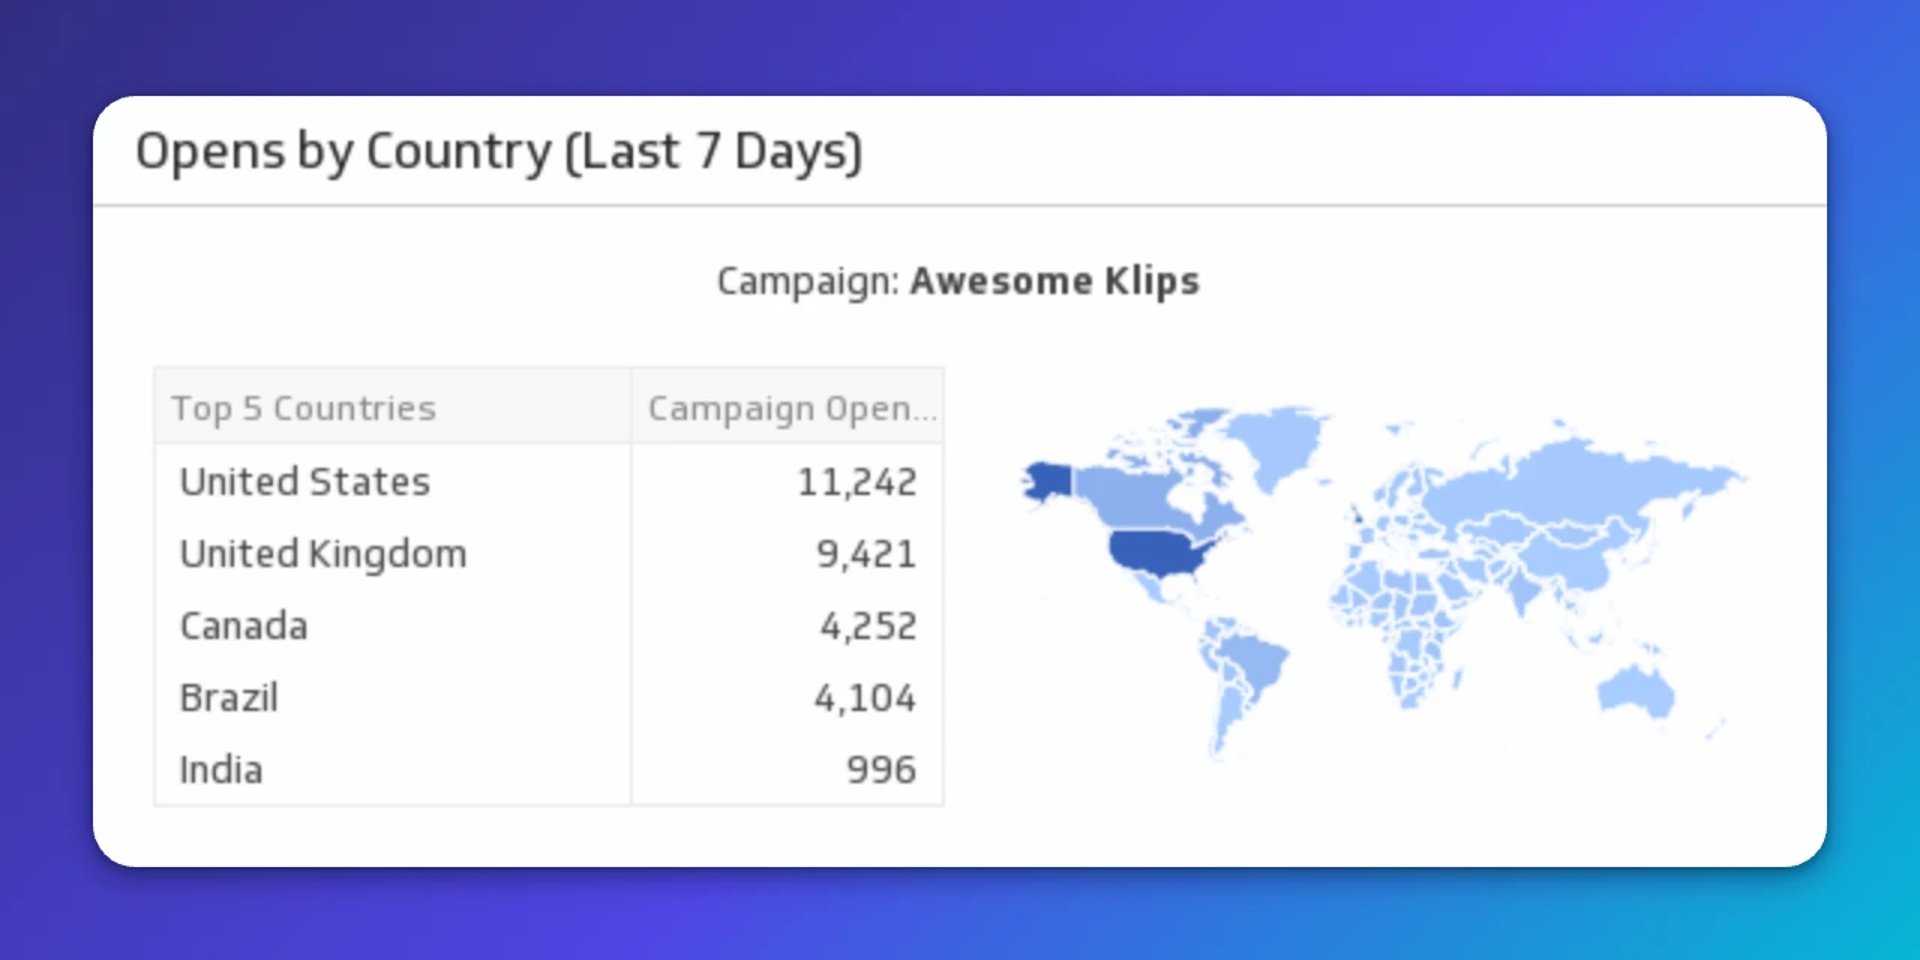
The Opens by Country metric shows which countries generate the highest open rates for your email campaigns.
Why this metric?
Knowing which regions are most likely to open and engage with your emails helps you focus campaigns where they perform best. That geographic clarity supports smarter audience segmentation strategies and more efficient distribution decisions, so your team spends time on the audiences most likely to convert.
This example was built with Campaign Monitor. Learn more: Campaign Monitor Dashboard