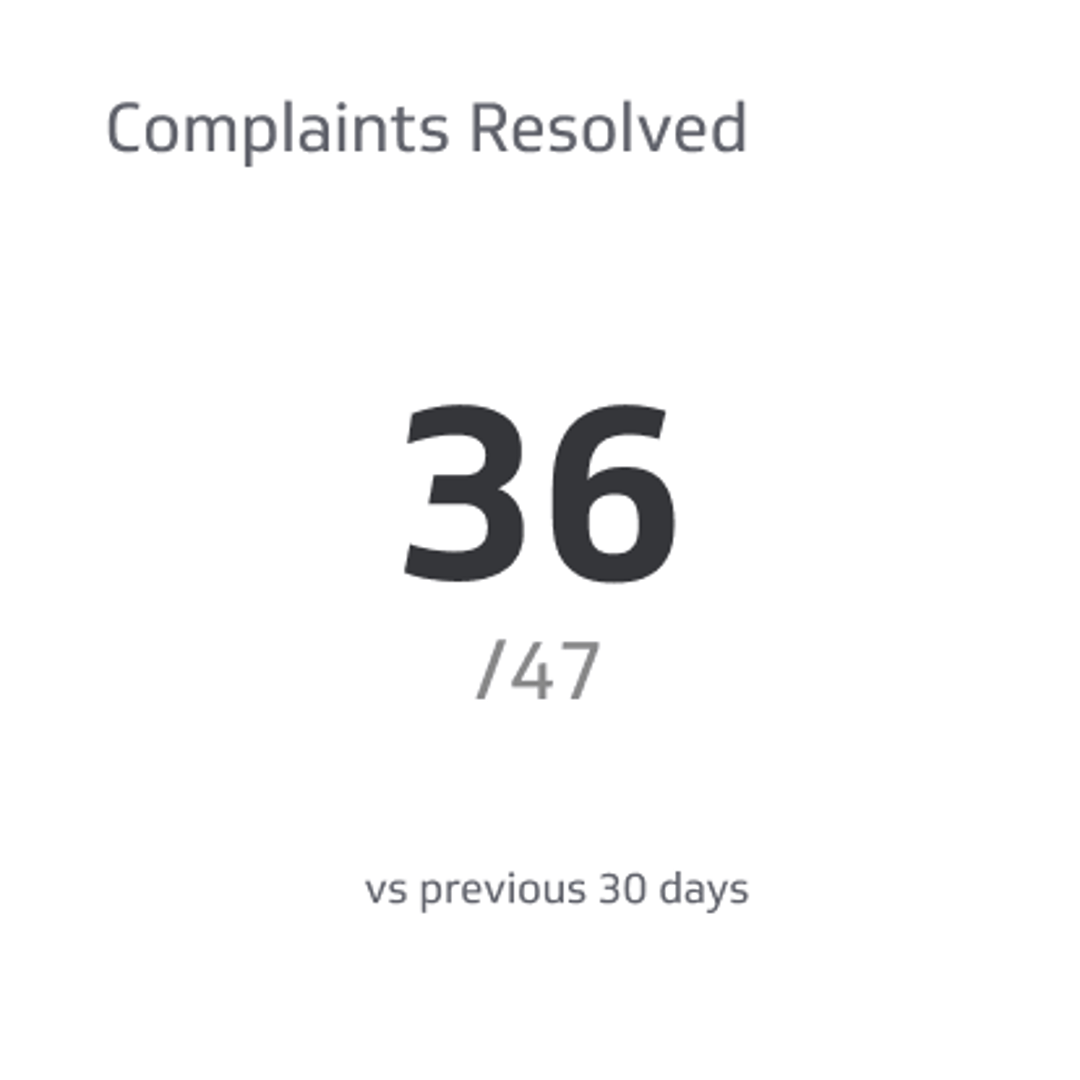
Complaints Resolved Metric
Track the percentage of customer complaints your support team resolves successfully.
Track all your Support KPIs in one place
Sign up for free and start making decisions for your business with confidence.
Overview
The Complaints Resolved metric measures the percentage of customer complaints your support team has successfully resolved within a given period. This KPI directly reflects your team's effectiveness and your customers' satisfaction. Tracking this metric helps you identify bottlenecks, allocate resources better, and ultimately strengthen customer loyalty.
Why Complaints Resolved matters
Customer complaints are inevitable in any business. What matters is how quickly and effectively your team addresses them. A high complaints resolved rate signals that your support team is responsive, capable, and committed to customer success. Conversely, a low rate may indicate staffing shortages, process inefficiencies, or training gaps—all fixable issues when you monitor them closely.
For growing companies, this metric is especially valuable because it directly impacts customer retention and word-of-mouth reputation. Customers who feel heard and supported become repeat buyers and advocates for your brand.
Formula
Complaints Resolved Rate = (Number of Complaints Resolved / Total Number of Complaints Received) × 100
How to calculate it
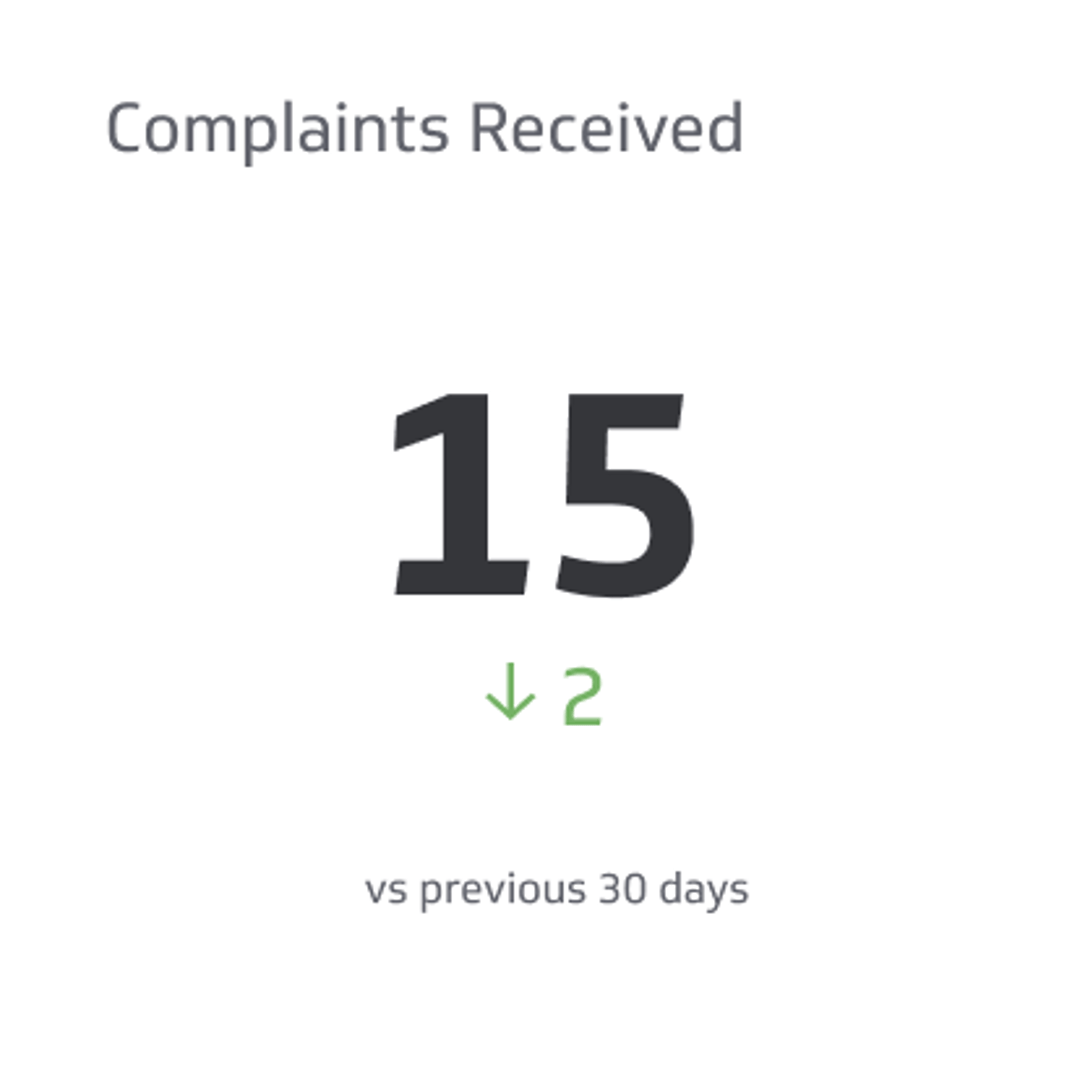
- Count the total number of complaints received during your reporting period (e.g., one month).
- Count how many of those complaints were fully resolved to the customer's satisfaction.
- Divide resolved complaints by total complaints and multiply by 100 to get a percentage.
Example calculation
If your support team received 50 complaints in January and resolved 48 of them, your complaints resolved rate would be:
(48 / 50) × 100 = 96%
Reporting frequency
Monthly is the standard cadence for this metric, though some fast-moving support teams track it weekly or even daily. Monthly reporting allows you to spot trends without getting lost in daily noise, while still catching problems early enough to act.
Example KPI target
96% of complaints resolved is a realistic and ambitious target for most support teams. Industry benchmarks typically range from 90% to 98%, depending on your industry and customer base. Set your target based on your historical performance and business goals.
Who should track this metric
Primary audience: Support Team Managers and Team Leads
Secondary audience: Customer Success Managers, Operations Leaders, and Executive Leadership
Anyone responsible for customer satisfaction or team performance should monitor this KPI regularly.
How to improve your complaints resolved rate
- Empower your team: Give support staff the authority to resolve issues without excessive escalation.
- Streamline processes: Identify and remove bottlenecks in your complaint handling workflow.
- Invest in training: Ensure your team has the knowledge and soft skills to resolve complaints on the first contact.
- Use the right tools: Implement a support ticketing system or dashboard that centralizes complaints and tracks resolution status in real time.
- Set clear SLAs: Define service level agreements so your team knows how quickly complaints should be resolved.
Related metrics & variations
- Complaint Resolution Rate: Another name for this same metric.
- First Contact Resolution (FCR): The percentage of complaints resolved on the first interaction with your support team.
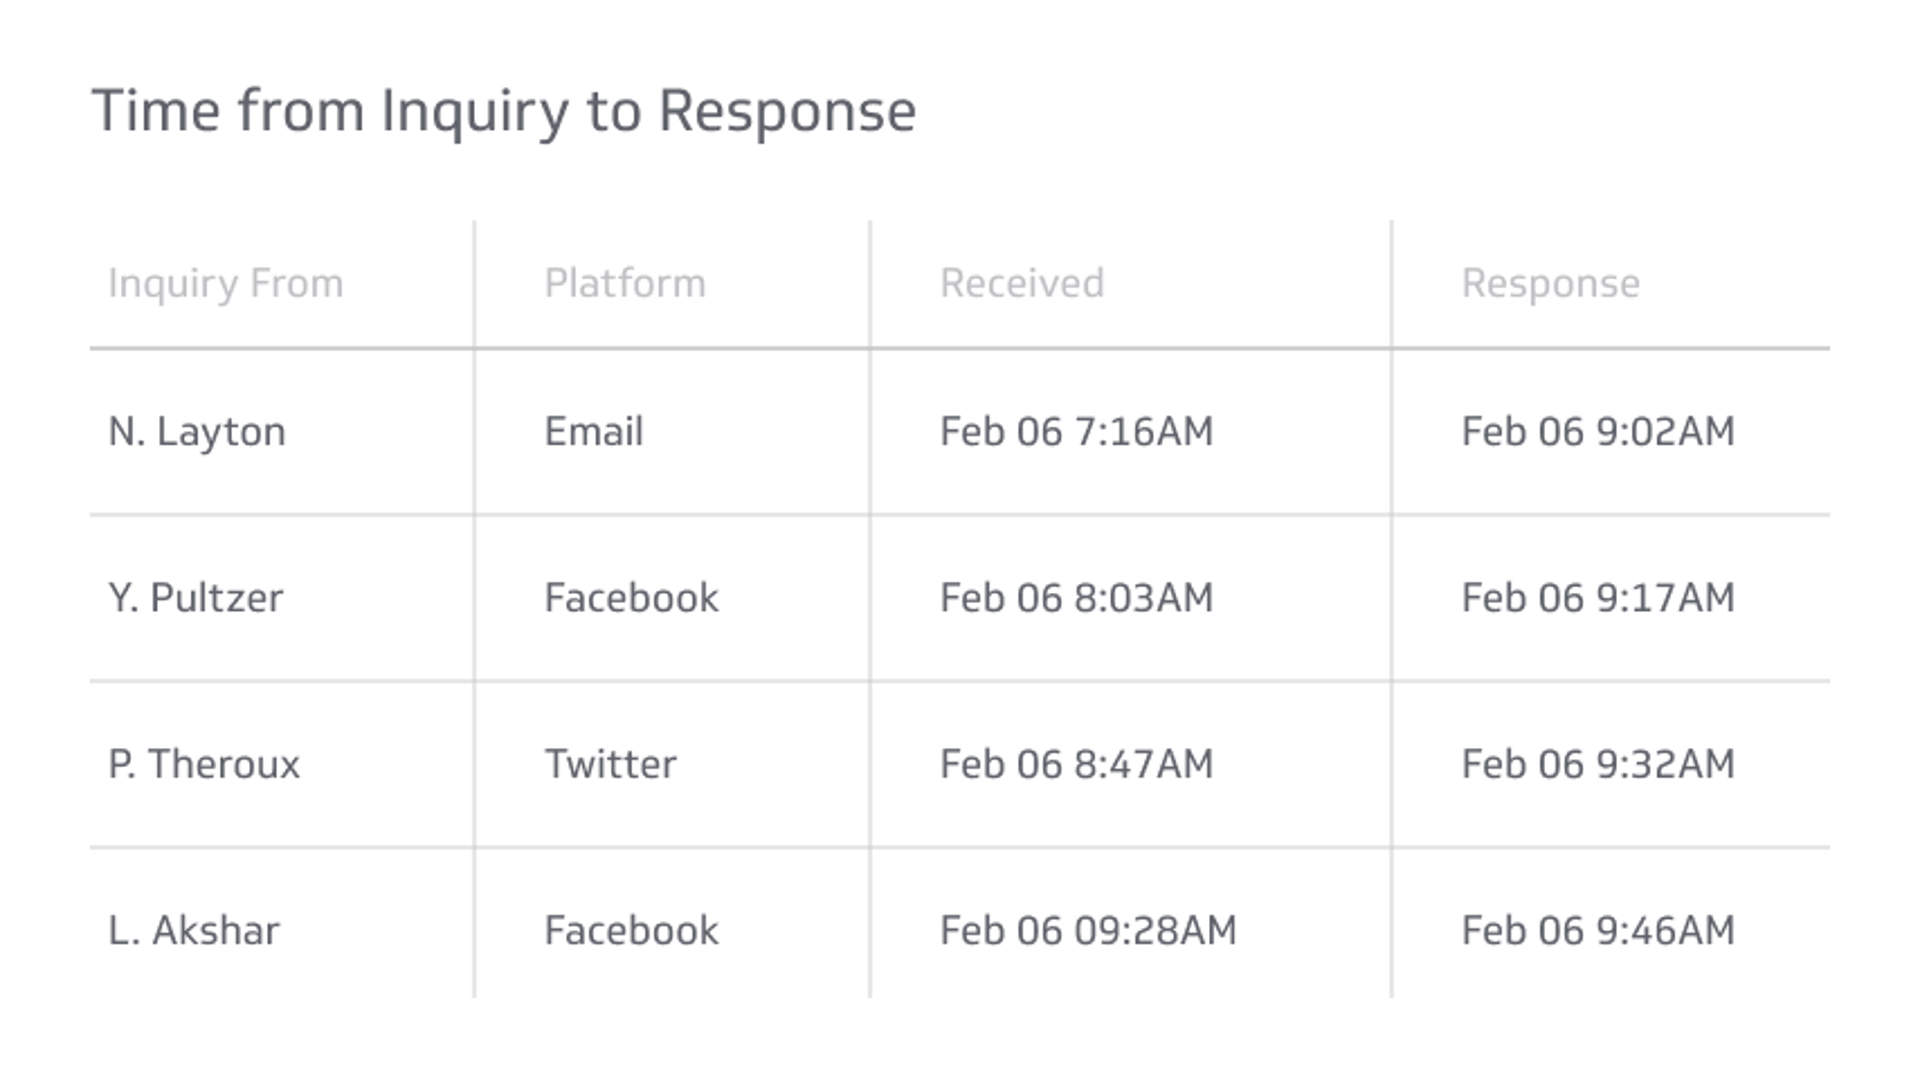
- Average Resolution Time: How long it takes, on average, to resolve a complaint (measured in hours or days).
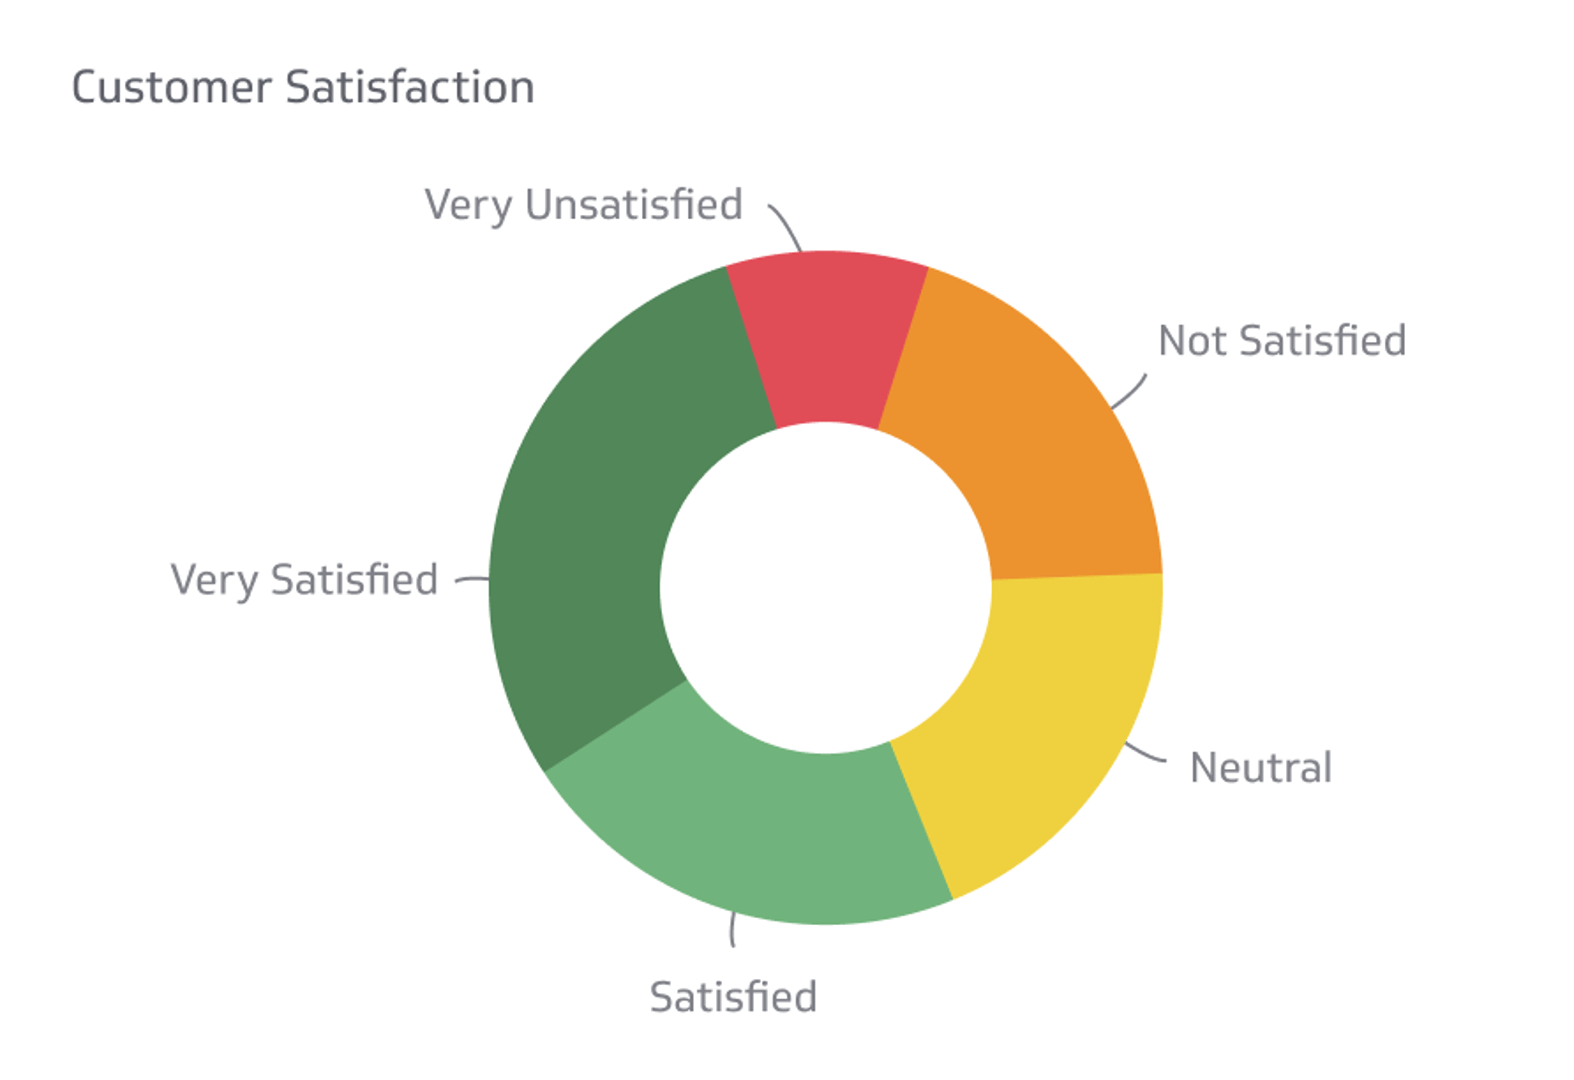
- Customer Satisfaction (CSAT): A survey-based metric that measures how satisfied customers are after their complaint is resolved.
- Net Promoter Score (NPS): A broader loyalty metric that correlates with complaint resolution performance.