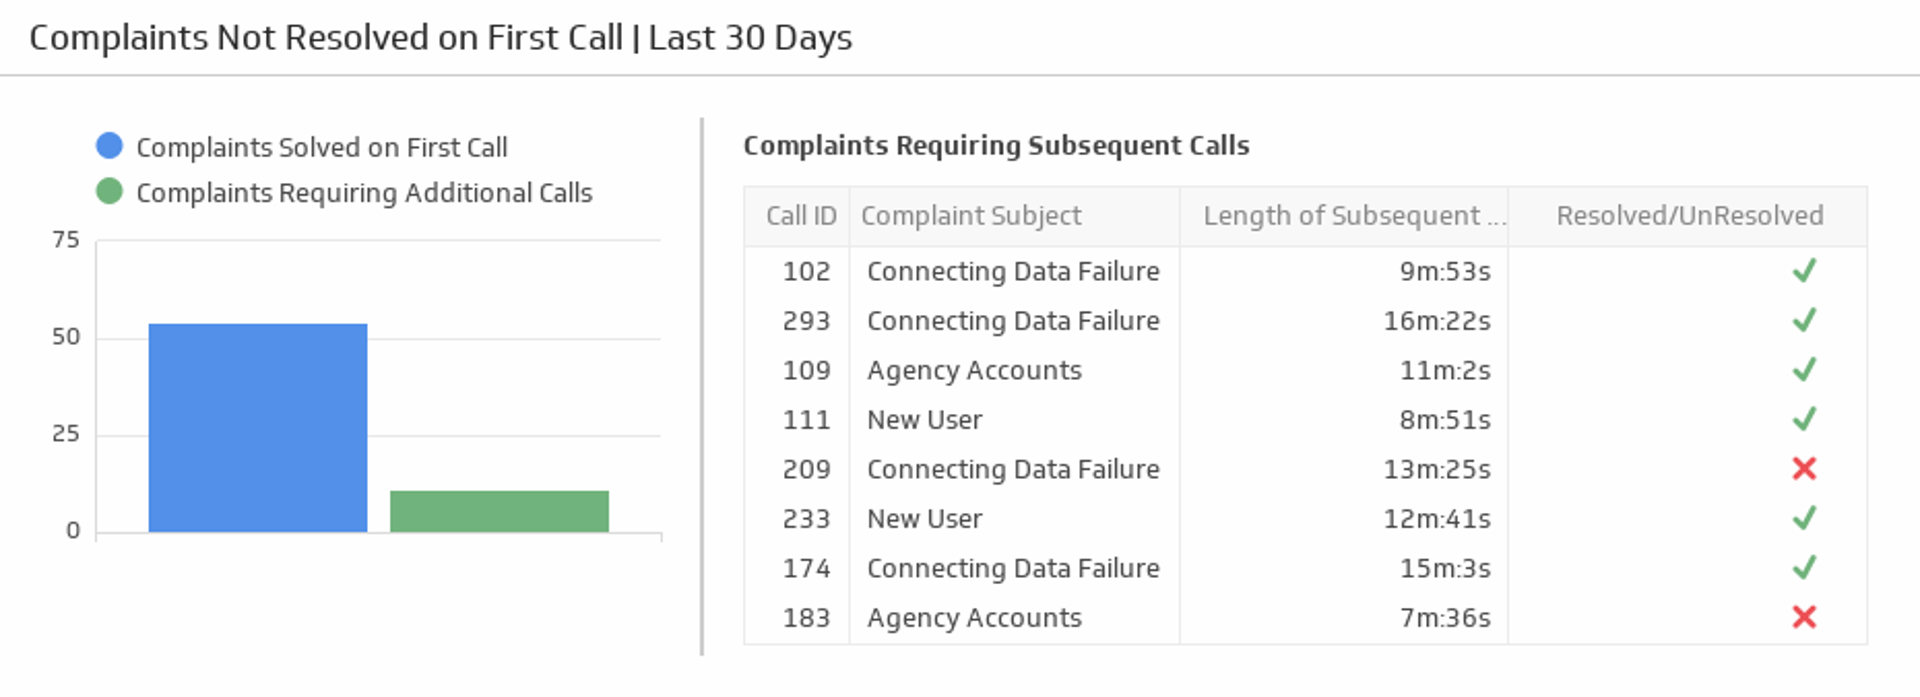
Complaints Not Resolved on First Call Metric
Measure the total number of complaints that required additional calls to be resolved.
Track all your Support KPIs in one place
Sign up for free and start making decisions for your business with confidence.
Overview
Not all complaints can be solved with just a single call. The Complaints Not Resolved on First Call metric monitors the total number of complaints that were unable to be completely dealt with during the initial call.
Formula
(Complaints that were not solved on the first call/Total complaint calls)x100
Reporting frequency
Weekly
Example of KPI target
20% not resolved
Audience
Support Manager, Support Team
Variations
Complaints requiring additional calls
First call non-resolution rate
Why this KPI matters
Each extra contact adds cost and erodes trust. Lowering non-resolution rate improves satisfaction and frees capacity for complex issues. It also reduces refunds and escalations.
How to calculate it correctly
- Define resolution. The customer agrees the issue is solved and no further action is needed.
- Count complaint calls. Filter to calls tagged as complaints, not general inquiries.
- Compute the rate. Divide complaints that needed at least one more contact by total complaint calls.
- Segment. Report by product, topic, region, and agent seniority.
How to reduce non-resolution
- Improve discovery. Teach agents to confirm the problem statement and desired outcome before troubleshooting.
- Knowledge at hand. Keep procedures current and easy to search.
- Clear policies. Give agents the authority to solve common complaints in one touch.
- Smarter routing. Send complex issues to specialists right away.
Track first call non-resolution in Klips
- Connect your systems. Bring in call data and ticket data so you can follow cases end to end.
- Model the metric. Flag first calls that later generated a second contact for the same issue.
- Visualize. A single-value Klip for current rate, a trend by week, and a bar chart by topic.
- Set thresholds. Colour rules flag queues above target.
- Share. Send a weekly report to support and product teams.
Common pitfalls
- Loose tagging. If complaint tags are inconsistent, the metric drifts. Train and audit regularly.
- Overweighting speed. Rushing calls raises recontact. Tie this KPI to FCR and CSAT.
- Ignoring product bugs. Many non-resolutions come from defects. Share patterns quickly with engineering.
Related metrics
- First Contact Resolution (FCR)
- Average Handle Time (AHT)
- Queue Abandonment Rate
- Customer Satisfaction (CSAT)
Track this KPI in Klips. Build a live dashboard that updates in real time, shares easily, and keeps your team aligned.
Related Metrics & KPIs