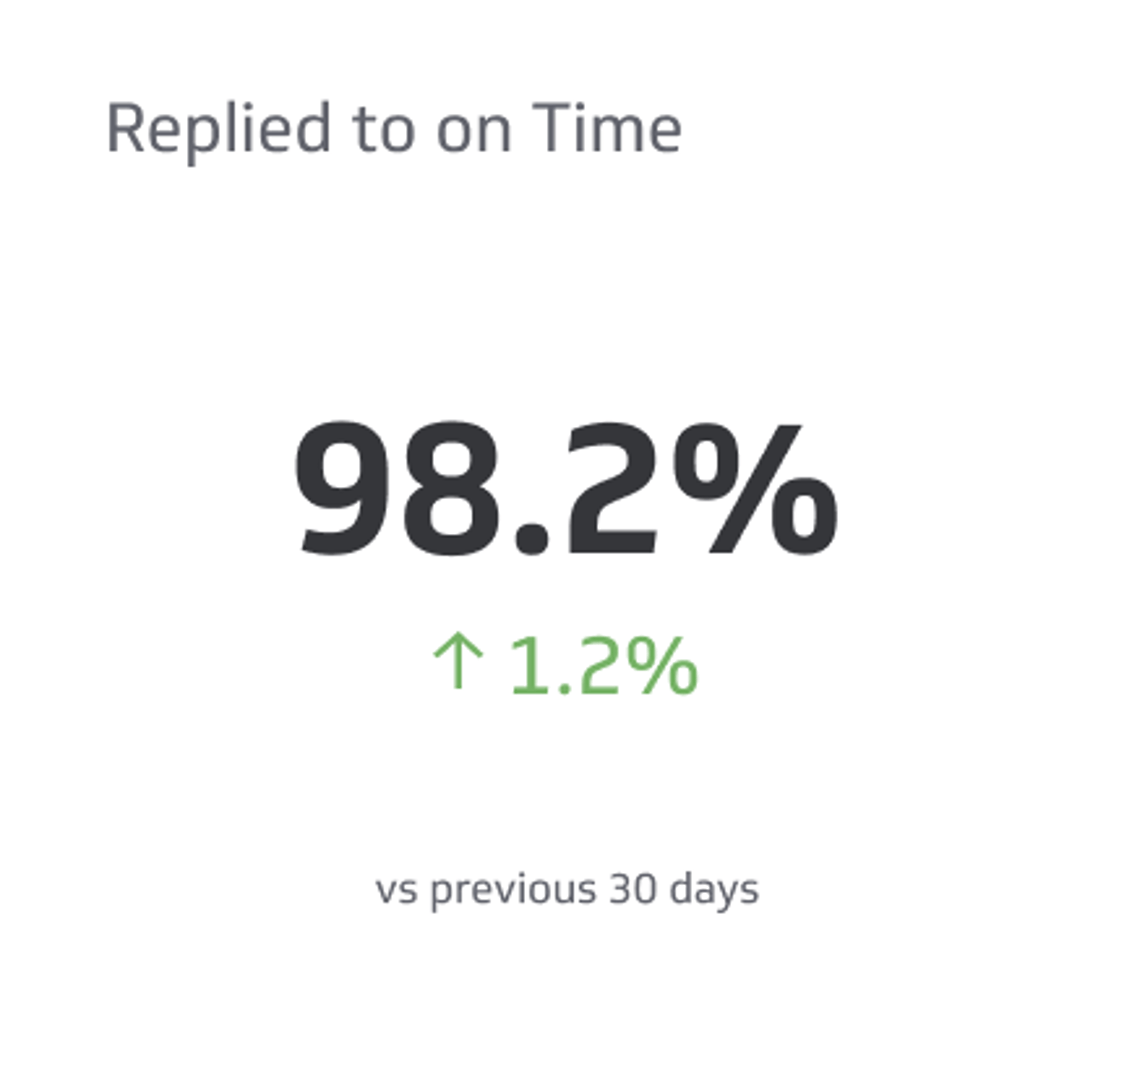
Correspondence Replied to On Time Metric
Measure how many customer requests were answered within a set, appropriate amount of time.
Track all your Support KPIs in one place
Sign up for free and start making decisions for your business with confidence.
Overview
Leaving customers waiting too long damages satisfaction and loyalty. Yet replying to every message instantly is unrealistic for most teams. The Correspondence Replied to On Time metric tracks what percentage of customer requests receive a response within your target timeframe. This KPI ensures your support team balances speed with quality, keeping customers happy while protecting team capacity.
Why this metric matters
Customer support sets the tone for your entire business relationship. When customers feel heard and helped quickly, they stay loyal and recommend you to others. Slow responses, by contrast, frustrate users and erode trust—even if your eventual solution is excellent.
Tracking reply time helps you:
- Identify bottlenecks: Spot when your team is overwhelmed or when certain request types take longer to resolve.
- Set realistic standards: Define what "on time" means for your business (24 hours, 4 hours, 1 hour).
- Improve team performance: Give your support staff clear targets and recognition when they hit them.
- Measure customer satisfaction: Fast, reliable responses directly correlate with higher retention and Net Promoter Score (NPS).
How to calculate it
Correspondence Replied to On Time = (Contact requests replied to within target time period / Total number of contact requests) × 100
Example calculation
Your support team receives 100 customer emails in a week. You set a target of replying within 24 hours. By Friday, 95 of those emails received a response within 24 hours.
Correspondence Replied to On Time = (95 / 100) × 100 = 95%
Benchmarks and targets
Industry benchmarks vary by sector and customer expectations:
- SaaS and software: 90–95% within 24 hours is typical; many aim for 95%+ within 4–8 hours.
- E-commerce: 85–90% within 24 hours is common; some target same-day responses.
- Professional services: 80–90% within 48 hours may be acceptable, depending on complexity.
Set your target based on your customers' expectations, your team size, and your business model. A realistic target is better than an aspirational one you cannot sustain.
Who should track this KPI
- Support Managers: Monitor team performance, allocate resources, and identify training needs.
- Support Team Members: Understand individual and team targets; use feedback to improve.
- Customer Success Leaders: Ensure support quality aligns with broader customer retention goals.
- Executives: Track customer satisfaction trends and support team efficiency.
Variations and related metrics
- On-time correspondence reply rate: Another name for the same metric.
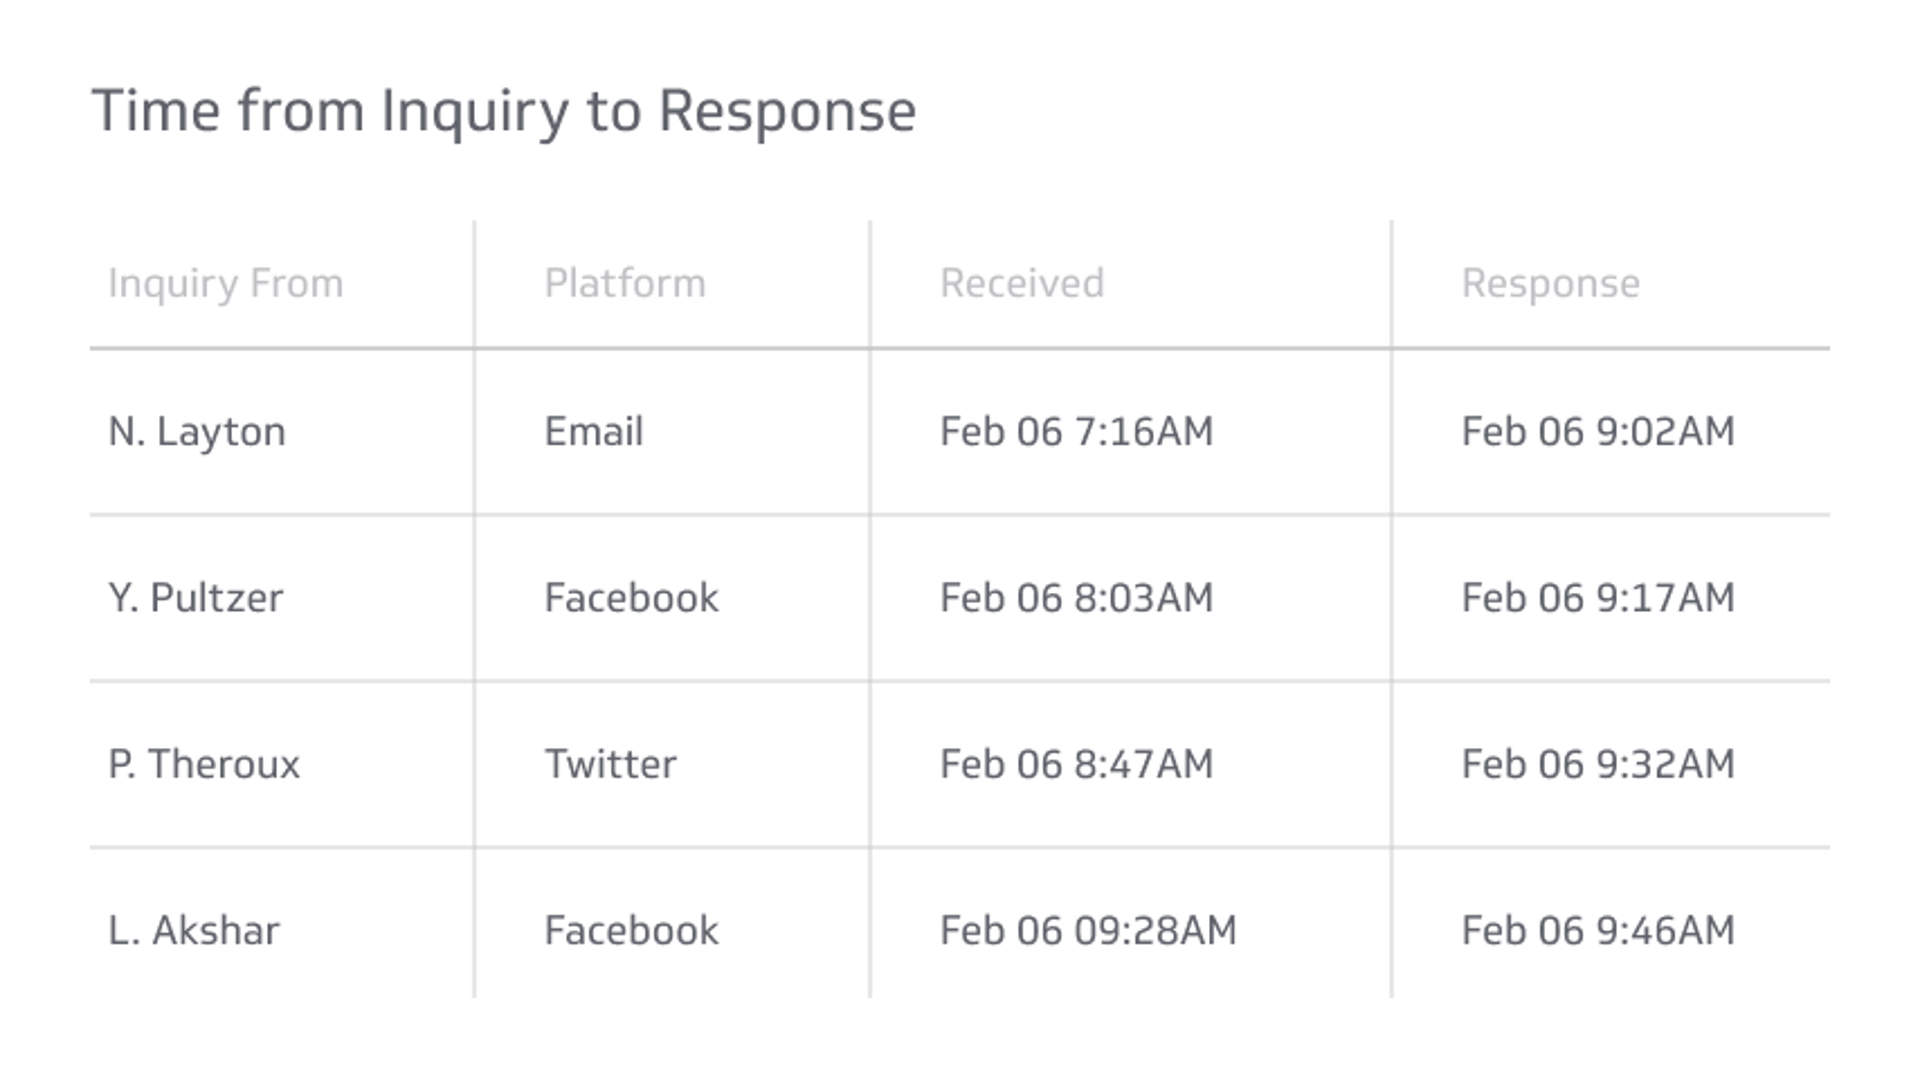
- First response time: Measures the speed of the initial reply (not necessarily resolution).
- Resolution time: Tracks how long it takes to fully resolve a customer issue, not just reply.
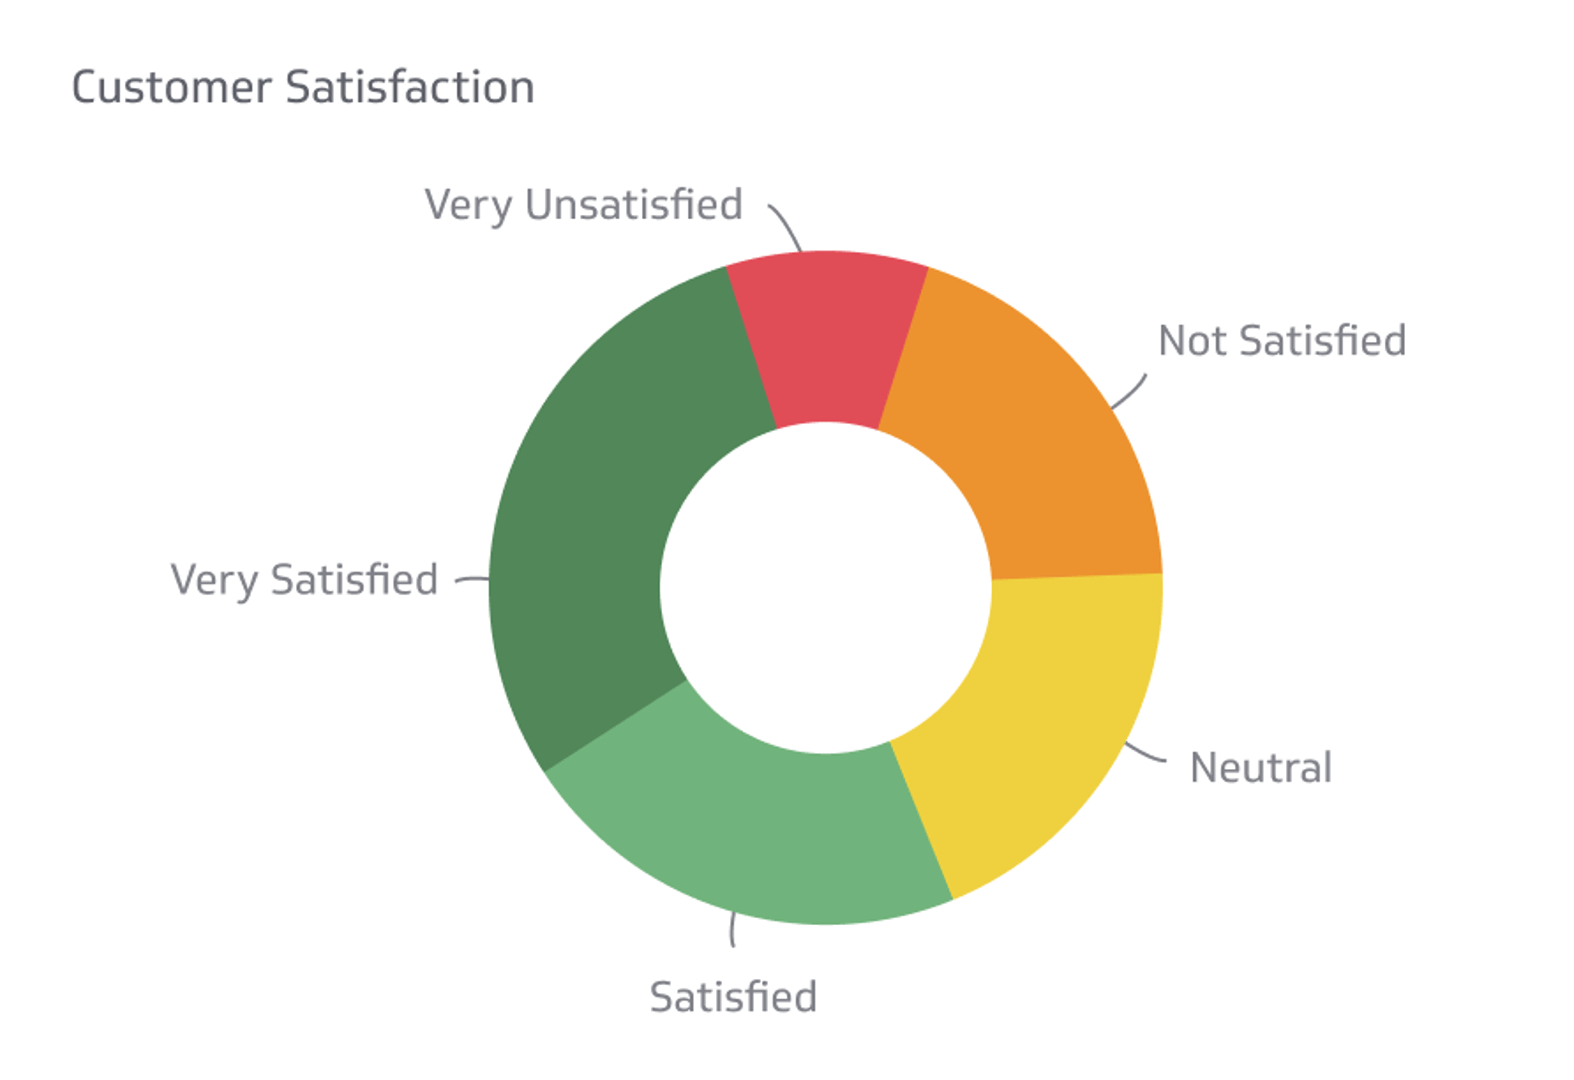
- Customer satisfaction (CSAT): Surveys customers on their support experience; often correlates with reply speed.
- Net Promoter Score (NPS): Measures overall customer loyalty; support quality is a key driver.
How to improve this metric
- Set clear SLAs: Define realistic response time targets for different request types (urgent, standard, low-priority).
- Prioritize and triage: Use automation or simple rules to flag urgent requests so your team handles them first.
- Hire or redistribute: If you consistently miss targets, add team members or reallocate workload.
- Automate responses: Use templates, chatbots, or auto-responders to acknowledge receipt immediately while a human works on the full answer.
- Track and review: Monitor daily or weekly performance; celebrate wins and troubleshoot blockers together.
- Reduce friction: Streamline your ticketing system, remove unnecessary approval steps, and give agents the tools and authority to respond faster.
How to track correspondence replied to on time
Use a dashboard and reporting tool to visualize this metric in real time. Modern support platforms (Zendesk, Freshdesk, Intercom, HubSpot Service Hub) often calculate reply time automatically. You can then pull that data into a centralized dashboard to:
- Monitor weekly or daily trends against your target.
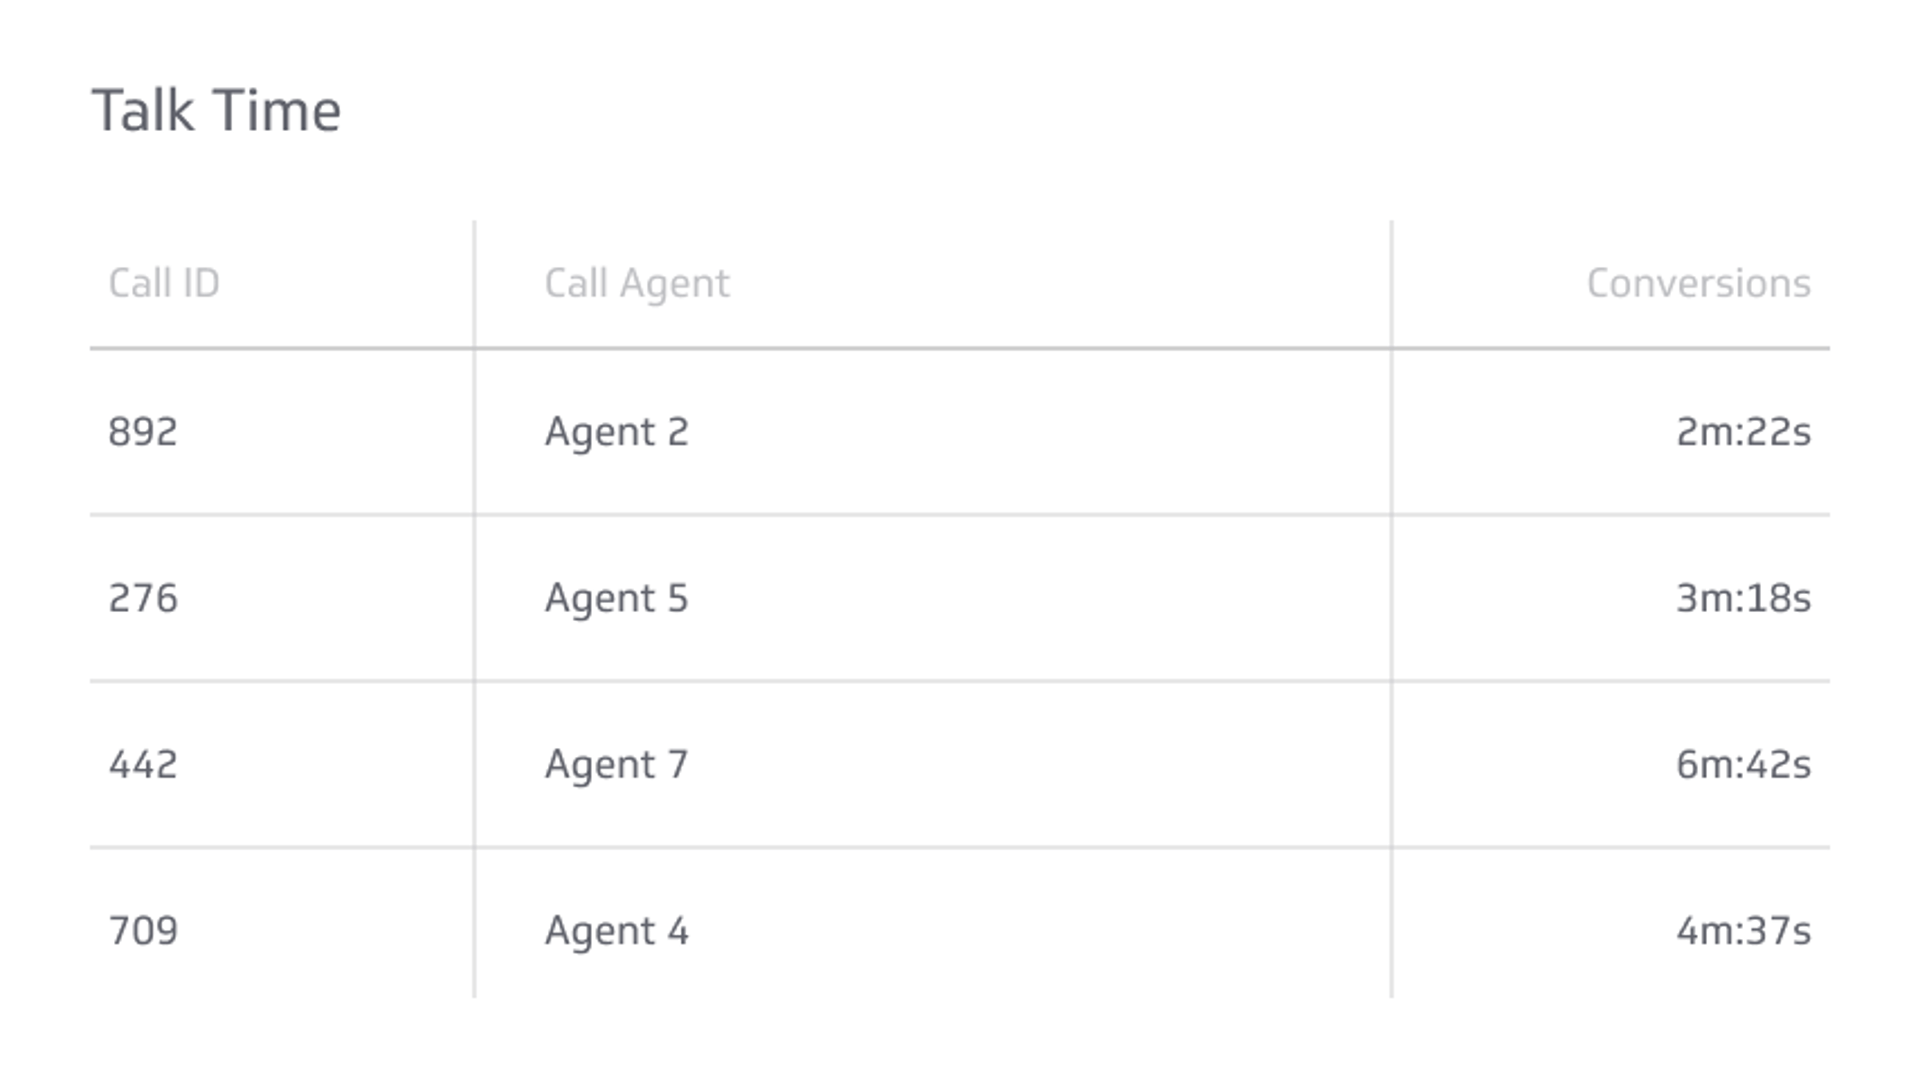
- Segment by agent or team to identify top performers and those needing support.
- Compare by request type to spot which categories take longest.
- Alert the team if performance dips below target, so you can act quickly.
A visual dashboard keeps everyone aligned on goals and makes it easy to celebrate progress.
Related Metrics & KPIs