

Summary - Taking Google Sheet reporting to the next level with dashboard reporting in Klipfolio.
19E was founded in 2017 by a group of engineers and data scientists who are focused on extracting information from analog engineering documentation. They do this by leveraging their cloud-based production management & automation system called “Pandora” combined with cutting-edge, AI-based technologies.
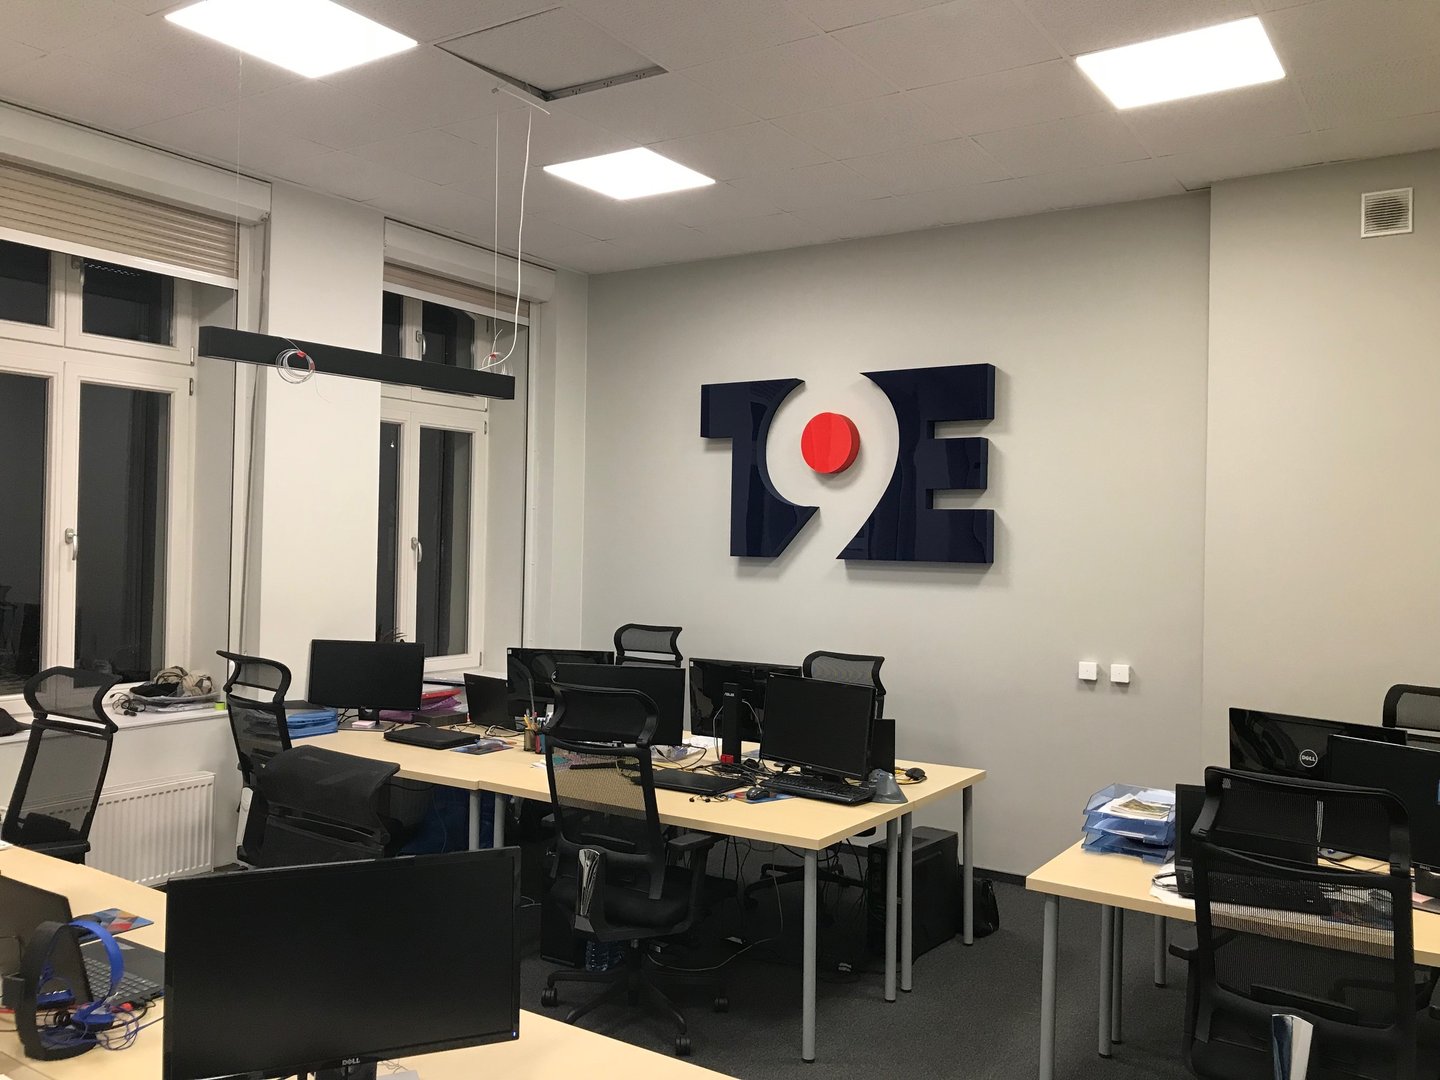
Meet Tomasz…
Tomasz Berezowski has been the CEO of 19E since the very beginning of the company. As the CEO, Tomasz is responsible for everything, from marketing and sales to execution and delivery.
Finding and launching a new dashboard solution
Tomasz and his team at 19E have been dashboarding for a while, now. Klipfolio was adopted by the company’s operations team almost as soon as they launched the company.
Before that, they were using Google Sheets for all of their reporting. Spreadsheet reporting can be time-consuming, tedious and there is a risk of human error associated with it. This forced Tomasz to only report on the most critical functions. Meanwhile, none of the company’s metrics tracking was being done in real-time.
“I analyzed the market of web-based dashboard apps and found out that Klipfolio perfectly matched our reporting requirements at a very reasonable cost.”
Reporting properly on three key areas of business
Tomasz started off as the only Klip builder at 19E. Today, they have another two people who are able to build in Klipfolio and have helped scale their company’s reporting processes.
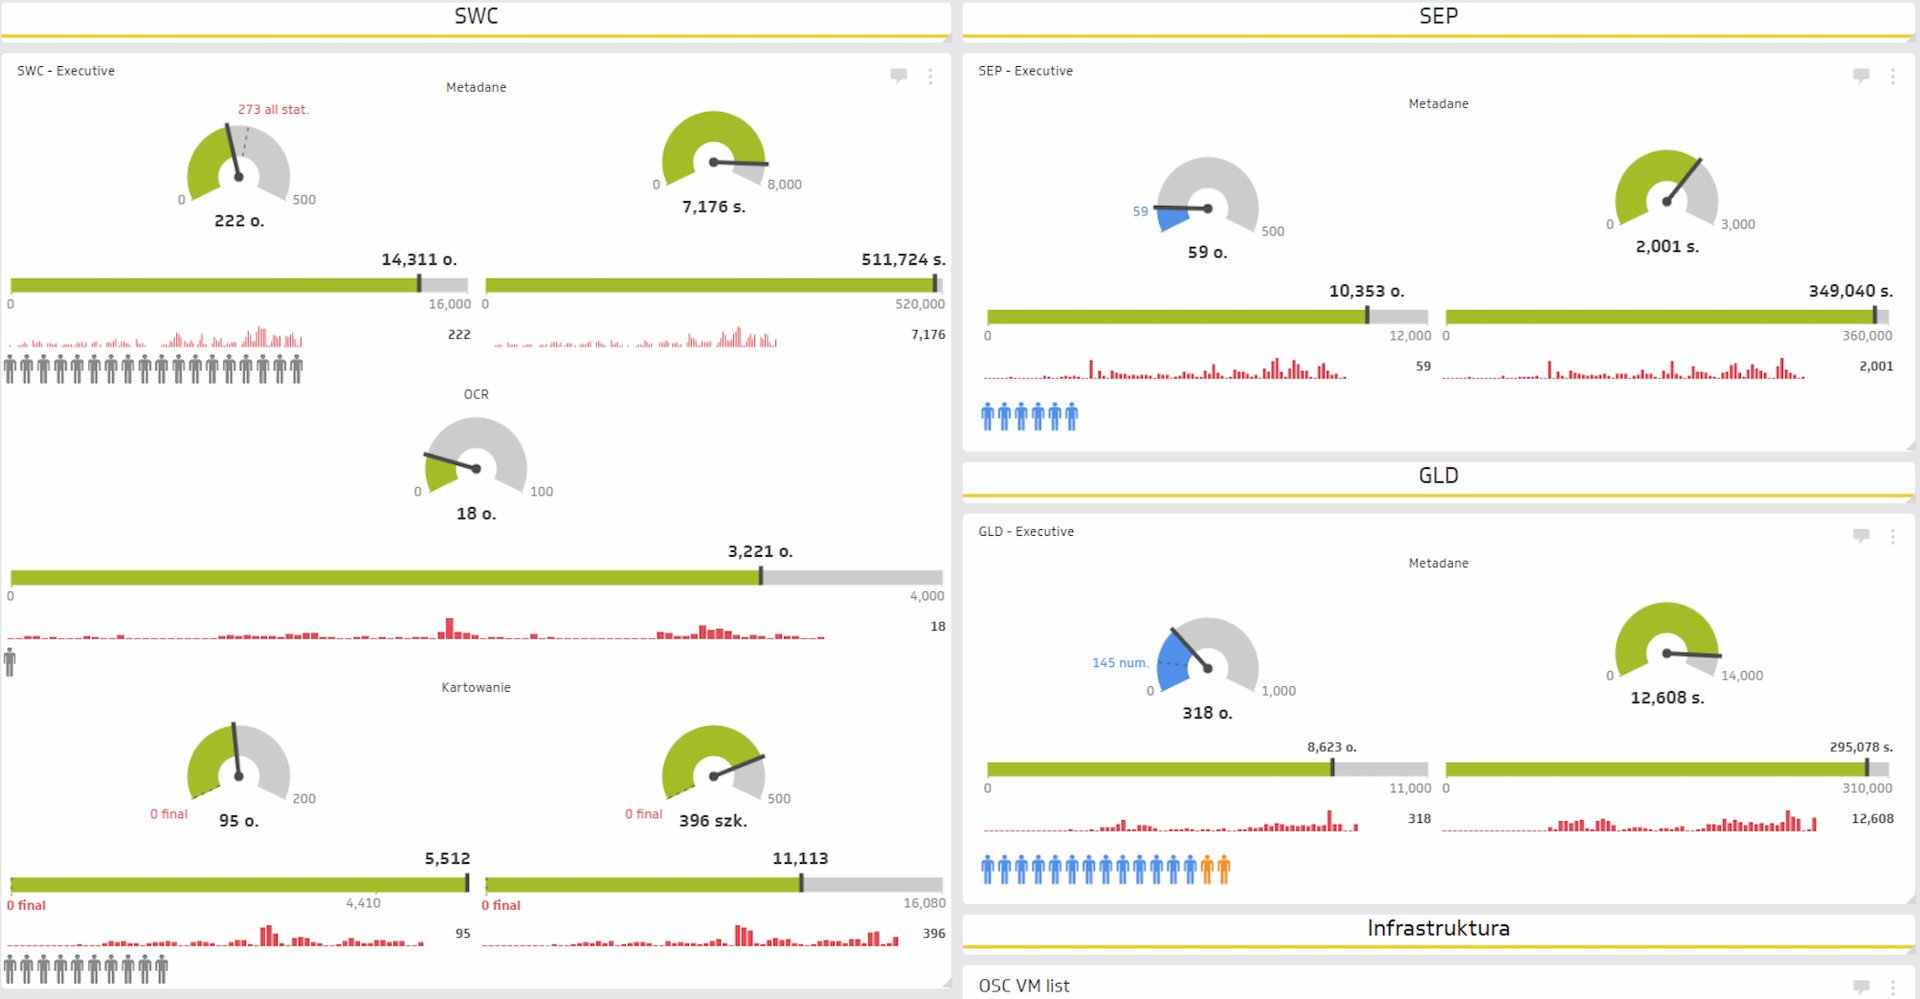
“There are three key areas we are monitoring using Klipfolio: IT infrastructure, production progress, and billing.”
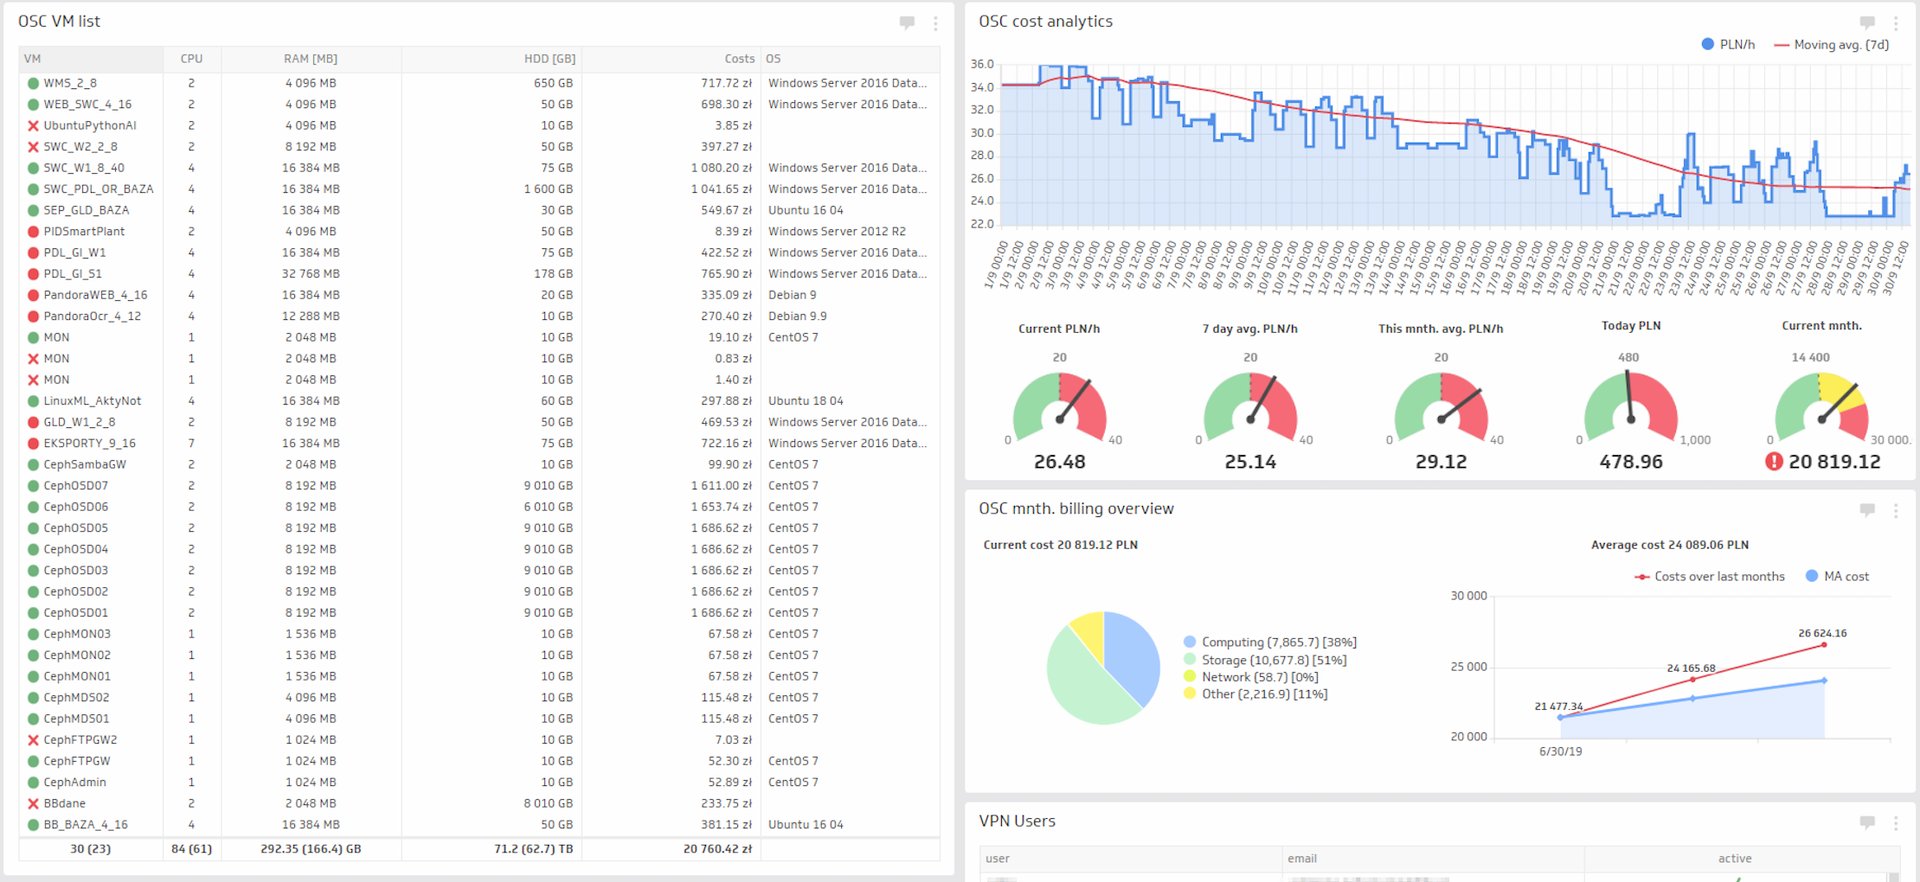
The top metrics his teams track the most are:
Number of processed documents (today, from the beginning of the project, etc.)
Average number of processed documents per person per hour (daily, weekly, etc.)
Hourly cost of IT infrastructure (current, 7-day avg., this month avg., etc.)
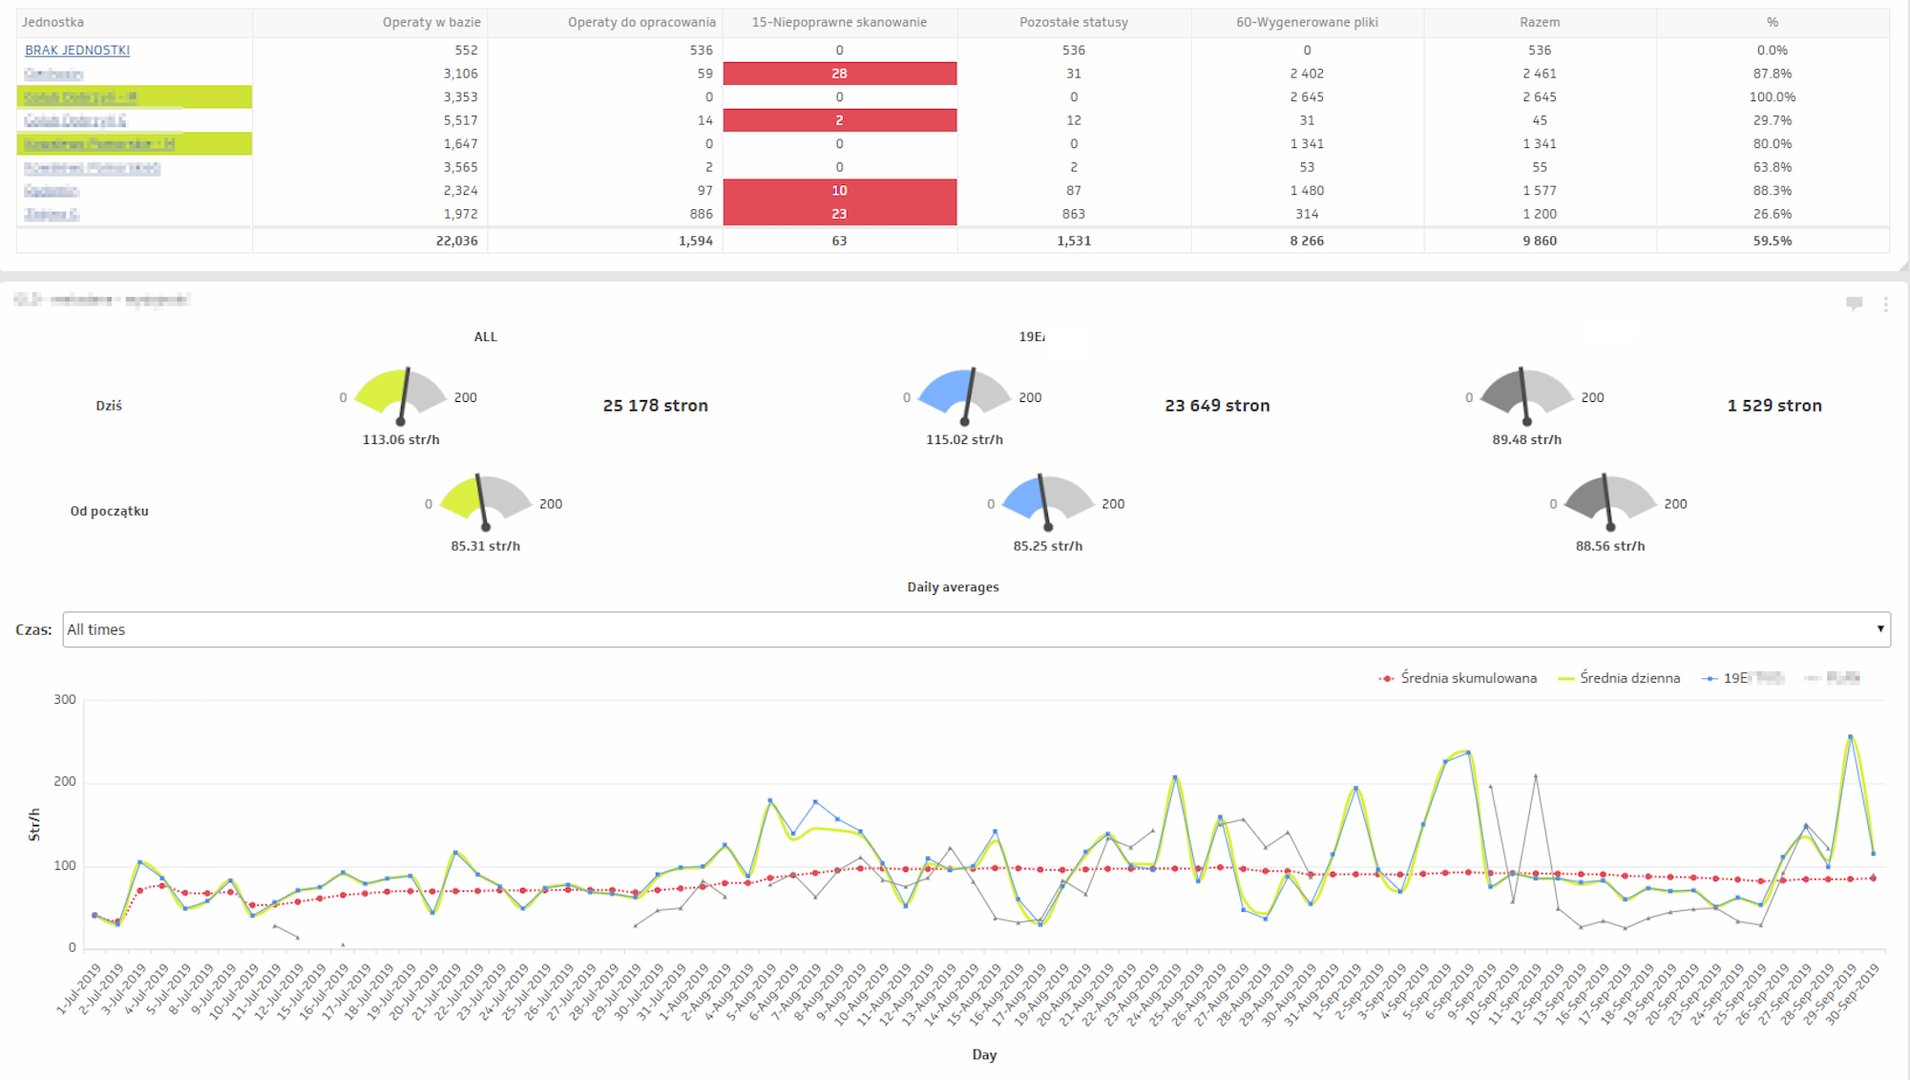
“My favorite Klip is one that shows production performance over time. This key metric demonstrates how tweaking of production schemes or tooling improves (or deteriorates) our profitability.”
Three great ways to share data insights
19E believes that sharing is caring. They take advantage of three great ways to share data with those who need to see it most in the company:
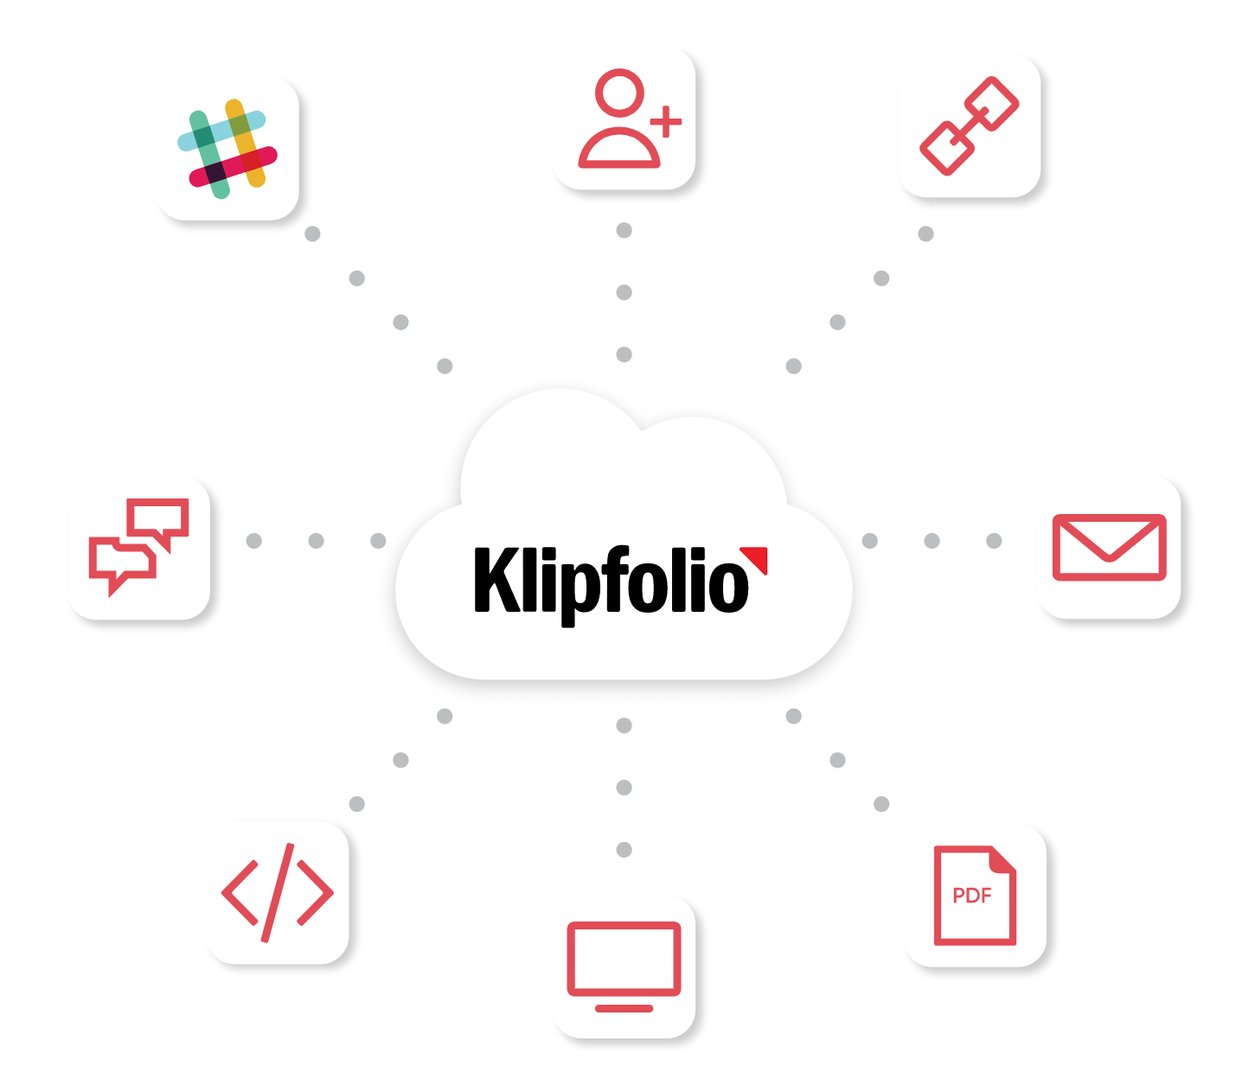
1) Assign roles to users to Klipfolio giving them access dashboards on-demand
Roles represent a collection of users that are assigned permissions by an administrator to perform similar actions or functions. A user can belong to one or more roles. If a user is a member of more than one role their access permissions are merged.
Klipfolio includes the following roles: Admin, Editor, View-Only, and View-Only.
2) Scheduled email data snapshots
With Klipfolio, you can set-up regular email reports based on individual data visualizations or entire dashboards. Schedule emails to go out to specific people, at specific times, and with any frequency.
3) TV Wallboards
You can set your dashboards to ‘full-screen TV mode’ within Klipfolio, and display them on office wallboards and monitors via Airtame, Chromecast or Rise Vision. Multiple dashboards can be set up to display on rotation. Using wallboards to highlight your metrics is a great way to keep your team data-driven and ensure that you never lose sight of your performance.
Check out these other ways to share data in Klipfolio.
Tomasz’s favorite thing about Klipfolio:
“I love to write formulas for data slicing and dicing. Why? Well, because I’m a nerd, and all nerds love an endless ocean of possibilities for handwritten commands. :)”
Celebrating the big wins
19E is headquartered on the Polytechnic campus in the city of Wroclaw in south-western Poland. Tomasz says that there are endless possibilities for partying in Wroclaw, especially in the summer months when temporary bars and relaxation zones open their doors to the public along by the Odra river.

“We celebrate the closing of each project in one of the thousands of clubs in the city.”
Some advice for new Klipfolio builders
“Don’t try and build your ‘Death Star’ at once. Start off by taking a few minutes to build a simple visualization, and then work on perfecting it until it answers exactly what your business needs it to.”
Related Articles

5 tips to understand (and organize) your restaurant data
By Saleem Khatri — June 9th, 2026
6 dashboards I use daily to run my SaaS company
By Allan Wille, Co-Founder — April 10th, 2026
Business Metrics vs. KPIs: What’s the Difference?
By Jonathan Taylor — March 13th, 2026
