A true no coding experience: Building metrics with BigQuery and Cervinodata in under two minutes


Summary - Klipfolio and Cervinodata for BigQuery are a perfect combination. Here's why.
Summary
Building metrics in Klipfolio PowerMetrics with BigQuery as a data source is easy. Adding Cervinodata for BigQuery to the mix makes multi-client, multi-account, digital advertising and website performance reporting a true no coding experience. This blog will show you why Klipfolio and Cervinodata for BigQuery are a perfect combination.
Blown away by the power of PowerMetrics
As a big fan and long term partner of Klipfolio (since early 2014), Cervino Marketing has been engaged in PowerMetrics since its first beta. We were blown away by how easy it is to use PowerMetrics to display, for instance, the trend in sessions from your website(s). Without writing one line of code, you can see sessions by day, by month, for the last 7 days, or this year. Filter by channel and display sessions from mobile users only. You can even use the Sessions Metric on the dashboard multiple times as different visualizations to get an instant view of different angles of your data.
We have not come across any other dashboard platform that makes it that easy.
Building multi-platform & multi-client PowerMetrics
Even if you want to combine multiple data sources, using PowerMetrics is still your best option. In the screenshot above, we used multiple Google Analytics views. Klipfolio offers different ways to blend data sources and create calculated metrics. Google Data Studio or other dashboard platforms will still not give you a better user experience.
Read more about the differences between Data Studio and Klipfolio.
But if you need to blend more than a few data sources or if you have to perform these “blending tasks” frequently, it is a good idea to prepare your data before using it in Klipfolio.
Use case: Monitoring total spend from your multiple platforms
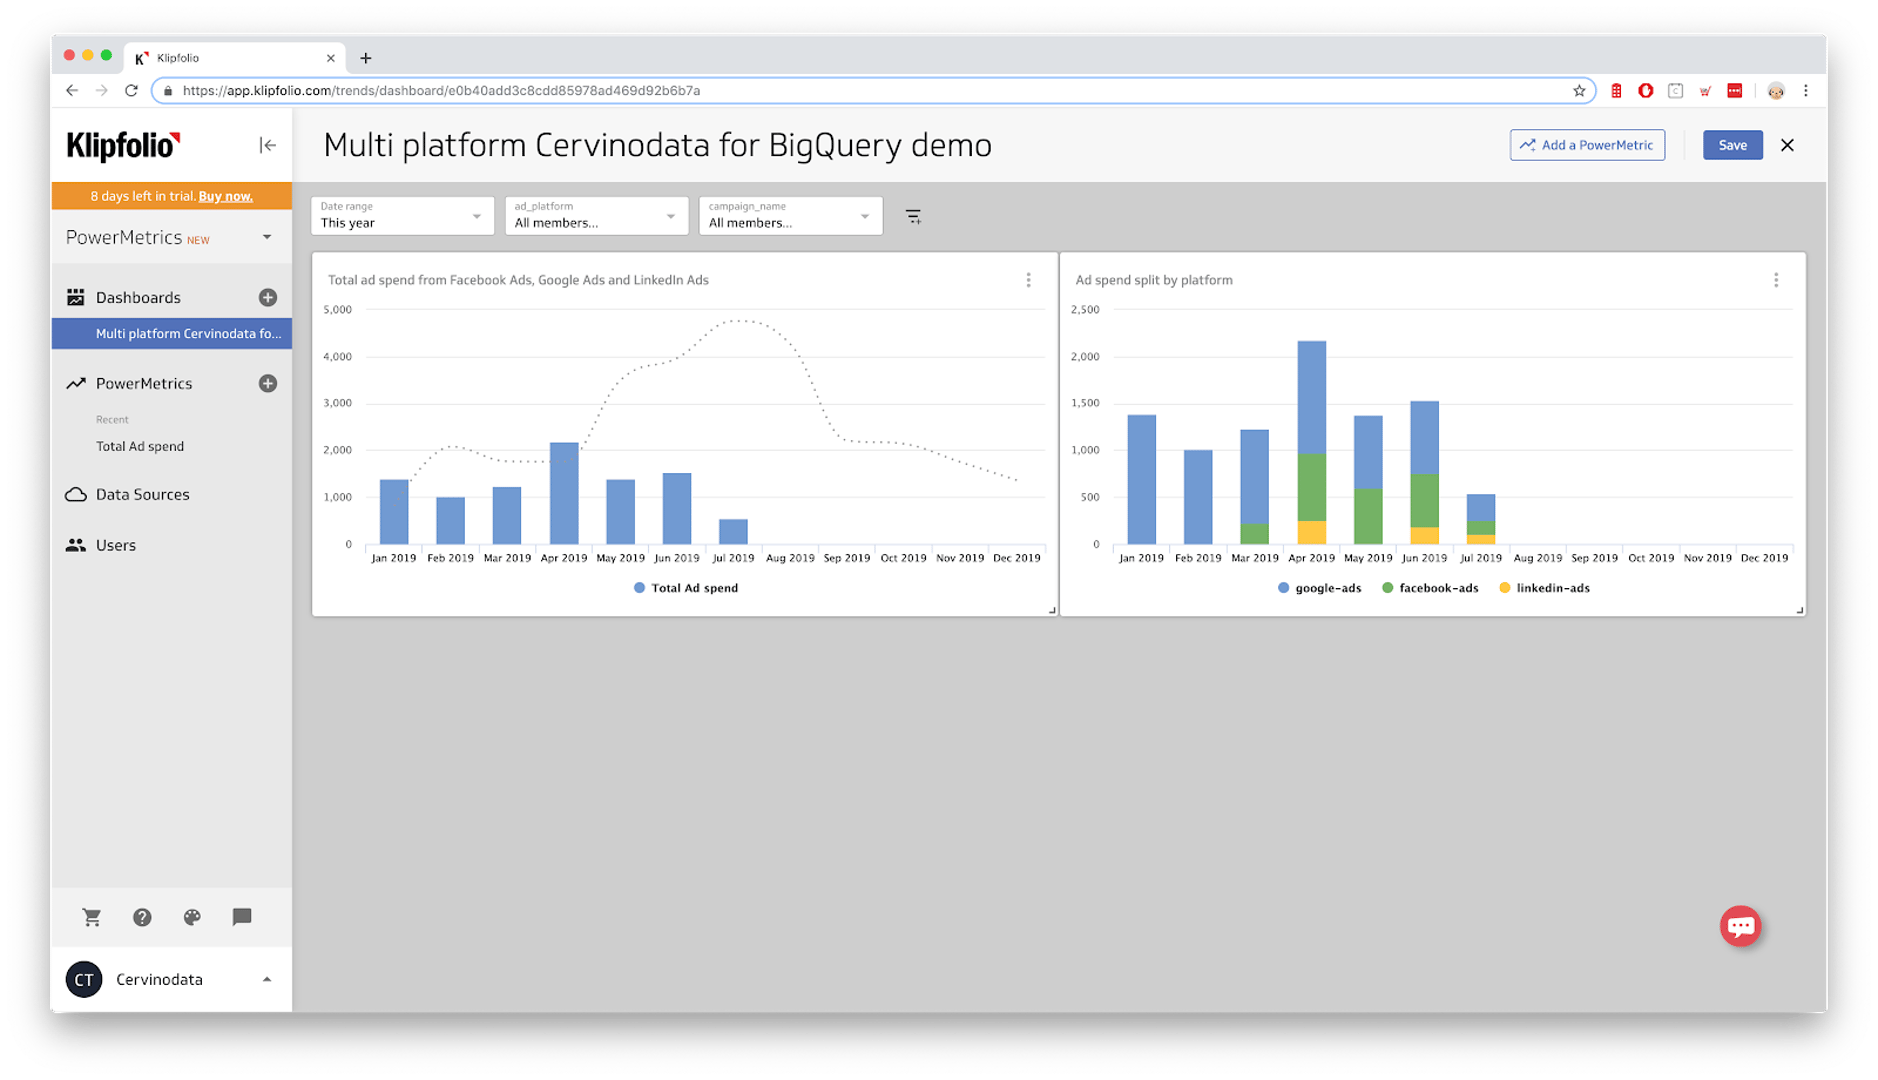
For instance, if you want to monitor the spend of your “Summer Campaign” with specific campaigns from Google Ads, Facebook Ads and LinkedIn Ads, you want a Metric that shows you the total spend across those platforms, by platform, by day. And be able to filter specific campaigns. And, to make things more interesting, you wish to compare this year’s results with last year, of course.
In this example, you would need:
1) Historic and current data from Google Ads, Facebook Ads & LinkedIn Ads
2) Data available per day
3) Data available by platform
4) Data available by campaign
5) A calculated metric (the total spend: the sum of spend for each platform)
Preparing your data before using it in Klipfolio might be easier in this case.
Data storage
But data preparation requires that the data is stored somewhere. And that’s where many marketers run into trouble. Getting the key performance metrics from multiple ad platforms together in one place and keeping it up to date is essential, but not a lot of fun. In particular, if you have large data sets or many accounts from multiple platforms. Agencies have this challenge for each of their clients. It’s tedious work doing this manually, and automating it requires time from your IT colleagues. And they do not like this part either. We built Cervinodata to solve this problem. Cervinodata allows you to connect to your ad platforms and to Google Analytics. It collects your data and brings it together in a central database.
We have chosen Google BigQuery as the central storage destination for your data.
Why BigQuery?
Google BigQuery is a great place to bring all your data together. It allows you to create multiple tables and link those tables together. BigQuery is fast, it’s cheap and it’s used by many developers and data scientists. And Klipfolio has a native integration with BigQuery.
So, we are all set, right?
Well not exactly. The catchphrase is “it’s used by many developers and data scientists”. For those folks (the 1%) it’s a blast because they are fluent in writing queries in SQL. But for everybody else (the 99%, including me), we need the 1% to get it to work. And the 1% is always too busy.
So, now what?
Cervinodata for BigQuery
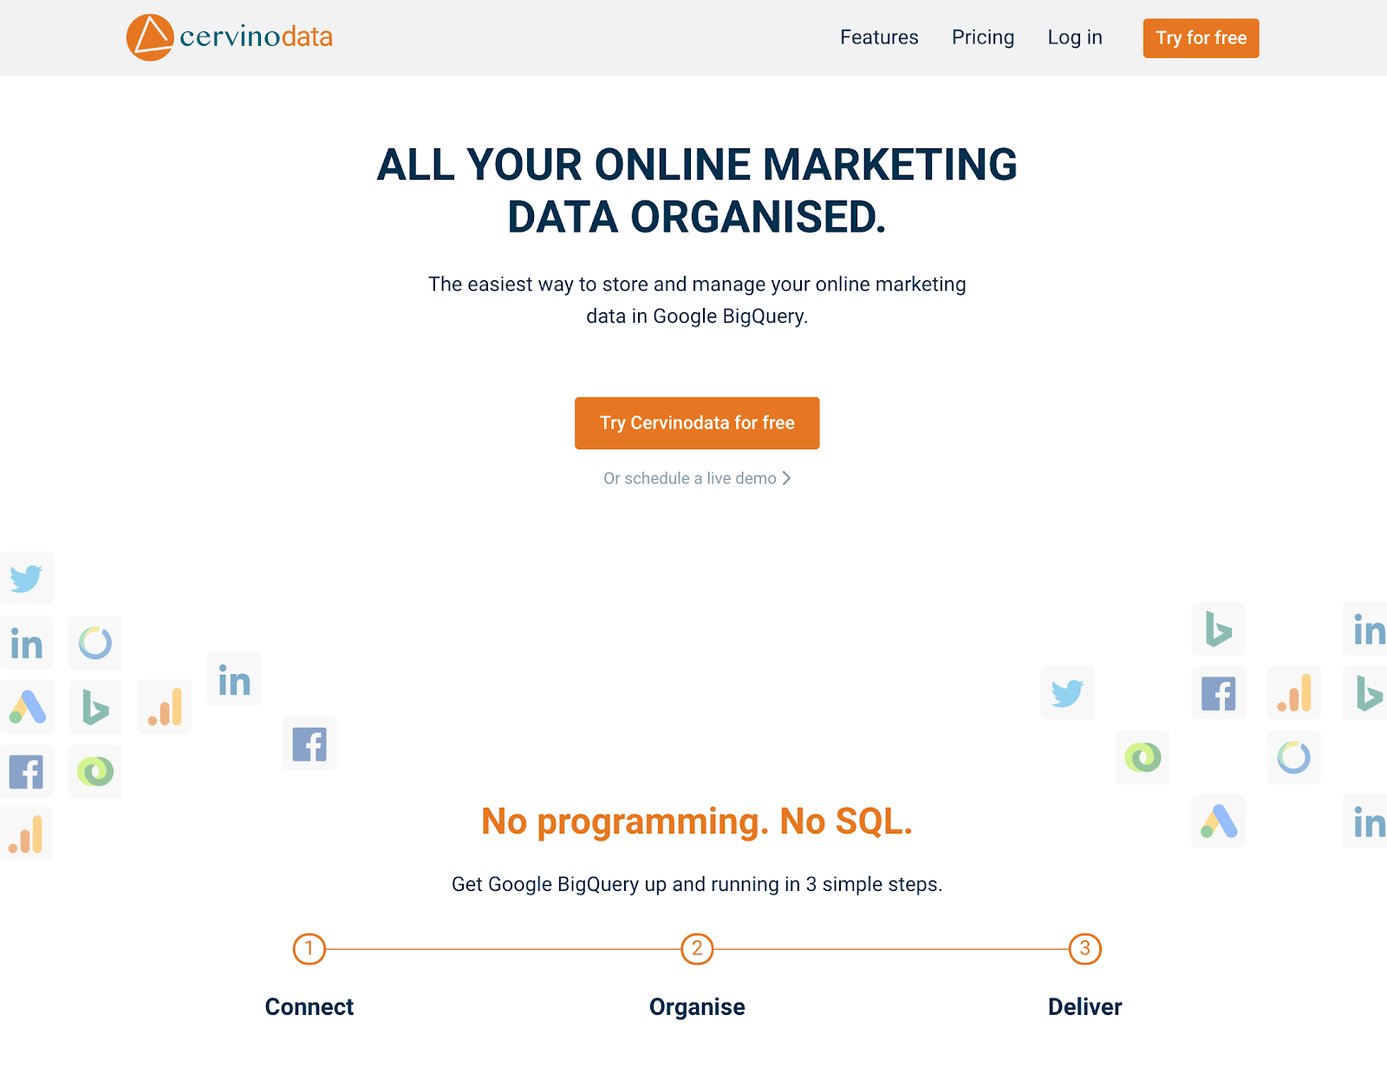
We’ve built Cervinodata for BigQuery with the mission to put the data directly in the hands of the 99% of people that actually need it, but are non-techy. With Cervinodata you can get all your advertising and website performance metrics in BigQuery and keep it up-to-date without writing any code. This means you will not need your IT department to help you set it up. How awesome is that?
And we’ve built a simple to use Query Builder that allows people (like myself) to create SQL queries. Simply paste the query in the native BigQuery connector in Klipfolio and voilá, a multi-layered data source is available in Klipfolio.
Scott Lawrence, Senior Director, Product Management & Documentation at Klipfolio:
“For marketers or digital agencies who are using multiple advertising platforms for their campaigns and need to combine data for a single view of spend and impact, Cervinodata for BigQuery is a great add-on to Klipfolio. Users can prepare, blend and store their data before using it in their Klipfolio PowerMetrics and dashboards, which can accelerate their dashboard creation efforts.”
See how easy it is to build a Metric
It will take you a bit of time to set up Google Cloud, Cervinodata and if you do not already have one, sign up for a Klipfolio account. But once you’re all set with that, just follow these simple steps:
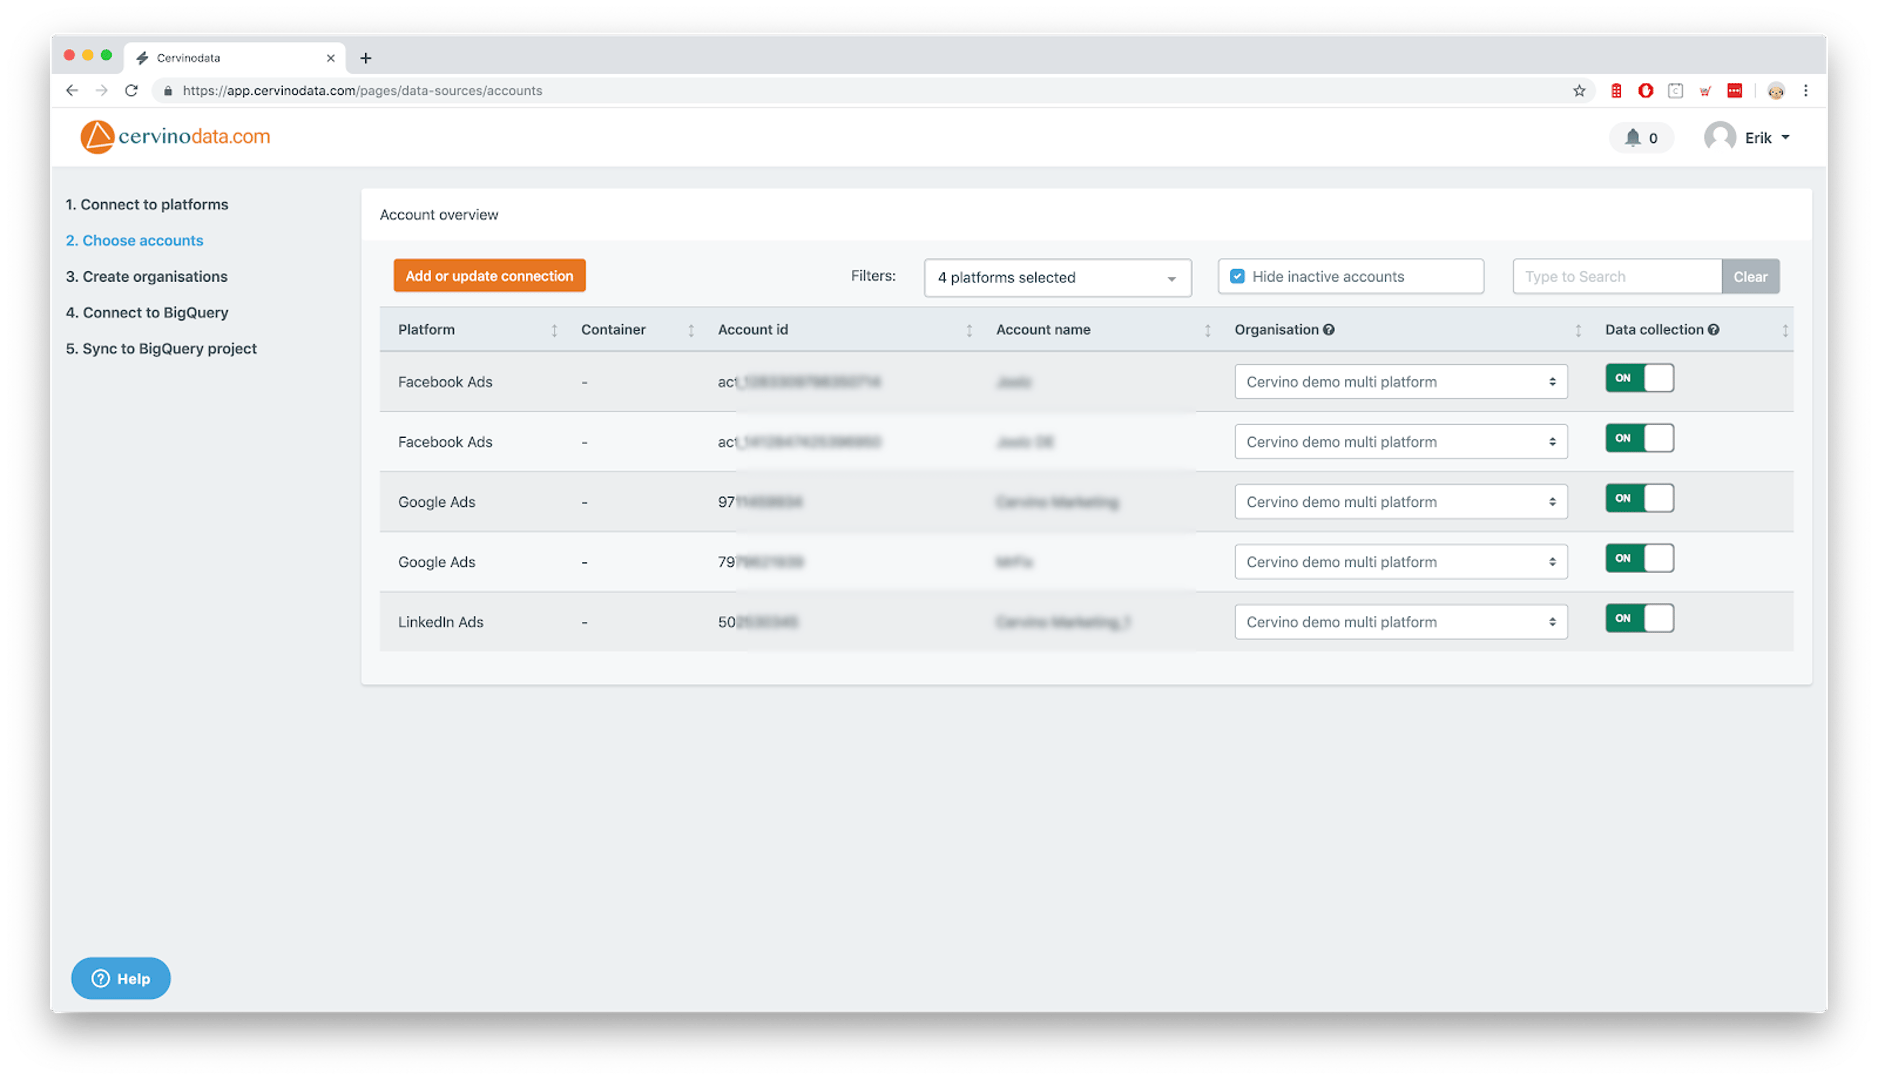
Step 1: Switch accounts ON in Cervinodata
First, you need to decide which data you wish to report on. In the Cervinodata interface, you can easily switch the right accounts ON. When you do, the historic data will be collected and will automatically sync to the BigQuery project you chose during setup.
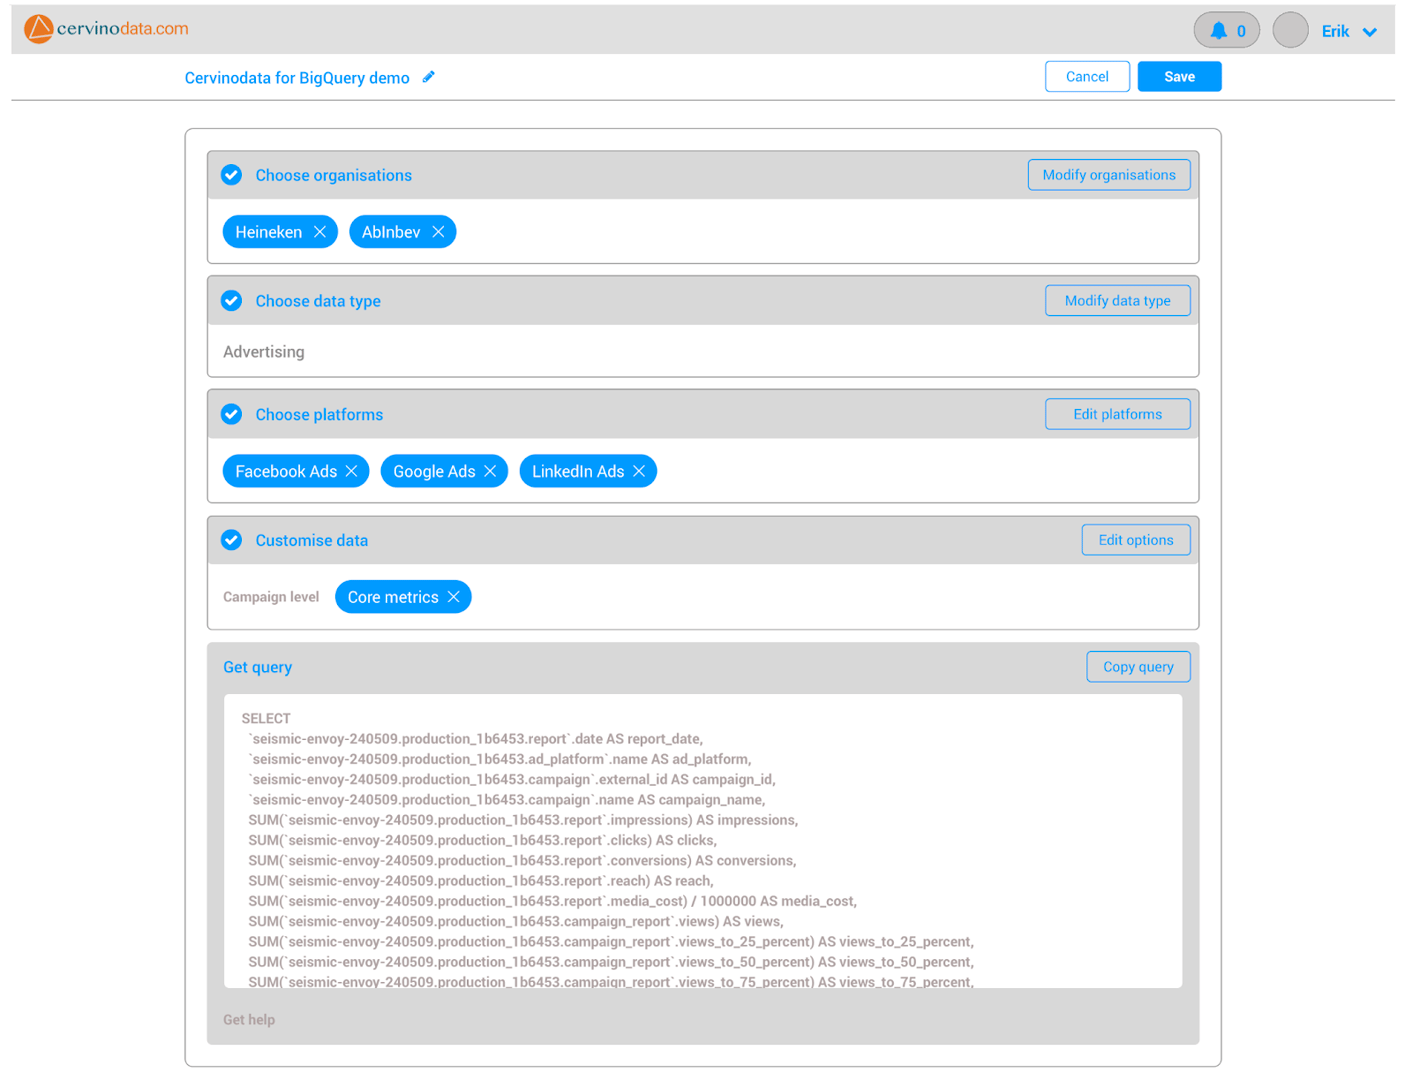
Step 2: Use the Query builder in Cervinodata
Next, go to the query builder in Cervinodata, select the data you wish to show in Klipfolio and press Copy to copy the query for BigQuery.
Step 3: Create a Metric in Klipfolio
In Klipfolio, follow the steps to create a new Metric. Choose BigQuery as the service connector type, choose “Create a custom Google BigQuery data source and paste the Query you created with the query builder.
Step 4: Visualise your data as you like
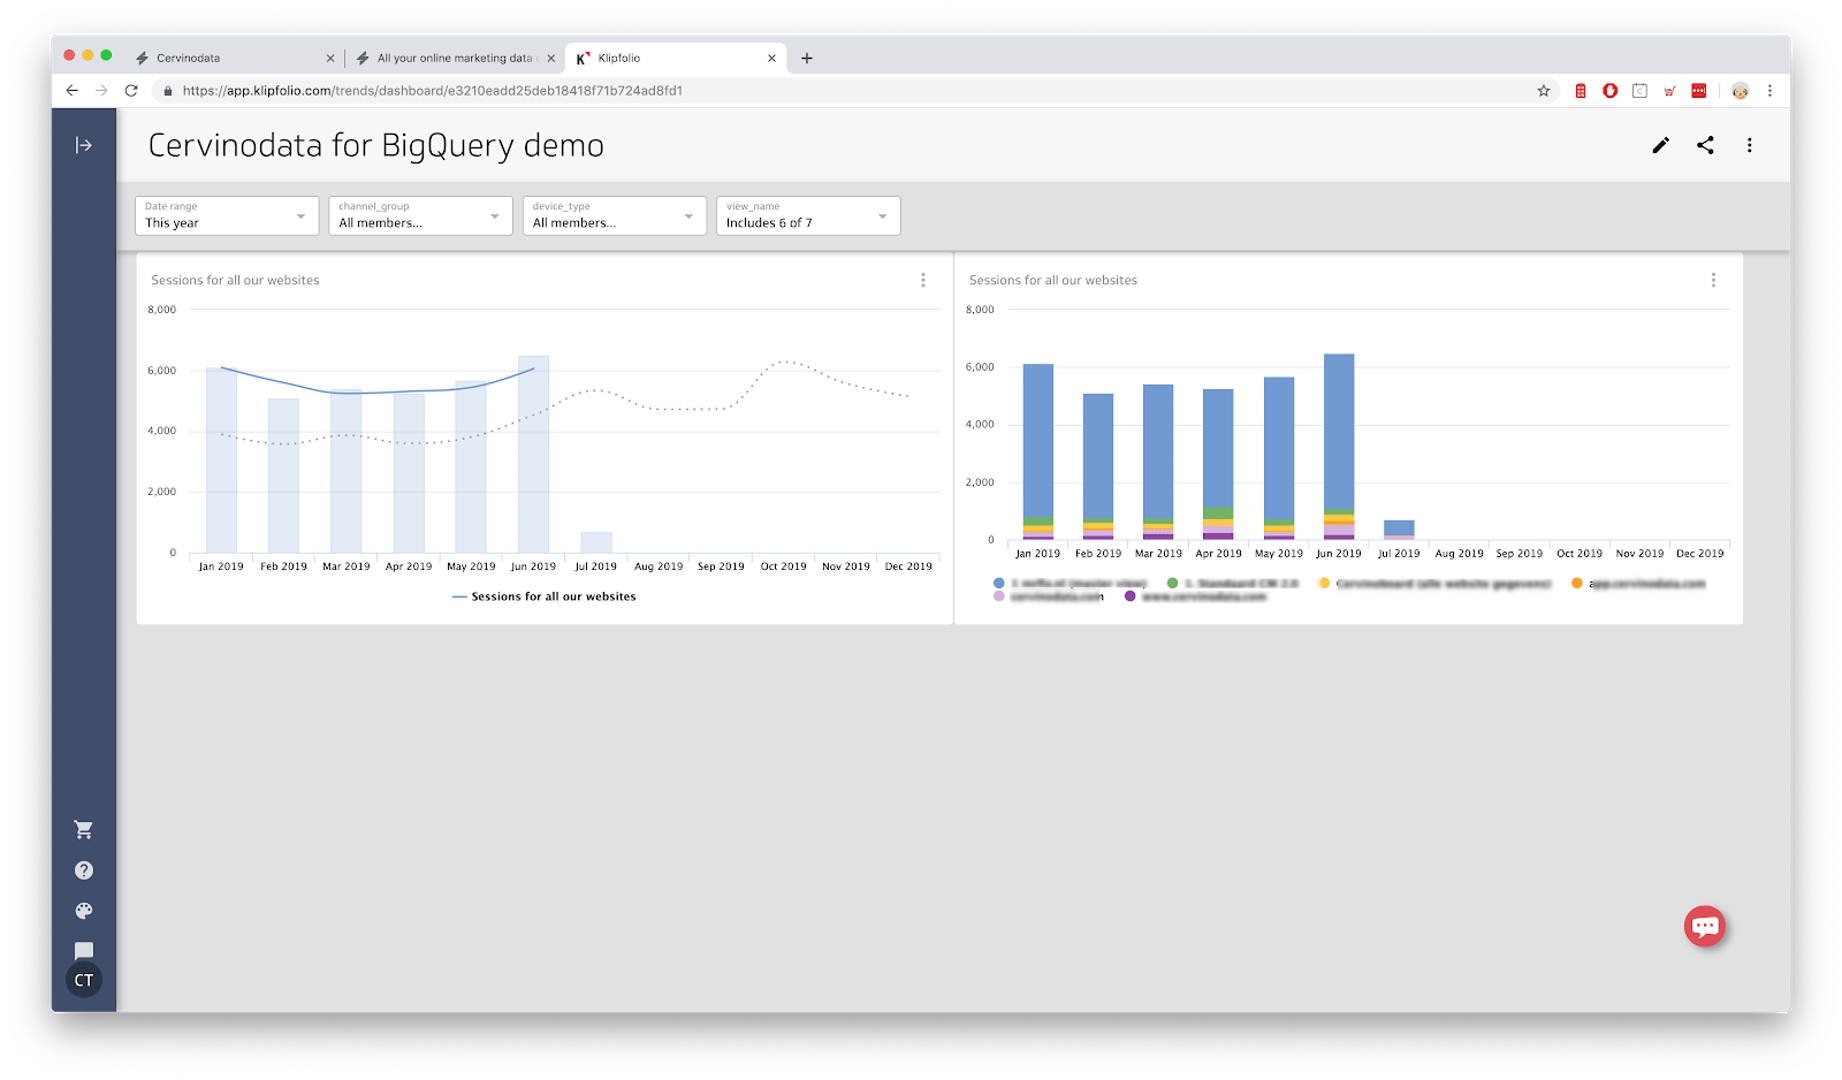
You’re done! If you wish, you can adjust your Metric to reflect the way you wish to present it. For example by changing the time dimension from “Last 7 days” to “This year”, adding a filter or change the visualization from a bar chart to a line chart. In the screenshot below, I have placed the same Metric on the dashboard and configured them differently to gain more insight from a single Metric.
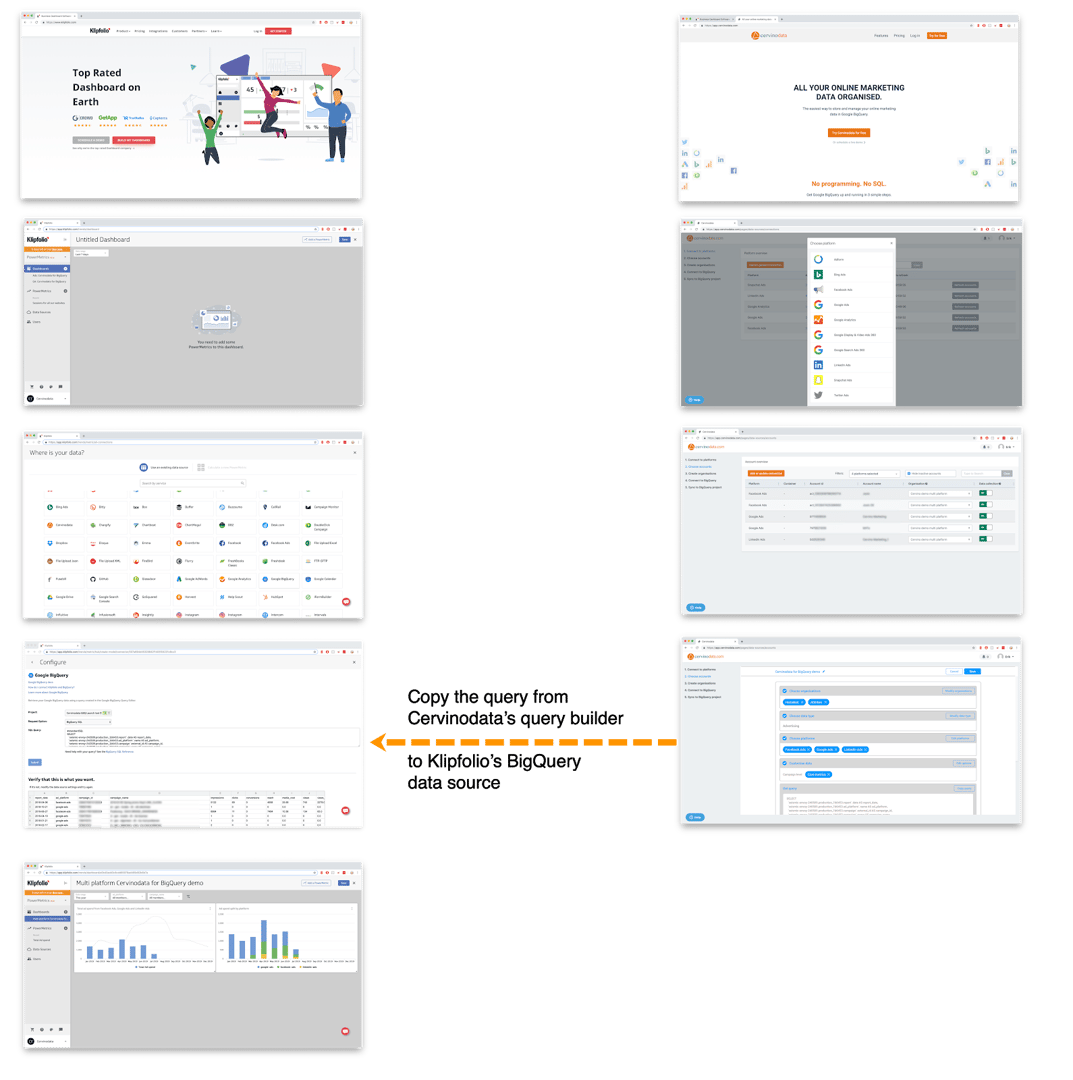
Summary: see the flow
In the images below you can see the visual summary of how to build a Metric using Cervinodata.
BONUS!
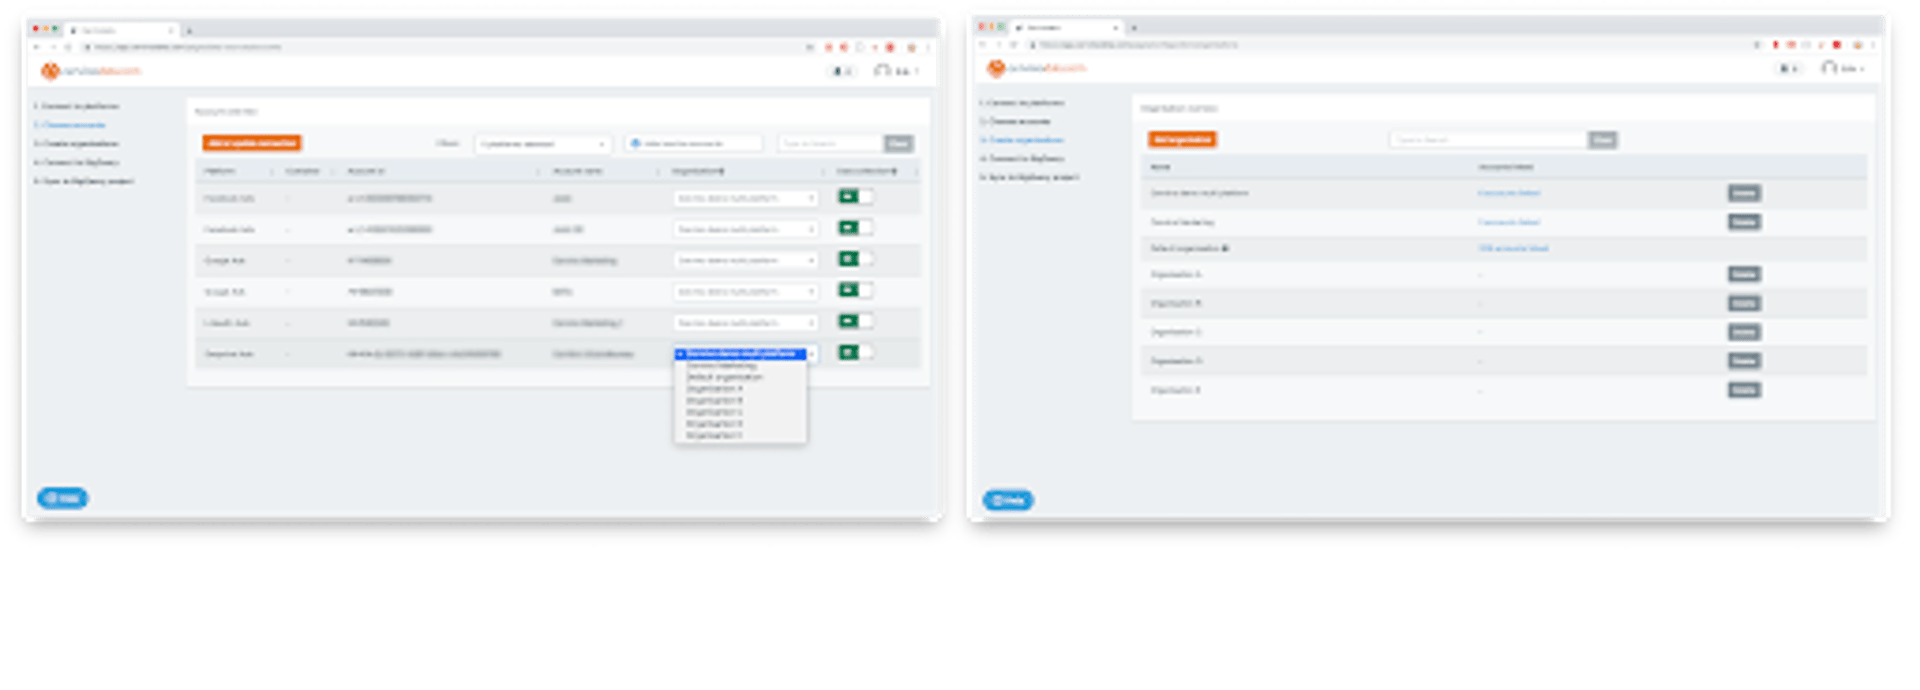
But wait, there’s more! The powerful combination of Cervinodata and Klipfolio makes maintenance a breeze. Suppose you want to add another ad platform to your Total Spend Metric. Just go to Cervinodata, switch on the new ad platform and account(s) you wish to add, connect the views to the right organization, and they will automatically appear in your Klipfolio data source (after the automatic daily sync from Cervinodata to BigQuery or a manual refresh).
And if you want to leave out an ad platform, just remove it from your organization. It’s that simple.
Check it out yourself
To understand the power of Klipfolio’s PowerMetric and Cervinodata for BigQuery, you simply have to try it yourself. With our free 14 day trial and accessible pricing there is no reason not to give it a go.
Related Articles

Business Metrics vs. KPIs: What’s the Difference?
By Jonathan Taylor — March 13th, 2026
The Hidden Value of SaaS Sign Up Rate Benchmarks
By Priyaanka Arora — January 10th, 2026
Top 10 Marketing Dashboard Ideas for Tech Companies