
Summary - Two months after joining Klipfolio, our VP of Customer Success, Rupert Bonham-Carter, discusses what he's learned so far from using the product.
It’s been just over two months since I joined the Klipfolio team. Along with getting to know the company, people, customers and partners, I regularly steal time to use the product to build up my technical acumen and build Klips for my team. Based on my experiences so far, here are some of my key observations and advice for people new to Klipfolio.
As I said to my mother in law when she was learning to use a PC for the first time, you can’t break it, click around, try things, have fun. This is good advice for any new software and certainly applies to Klipfolio.
The first and most obvious advice is to run through our videos and tutorials. Here are a couple of my favourites: Quick Start Guide and List of All Video Clips
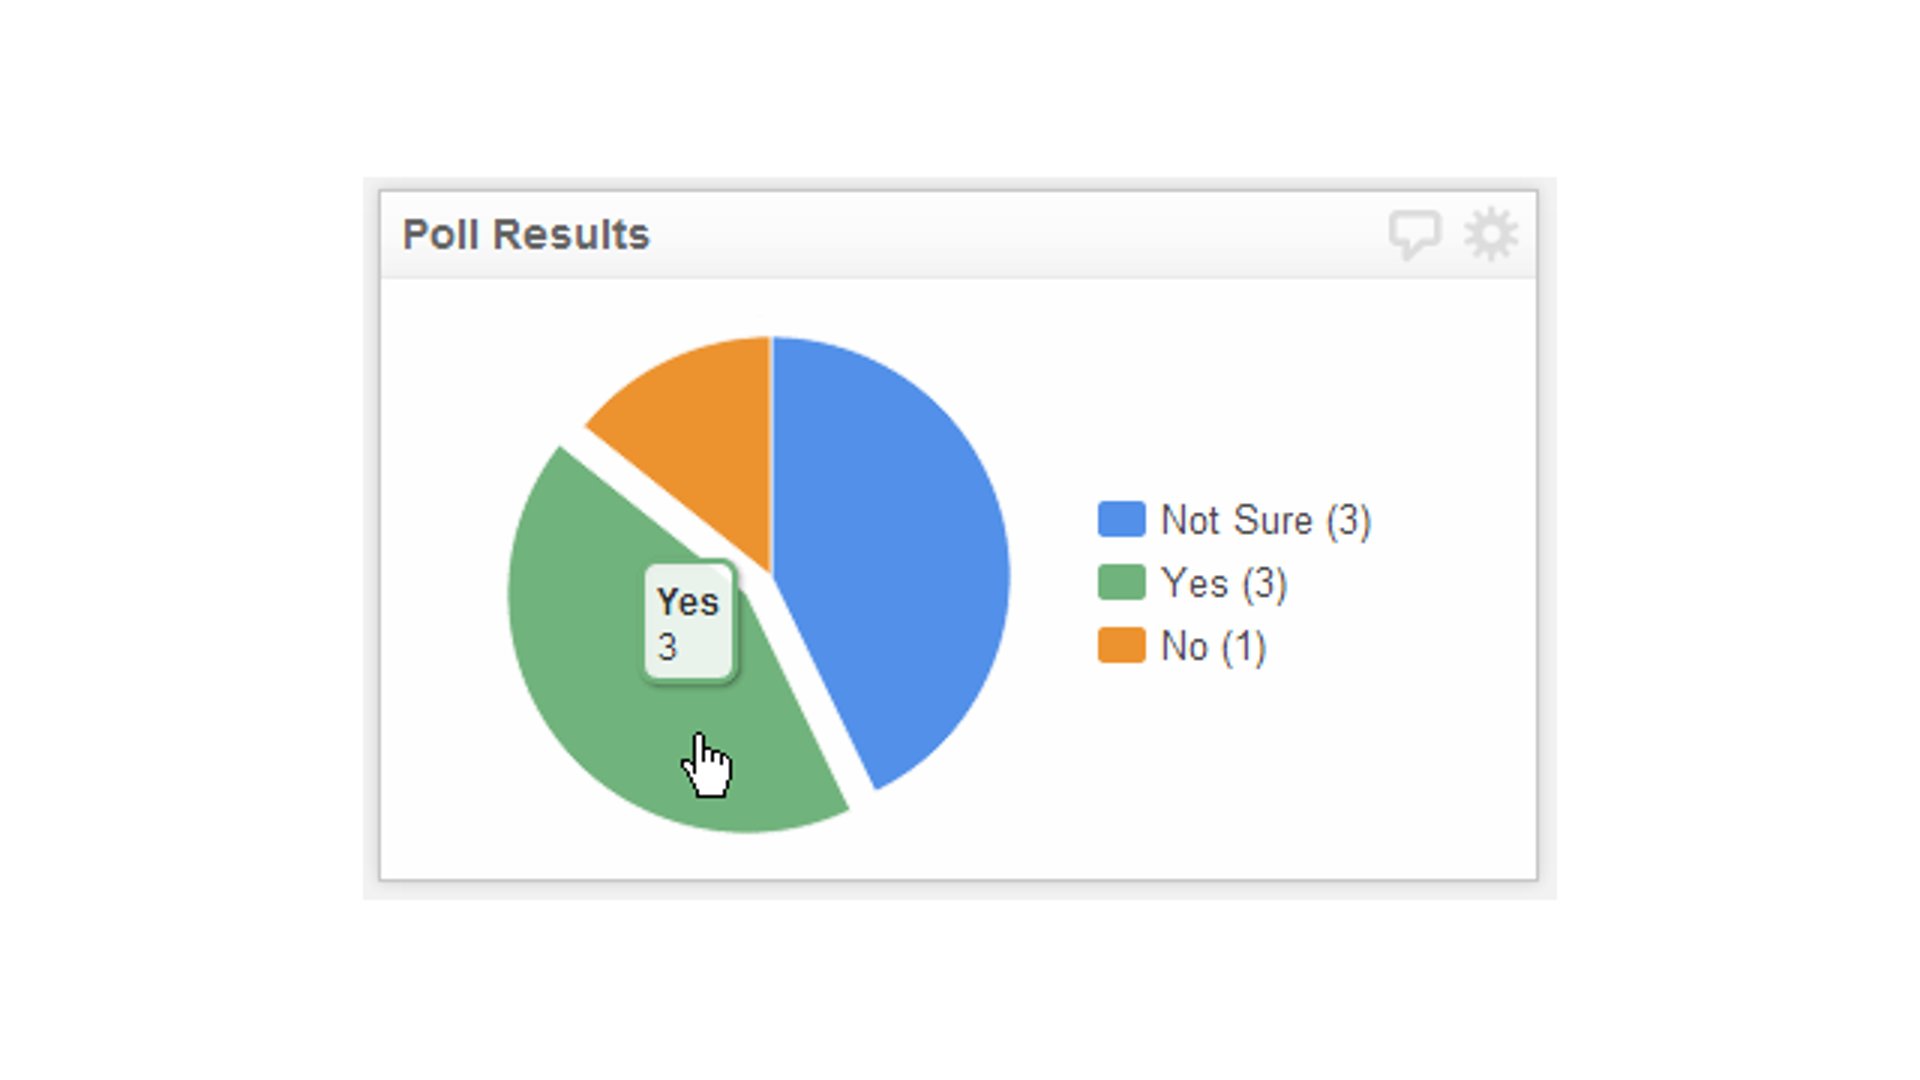
Second, build something with your data using our Klip Gallery. In most cases you’ll need to authenticate using your own credentials (i.e Twitter, Google Analytics, Instagram etc). This is drop dead easy, and will give you a Klip and/or dashboard with your data to get you and your team excited right away.
screenshot of Klip Gallery
Third, add and configure a bunch of different data sources. Upload an Excel or CSV file, connect to a web accessible resource and feel your way around. Connecting to web accessible data is a thing of beauty. This can be seem difficult in the beginning, but by using the userdocs and trying different things, you’ll quickly get the idea. One thing that really helped me was to think of data sources as just the result set of a report, or query in a BI context. For example, our SalesForce.com (SFDC) connector lets you pull your SFDC report data directly in as a refreshable data source. Very Cool.
Finally, and probably the most powerful tip is really to learn how to use the formula bar in the Klip Editor. It is very straight forward and logical. I suggest you walk through building your first Klip or two by using the step by step user docs, guides & videos available Klipfolio Learn Hub. The formula bar is an excel like experience where you can use the long list of functions in combination to manipulate and display your data exactly the way you want. There is a lot of power available to you, so be patient and with practice you’ll be mastering the more powerful features in no time.
Give yourself the time, and have the perseverance to push through the natural learning curve of understanding data sources & the formula editor. When the lights come and you see the power and flexibility, you’ll be hooked. Happy Dashboarding.
Related Articles

Klipfolio Partner How-To #1: Duplicating dashboards across client accounts
By Stef Reid — November 27th, 2025
The Starter Guide to Dashboard Design
By Emily Hayward — September 24th, 2025
What is a data dashboard?
By Emily Hayward — August 18th, 2025