
Summary - Learn how to structure UX research to identify user problems and validate solutions. This guide walks through a practical five-step cycle using a real case study from improving dashboard software.
Understanding your users' pain points is essential to improving your product. Without knowing where users struggle and why, you miss the chance to fix what matters most. That's where UX research comes in—a systematic approach to gathering insights from real user behaviour and feedback throughout your design and development process.
The good news? You don't need a massive budget or advanced expertise to get started. This guide shows you how to structure UX research to make data-driven decisions, using a real case study from our experience at Klipfolio.
The core cycle: hypothesis and testing
UX research follows a simple, repeating cycle:
- Generate a hypothesis about what's causing a problem.
- Test that hypothesis with real users or data.
As you move through cycles, your focus narrows. Each round of testing brings you closer to the root cause and a workable solution.
A helpful rule of thumb: qualitative methods (interviews, observation) excel at hypothesis generation, while quantitative methods (surveys, analytics) validate whether your hypothesis holds true across a larger group.
Our case study: solving a conversion problem
We noticed our trial users weren't converting to paying customers at the rate we expected. The challenge was clear: find out why, then fix it.
Step 1: Generating an initial hypothesis
We started with semi-structured interviews—conversations with trial users who didn't convert. We had a framework of questions but let participants guide the discussion naturally.
Within a dozen conversations, a pattern emerged. Users appreciated the power and flexibility of our dashboard tool, but the learning curve felt steep. They worried about the time investment needed to get set up. Most of their frustration centred on the Editor—the interface where users build and customize dashboards.
Our hypothesis: The Editor was too difficult to use, which prevented trial users from experiencing the tool's full potential.
To add context, we also interviewed successful trial users who had converted to paying customers. Interestingly, they reported similar struggles—but they'd pushed through, spending extra hours learning the tool outside work time. This confirmed the problem was real; some users simply gave up before reaching that breakthrough moment.
Tip: Interviews reveal patterns quickly but have limitations. The Nielsen Norman Group offers practical advice on interviewing users to avoid common pitfalls like leading questions or biased sampling.
Step 2: Validating the hypothesis with surveys
Next, we sent a survey to a broader set of customers: "How difficult is it to master the Editor?" The response was overwhelming—nearly unanimous agreement that the Editor presented a significant barrier.
This validation was crucial. We now had evidence that the Editor's difficulty was a primary reason trial users didn't convert.
We made this survey a permanent part of our cancellation process and track results on a dashboard everyone in the company can see. This keeps the problem visible and reminds the team why improvements matter.
Tip: Avoid leading questions. Asking "Does slow performance bother you?" guarantees "yes." Instead, ask users to rank multiple issues by impact: "Which of these factors most influenced your decision not to convert?" This yields actionable insights.
Step 3: Pinpointing the specific problems
We knew the Editor was the issue, but not exactly what to fix. Usability testing provided the answer.
We observed five users attempting a basic task—creating a bar chart from sample data. Within minutes, we spotted where they stumbled, what confused them, and where the interface failed to guide them.
We supplemented this with heuristic evaluations (our team reviewing the interface against usability principles) and expert walkthroughs. Together, these methods created a detailed map of pain points. We used that map to build a prioritized roadmap of improvements.
Tip: Steve Krug's Rocket Surgery Made Easy is an excellent introduction to usability testing. It's practical, concise, and emphasizes that you don't need perfection—just clarity.
Step 4: Testing your solutions
Finding a solution is only half the battle. You must test it with real users.
When you first observe users, behaviour often surprises you—they do things you didn't expect, which sparks new ideas. Over time, patterns crystallize. After we updated the Editor interface and ran the same usability test again, we could directly compare how user behaviour and outcomes changed.
Tip: You only need three to five participants to uncover roughly 80% of critical issues in a task. This means you can iterate quickly. The key is testing the right user type; with small sample sizes, recruiting the wrong audience skews results.
Step 5: Monitoring behaviour during rollout
Before releasing changes broadly, we used usability testing to reduce risk. But our Editor improvements were extensive, so we rolled them out incrementally—a few changes at a time—so we could isolate which changes had the biggest impact.
A/B testing proved invaluable. By randomly assigning users to groups experiencing different versions (or no change), we isolated the effect of each modification. We observed a meaningful increase in user satisfaction scores collected within the Editor itself.
Tip: Many tools support ongoing metrics and A/B testing. We use Mixpanel and Google Tag Manager for general tracking, and Google Analytics for broader user behaviour analysis. For targeted A/B tests, we've built custom implementations and also rely on industry-standard platforms for smaller, faster experiments.
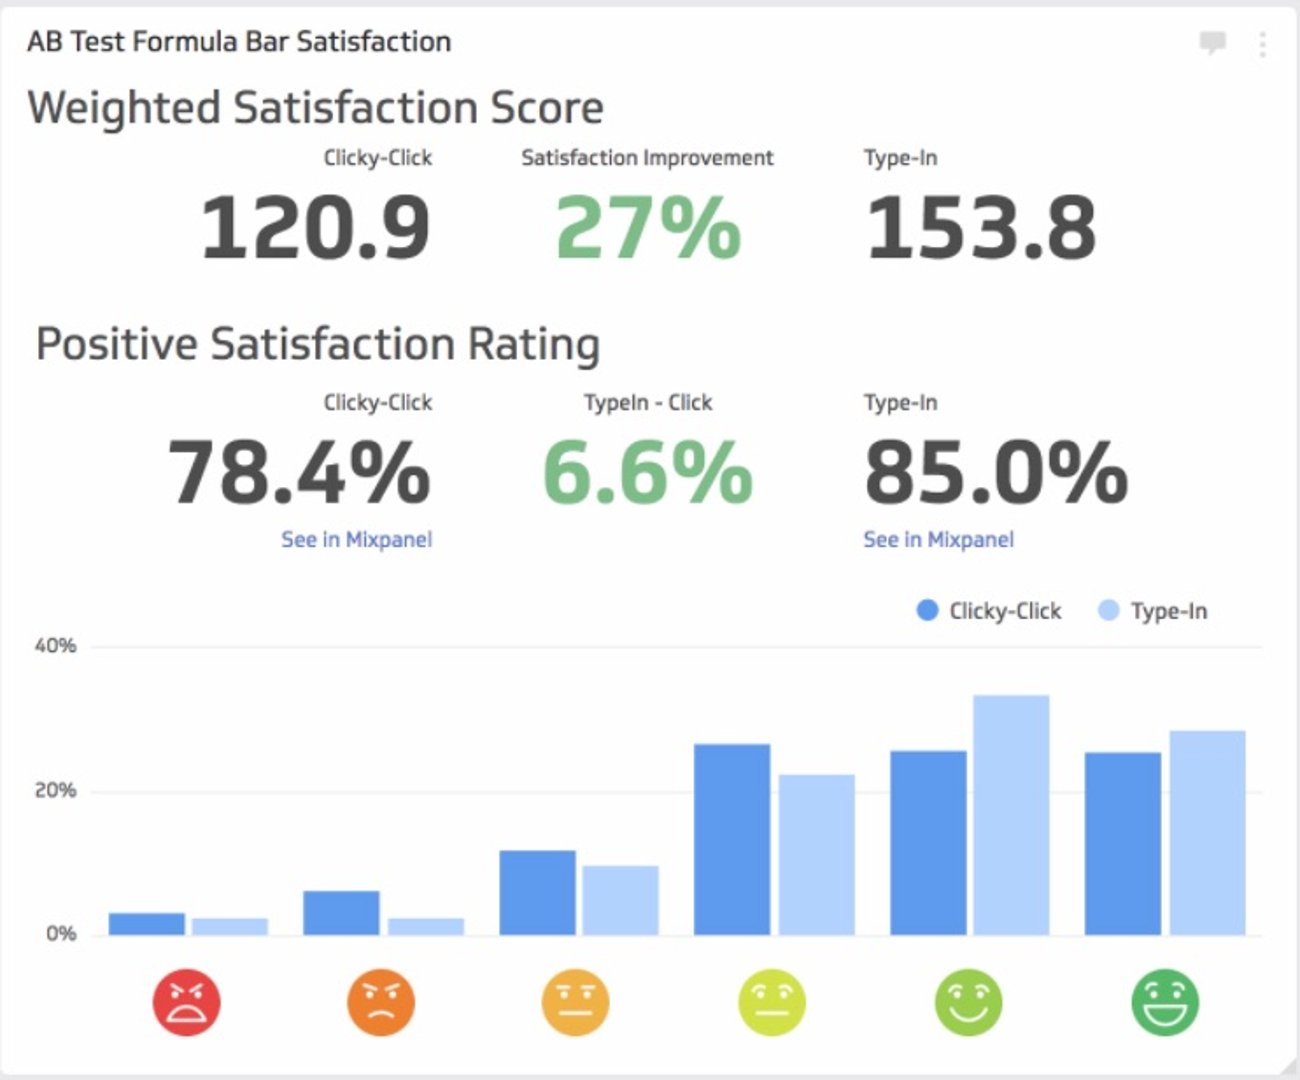
One insight stood out: users familiar with Google Sheets or Excel—or simply more skilled with our tool—preferred typing formulas manually rather than clicking buttons. We built a type-in formula feature and saw satisfaction improve compared to a button-only interface. This small change had outsized impact because we listened to how different user segments wanted to work.
Why structure matters
UX research doesn't require a large budget, a dedicated team, or advanced statistics. What it does require is structure—a clear cycle of hypothesis, testing, and iteration.
Structured research helps you:
- Guide decisions with evidence instead of assumptions.
- Inform design by understanding real user needs.
- Reduce risk before investing in major changes.
- Validate results so you know improvements actually work.
The best time to start is now. Even small amounts of research—a handful of interviews, a focused usability test, a targeted survey—compound over time. Apply this cycle at every stage of development, and you'll build products that users love to use.
Related Articles

The 5 ways to make your business partnership last a lifetime
By Shaughn Finnerty — April 10th, 2026
Klipfolio Partner How-To #1: Duplicating dashboards across client accounts
By Stef Reid — November 27th, 2025
Klipfolio Partner How-To #2: Company Properties can simplify client set-up
By Stef Reid — November 26th, 2025